

Business Intelligence Dashboard
Sean, Industry Editor
Oct 08, 2024
A Business Intelligence Dashboard is a powerful tool that lets you visualize and interact with data. It plays a crucial role in modern business environments by providing real-time insights into key performance indicators. Understanding these dashboards empowers you to make informed decisions, enhancing your ability to track performance and identify trends. By offering an at-a-glance overview, BI dashboards simplify complex data, making it accessible for everyone in your organization. This accessibility fosters better decision-making and strategic planning, ensuring you stay ahead in a competitive market.
Understanding Business Intelligence Dashboard
Definition and Overview of Business Intelligence Dashboard
What is a BI Dashboard?
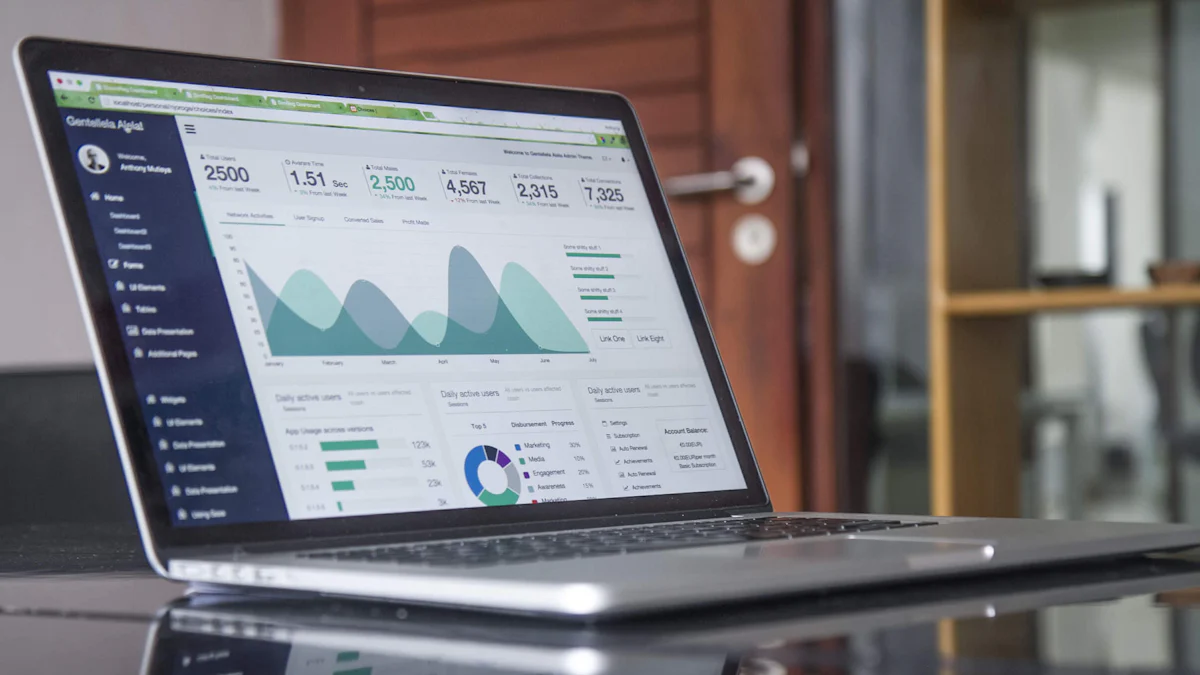
A Business Intelligence Dashboard serves as a dynamic tool that allows you to visualize and interact with data. It acts as a central hub where you can access various key performance indicators (KPIs) and data points. By using graphs, charts, and reports, BI dashboards provide a quick overview of critical data, making it easier for you to manage information and make informed decisions. These dashboards are essential for deriving valuable insights from large data sets, combining both structured and unstructured data to give you a comprehensive view of your business performance.
Key Components of a BI Dashboard
A well-designed BI dashboard includes several key components that enhance its functionality:
-
Data Visualization: This component uses charts, graphs, and maps to present data in an easily digestible format. It helps you quickly understand complex data sets.
-
Dashboard Layout: A user-friendly layout ensures that you can navigate the dashboard effortlessly, accessing the information you need without confusion.
-
Global Filters: These allow you to customize the data displayed, enabling you to focus on specific metrics or time periods relevant to your analysis.
-
Reporting: This feature provides detailed reports that you can use for deeper analysis and strategic planning.
Business Intelligence Dashboard vs. Business Intelligence Report
Differences in Functionality
While both BI dashboards and BI reports aim to provide insights, they differ in functionality. A Business Intelligence Dashboard offers real-time data visualization, allowing you to interact with the data and gain immediate insights. It is designed for quick access and at-a-glance overviews. In contrast, a BI report is more static, providing detailed analysis and historical data. Reports are typically used for in-depth analysis and are often generated periodically.
Use Cases for Each
You might use a BI dashboard when you need to monitor ongoing performance metrics or track real-time changes in your business environment. Dashboards are ideal for daily operations and quick decision-making. On the other hand, BI reports are useful when you require a comprehensive analysis of past performance or need to present detailed findings to stakeholders. Reports are often used for strategic planning and long-term decision-making.
Purpose of Business Intelligence Dashboard
Enhancing Decision-Making
Real-Time Data Access
A Business Intelligence Dashboard provides you with real-time data access, which is crucial for making informed decisions. By having up-to-the-minute information at your fingertips, you can quickly assess your company's performance and respond to changes in the market. This immediate access to data allows you to identify trends as they happen, ensuring that your decisions are based on the most current information available. Real-time data access eliminates the delays associated with traditional reporting methods, giving you a competitive edge in fast-paced business environments.
Data-Driven Insights
Data-driven insights are a cornerstone of effective decision-making. With a Business Intelligence Dashboard, you can analyze data from various sources to uncover patterns and correlations that might not be immediately apparent. This analysis helps you understand the underlying factors driving your business performance. By leveraging these insights, you can make strategic decisions that align with your business goals. The dashboard's ability to present complex data in an easily digestible format ensures that you can focus on actionable insights rather than getting lost in the details.
Improving Operational Efficiency
Streamlining Processes
A Business Intelligence Dashboard plays a vital role in streamlining processes within your organization. By providing a centralized view of key metrics, the dashboard helps you identify inefficiencies and areas for improvement. You can monitor workflows and track progress in real-time, allowing you to make adjustments as needed. This streamlined approach reduces waste and enhances productivity, enabling your team to focus on high-value tasks. The dashboard's visualizations make it easy to spot bottlenecks and optimize processes for better efficiency.
Identifying Trends and Patterns
Identifying trends and patterns is essential for staying ahead in a competitive market. A Business Intelligence Dashboard equips you with the tools to analyze historical data and predict future trends. By recognizing patterns in customer behavior, sales performance, or market dynamics, you can proactively adjust your strategies. This foresight allows you to capitalize on opportunities and mitigate potential risks. The dashboard's ability to present data visually makes it easier for you to grasp complex trends and make data-driven decisions that drive business success.
Features of Effective Business Intelligence Dashboard
User-Friendly Interface
A user-friendly interface is essential for a Business Intelligence Dashboard. It ensures that you can navigate and interact with data effortlessly.
Customization Options
Customization options allow you to tailor the dashboard to your specific needs. You can adjust layouts, select relevant metrics, and create personalized views. This flexibility helps you focus on the most critical data, enhancing your ability to make informed decisions.
Interactive Visualizations
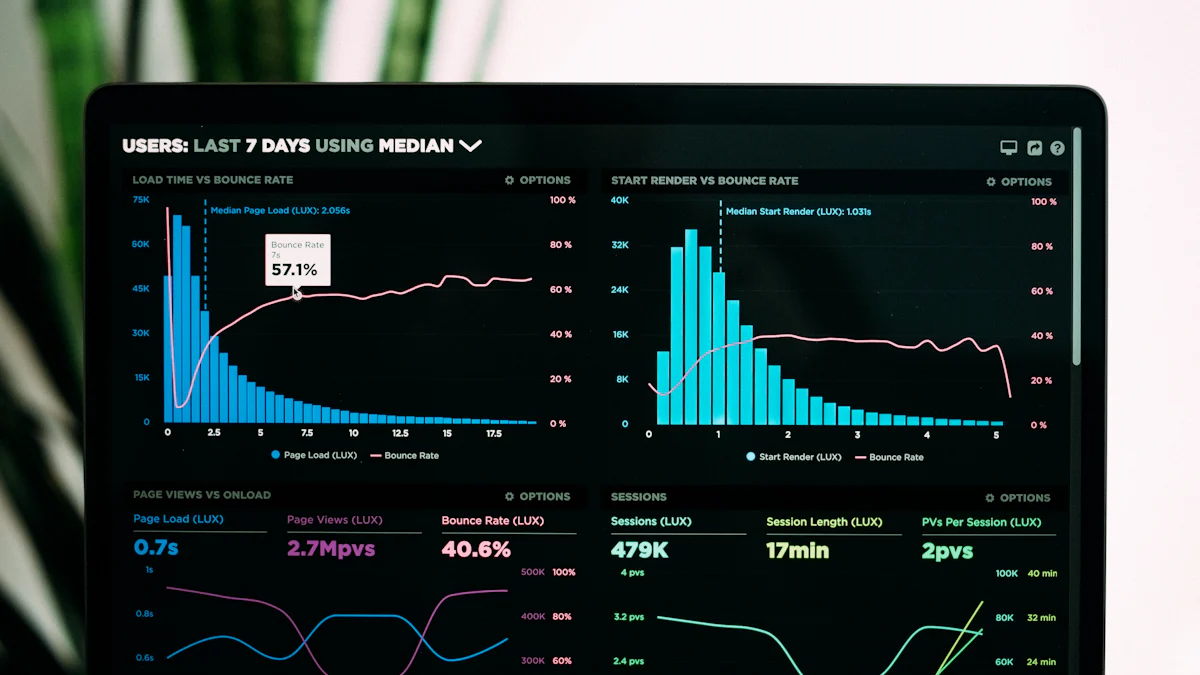
Interactive visualizations transform complex data into easy-to-understand formats. Charts, graphs, and maps enable you to explore data dynamically. By interacting with these visual elements, you can uncover insights and trends that drive strategic planning.
Data Integration Capabilities
Data integration capabilities are crucial for a comprehensive view of your business performance. They ensure that all relevant data is accessible and accurate.
Connecting Multiple Data Sources
Connecting multiple data sources provides a unified view of your business metrics. You can gather information from various departments and systems, creating a holistic picture of your operations. This integration supports more cohesive decision-making.
Ensuring Data Accuracy
Ensuring data accuracy is vital for reliable insights. Accurate data allows you to trust the information presented on your dashboard. Regular updates and validation processes help maintain this accuracy, ensuring that your decisions are based on solid evidence.
Benefits of Using Business Intelligence Dashboard
Increased Productivity
Time-Saving Features
A Business Intelligence Dashboard offers numerous time-saving features that boost your productivity. By automating data collection and visualization, you can quickly access the information you need without sifting through endless spreadsheets. This efficiency allows you to focus on analyzing data rather than gathering it. For instance, Comapi, a provider of multi-channel communication tools, significantly improved management meeting efficiency by implementing Grow’s BI dashboard software. This tool streamlined their data processes, enabling more strategic, data-driven decision-making.
Automation of Routine Tasks
Automating routine tasks is another key benefit of using a BI dashboard. You can set up automated reports and alerts, ensuring that you receive timely updates on critical metrics. This automation reduces manual workload, freeing up your time for more strategic activities. By minimizing repetitive tasks, you enhance overall productivity and ensure that your team can concentrate on high-value projects.
Better Strategic Planning
Forecasting and Predictive Analysis
Business Intelligence Dashboards empower you with forecasting and predictive analysis capabilities. By analyzing historical data, you can identify trends and make informed predictions about future performance. This foresight helps you plan strategically and allocate resources effectively. Executives and managers can use BI tools to run what-if scenarios, discovering important market trends and making the most effective strategic decisions. Data-driven organizations are more likely to succeed, as they can anticipate changes and adapt accordingly.
Aligning Business Goals
Aligning business goals becomes more manageable with a BI dashboard. You can monitor key performance indicators and ensure that your strategies align with your objectives. By having a clear view of your company's performance, you can make adjustments to stay on track. BI dashboards help you align departmental goals with overall business objectives, fostering a unified approach to achieving success. This alignment enhances collaboration and ensures that everyone in your organization works towards common goals.
Limitations of Business Intelligence Dashboard
Data Overload
Managing Large Volumes of Data
You might find that BI dashboards struggle with managing large volumes of data. The sheer amount of information can overwhelm users, making it difficult to extract meaningful insights. Dashboards often present data in a limited space, which can lead to cluttered visuals. This complexity may hinder your ability to focus on critical metrics.
Avoiding Information Overwhelm
To avoid information overwhelm, you need to prioritize the most relevant data. Flashy designs and excessive details can distract from key insights. Simplifying the dashboard layout and focusing on essential metrics can help you maintain clarity. By doing so, you ensure that the dashboard remains a valuable tool for decision-making.
Implementation Challenges
Cost and Resource Considerations
Implementing a BI dashboard involves significant cost and resource considerations. You must invest in the right tools and technology, which can be expensive. Additionally, integrating these systems with existing infrastructure requires time and expertise. Careful planning and budgeting are essential to overcome these challenges.
Training and Adoption Issues
Training and adoption issues can also pose challenges. You need to ensure that your team understands how to use the dashboard effectively. This requires comprehensive training programs and ongoing support. Without proper training, users may struggle to leverage the full potential of the dashboard, limiting its impact on your business.
Implementing Business Intelligence Dashboard
Steps to Successful Implementation
Assessing Business Needs
To implement a Business Intelligence Dashboard effectively, you must first assess your business needs. Begin by identifying the key performance indicators (KPIs) that are crucial for your organization. Determine what data you need to track and analyze to support your strategic goals. Consider both current and future requirements to ensure the dashboard remains relevant as your business evolves. By understanding your specific needs, you can tailor the dashboard to provide the most valuable insights.
Selecting the Right Tools
Choosing the right tools is essential for a successful BI dashboard implementation. Evaluate different software options based on your data size, the specific insights you require, and your team's expertise. Grow.com emphasizes the importance of selecting a tool that aligns with your business objectives and technical capabilities. Look for features such as data integration, customization options, and user-friendly interfaces. The right tool will empower you to visualize data effectively and make informed decisions.
Best Practices
Continuous Monitoring and Updates
Once your BI dashboard is in place, continuous monitoring and updates are vital. Regularly review the data to ensure accuracy and relevance. Update the dashboard as your business needs change or as new data sources become available. This ongoing process helps you maintain the dashboard's effectiveness and ensures that you always have access to the most current information. By staying proactive, you can adapt quickly to market changes and make timely decisions.
Involving Stakeholders
Involving stakeholders in the implementation process enhances the dashboard's success. Engage team members from different departments to gather diverse perspectives and insights. Their input can help identify critical metrics and ensure the dashboard meets the needs of all users. Encourage collaboration and open communication to foster a sense of ownership and commitment. By involving stakeholders, you create a dashboard that supports organizational goals and drives collective success.
Practical Examples and Use Cases of Business Intelligence Dashboard
Industry-Specific Applications
Retail and E-commerce
In retail and e-commerce, Business Intelligence Dashboards transform how you track sales and customer behavior. You can monitor inventory levels, analyze purchasing patterns, and optimize pricing strategies. By visualizing data, you gain insights into customer preferences and seasonal trends. This helps you make informed decisions to enhance customer satisfaction and boost sales.
Healthcare and Pharmaceuticals
In healthcare and pharmaceuticals, BI dashboards play a crucial role in improving patient care and operational efficiency. You can track patient outcomes, manage resources, and ensure compliance with regulations. Dashboards help you identify trends in patient data, allowing for proactive healthcare management. This leads to better treatment plans and improved patient satisfaction.
Case Studies
Successful Implementations
Many companies have successfully implemented BI dashboards to drive growth. For example, a retail chain used dashboards to streamline its supply chain operations. By analyzing real-time data, they reduced stockouts and improved delivery times. This led to increased customer satisfaction and higher sales.
Lessons Learned
From these implementations, you learn the importance of aligning dashboards with business goals. It's crucial to involve stakeholders in the design process to ensure the dashboard meets everyone's needs. Continuous monitoring and updates keep the dashboard relevant and effective. By learning from these examples, you can maximize the benefits of BI dashboards in your organization.
Business Intelligence dashboards are essential tools that enhance data accessibility and decision-making. They provide at-a-glance overviews, making complex data easily understandable. By exploring BI dashboards, you can drive business growth through informed decisions and strategic planning. As technology advances, these dashboards will continue to evolve, offering even more powerful insights and opportunities for success. Embrace the potential of BI dashboards to stay competitive and innovative in today's data-driven world.
FAQ
A Business Intelligence (BI) Dashboard is a tool that helps you visualize and interact with data. It provides a consolidated view of key performance metrics and operational data. By using graphs, charts, and reports, you can quickly understand business-critical information.
A BI Dashboard offers real-time data visualization, allowing you to interact with the data for immediate insights. It's designed for quick access and at-a-glance overviews. In contrast, a BI Report provides detailed analysis and historical data, often used for in-depth analysis and strategic planning.
An effective BI Dashboard includes:
Data Visualization: Uses charts and graphs for easy understanding.
Dashboard Layout: Ensures user-friendly navigation.
Global Filters: Allows customization of displayed data.
Customizable Views: Lets you tailor the dashboard to your needs.
Real-time data access is crucial because it allows you to make informed decisions quickly. You can assess performance and respond to market changes immediately, giving you a competitive edge.
BI Dashboards streamline processes by providing a centralized view of key metrics. You can identify inefficiencies and monitor workflows in real-time, which enhances productivity and reduces waste.
You might encounter challenges like managing large volumes of data, cost considerations, and training issues. Proper planning and stakeholder involvement can help overcome these obstacles.
BI Dashboards support strategic planning by offering forecasting and predictive analysis capabilities. You can align business goals by monitoring key performance indicators and ensuring strategies meet objectives.
Yes, BI Dashboards can be tailored for specific industries like retail, e-commerce, healthcare, and pharmaceuticals. They provide insights into sales, customer behavior, patient outcomes, and more, helping you make informed decisions.

Continue Reading About Business Intelligence Dashboard
10 Must-Have Marketing Agency Reporting Tools for Your Success
Optimize your agency's performance with top reporting tools. Explore analytics, social media, SEO, and more for data-driven decisions and efficiency.
Lewis
Oct 09, 2024
Covers Dashboard: Find Your Perfect Match
Choose the perfect covers dashboard to protect and style your car, enhancing its interior and resale value with the right material and fit.
Lewis
Nov 05, 2024
Customer Data Integration: A Comprehensive Guide
Master customer data integration to enhance business operations by combining data from multiple sources for a comprehensive customer view.
Howard
Sep 07, 2024
Dashboard Cover Choices: Materials and Colors Explained
Discover the best dashboard cover materials and colors to protect and enhance your vehicle's interior with style and functionality.
Lewis
Nov 05, 2024
Dashboard Anywhere Made Easy for Chrysler Employees
Access Dashboard Anywhere easily as a Chrysler employee. Manage payroll, benefits, and schedules 24/7 with simple login steps and troubleshooting tips.
Lewis
Dec 31, 2024
Creating an Excel Dashboard: Easy Steps for Beginners
Learn to create Excel dashboards with templates for easy data visualization and analysis. Perfect for beginners seeking efficient insights.
Lewis
Nov 05, 2024

