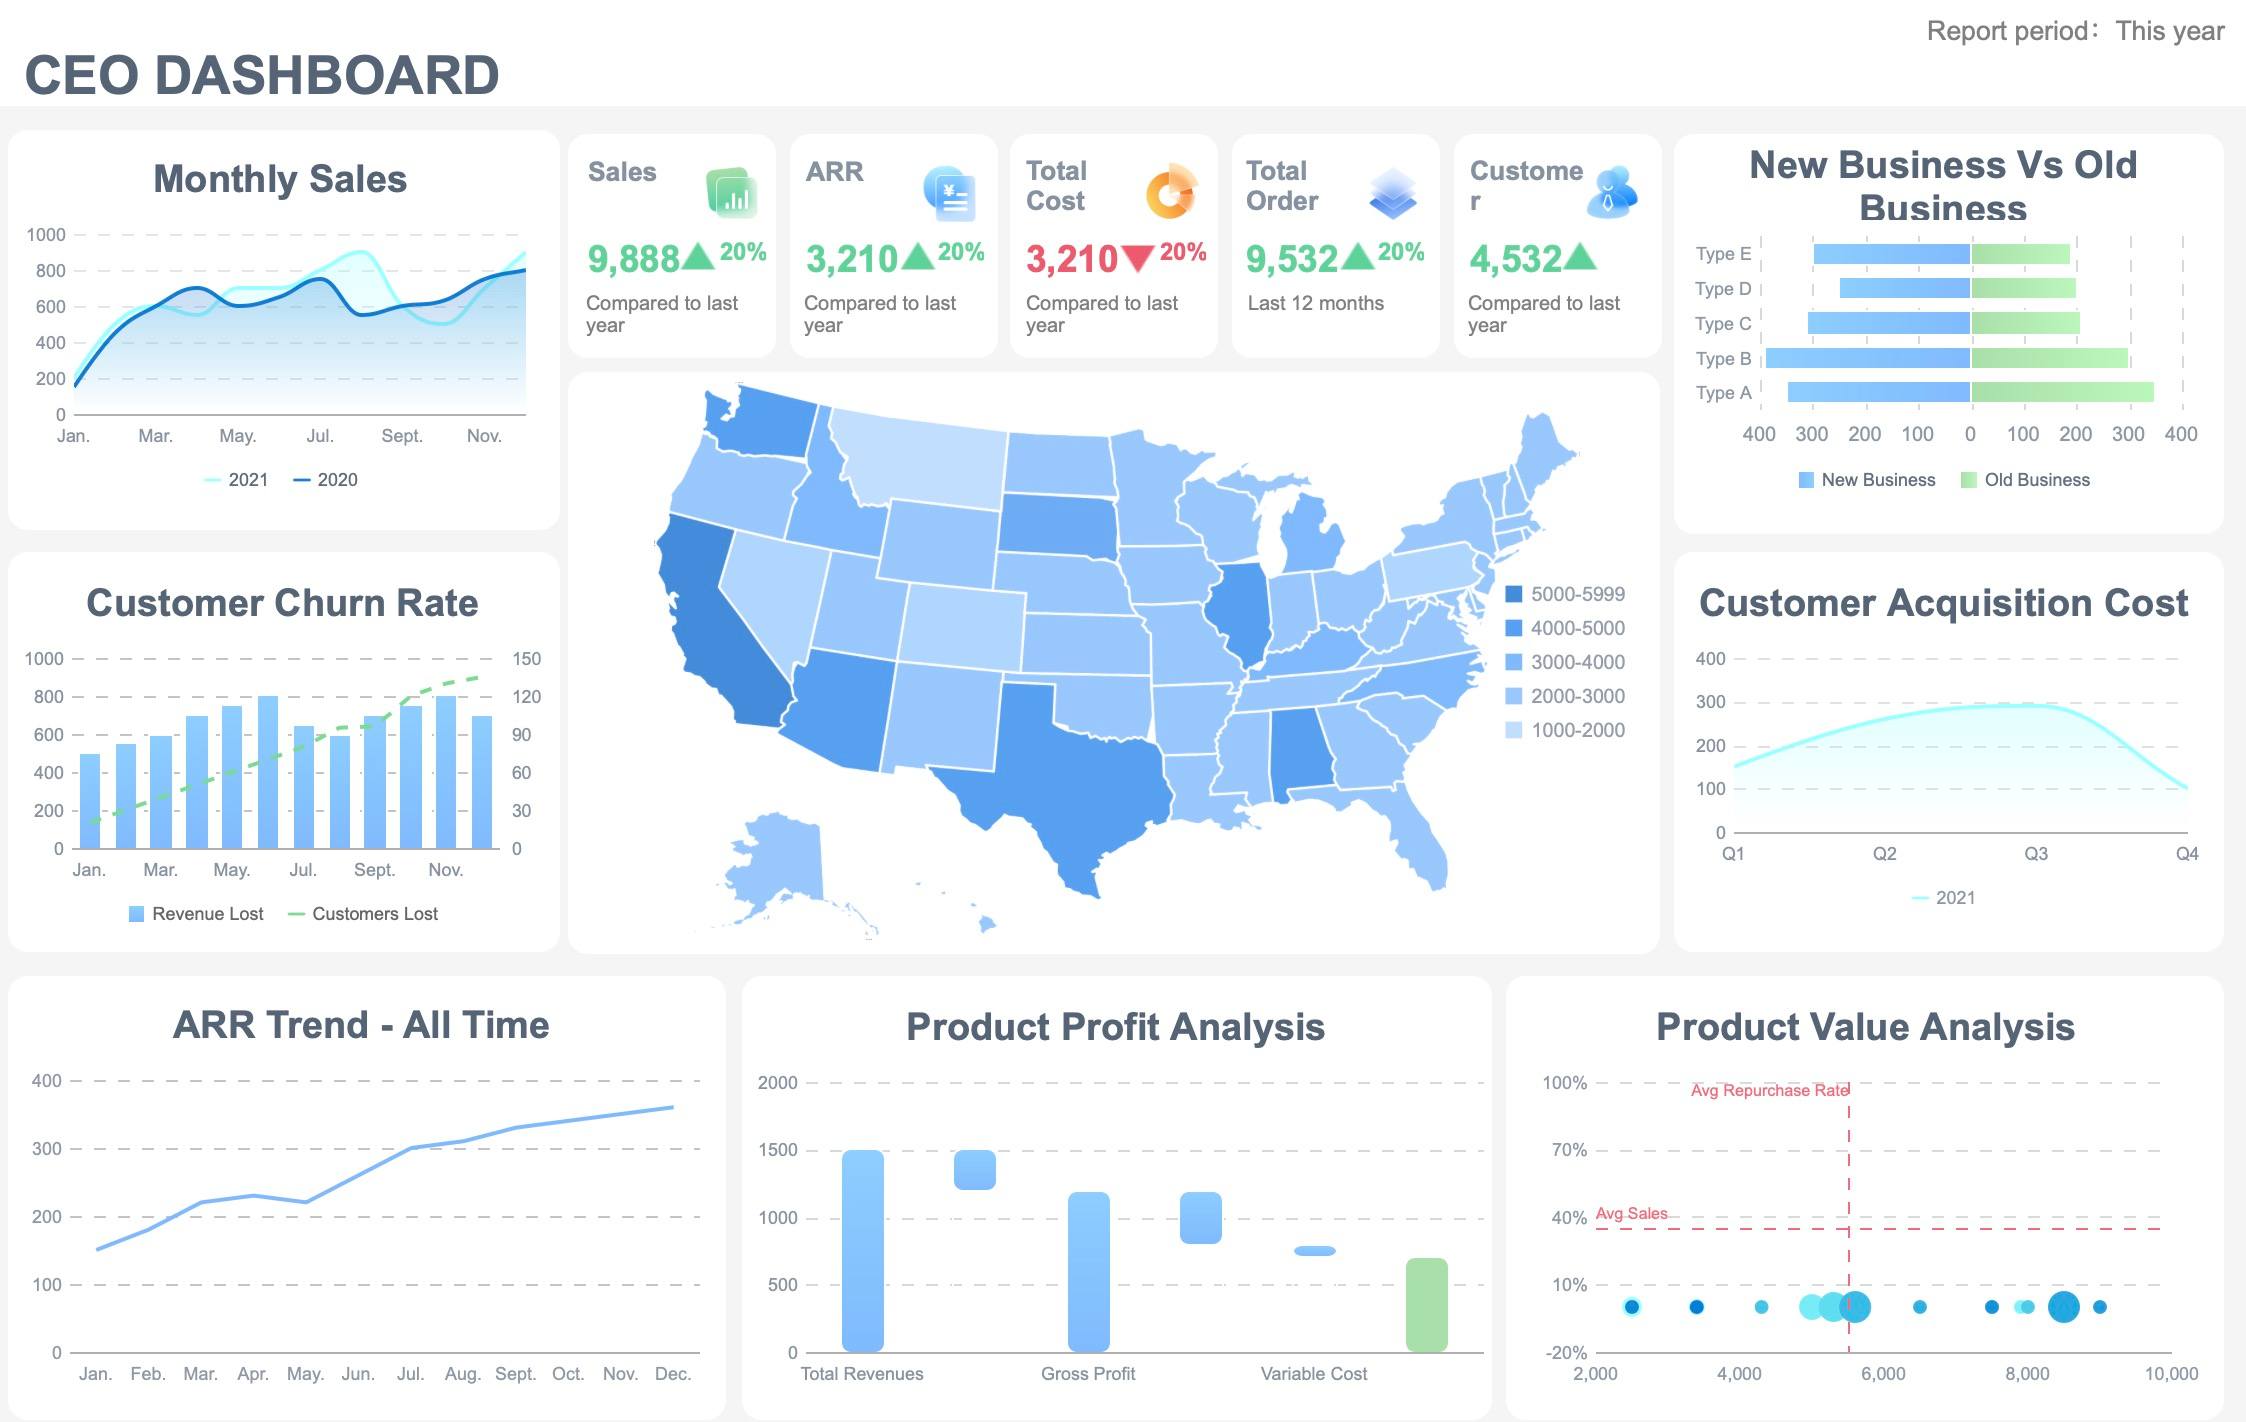
Dashboard
Lewis Chou
May 02, 2026
A backup dashboard is not just a reporting screen for completed jobs. It is an operational control panel that helps IT managers answer one critical question fast: If a key system fails today, can we recover it within business expectations?
That distinction matters. Many teams think backups are healthy because jobs are running. Then an outage exposes missed policies, broken agents, storage constraints, or restore failures that were hidden inside fragmented reports. For IT managers, infrastructure leaders, and disaster recovery owners, the real business value of a backup dashboard is simple: reduce recovery risk, shorten decision time during incidents, and make backup posture visible before failure becomes downtime.
A well-built dashboard gives one shared view across systems, workloads, and locations. Instead of checking separate backup consoles, storage tools, and inventory sheets, teams can spot backup health, policy drift, and recovery gaps in minutes. That improves daily monitoring, sharpens incident response, and supports audit and recovery planning with data that is actually actionable.
A useful backup dashboard should show three things immediately:
This is where many teams go wrong. They focus on backup activity metrics alone, such as job counts or throughput, without showing whether those jobs support business recovery targets. A completed backup job is helpful, but it does not prove that the workload is protected to the required recovery point objective or that a restore will finish inside the expected recovery time objective.
A stronger backup dashboard connects operational telemetry to business recovery outcomes. That means showing not only what ran, but also what failed, what is falling out of compliance, what has not been restore-tested, and which critical assets remain underprotected.
For fast decision-making, your backup dashboard should include these core elements:
Backup success rate is the percentage of completed jobs compared with scheduled jobs across systems, workloads, and time periods. It is the most basic signal in a backup dashboard, but it should never be viewed in isolation.
Track success rate by:
A single daily percentage can hide meaningful issues. For example, a 96% success rate may look acceptable overall, but that number becomes dangerous if the failed 4% includes production databases or executive file systems. The dashboard should let IT managers drill from the summary rate into failed systems and trends over time.
Trend analysis is especially important. One-off failures happen. What matters is whether success rates are steadily declining in a specific location, hypervisor cluster, SaaS connector, or endpoint group. A downward trend often points to infrastructure instability, policy changes, or capacity constraints before a broader backup incident occurs.
Backup failure rate tells you how often jobs fail, but the real operational value comes from understanding why they fail.
Group failed jobs by root-cause category, such as:
This helps teams prioritize fixes that remove recurring friction rather than chasing isolated symptoms. If 40% of recent failures come from expired credentials, that is a governance and automation problem. If failures cluster around storage thresholds, that is a capacity planning problem. If they spike during certain hours, it may point to network contention or overloaded backup infrastructure.
Your backup dashboard should surface both failure volume and error recurrence. IT managers need to know not just how many jobs failed today, but which error types are repeating across multiple systems and increasing operational risk.
A backup dashboard becomes genuinely valuable when it shows RPO coverage, not just backup activity. Recovery point objective defines the maximum acceptable amount of data loss for a workload. If a system must be recoverable to within 15 minutes, then daily backup completion is not enough.
Track whether each critical system is meeting its required backup frequency. This means comparing:
When workloads drift outside their acceptable RPO, the dashboard should flag them clearly. These are not cosmetic alerts. They are direct recovery-readiness failures that could lead to major business disruption during an incident.
The most effective backup dashboard views show RPO compliance by application, server, endpoint, database, or SaaS workload. This gives IT managers a way to align backup operations with business expectations instead of assuming all assets have the same risk profile.
If RPO tells you how much data you can afford to lose, RTO readiness tells you whether you can restore fast enough to meet operational demands.
This metric should show estimated restore times for:
Comparing estimated restore times against service targets is essential. A backup may be current, but if restoring a business-critical system takes 10 hours and the business expects recovery in 2 hours, then the environment is not recovery-ready.
A mature backup dashboard should incorporate factors that affect current restore performance, including:
This turns the dashboard from a passive report into a decision tool. During planning, teams can see where restore capability is weak. During an incident, responders can assess what can realistically be restored first and whether escalation is required.
One of the most important metrics in any backup dashboard is restore test success rate. This is the closest thing to proof that your backups are usable.
Many organizations report backup completion but do not regularly test recoverability. That creates false confidence. Backup files may exist, yet restores can still fail because of corruption, missing dependencies, bad credentials, application inconsistency, or incomplete procedures.
Track:
This metric is especially valuable for executive reporting because it answers a direct risk question: Are we validating recoverability or only assuming it?
A strong backup dashboard should distinguish between completed backups and verified restores. For recovery readiness, restore test success is far more meaningful than raw job volume.
Backup reliability is tightly linked to storage health. If repositories are near capacity, retention policies may not hold, jobs may fail, and long-term recovery options may shrink without warning.
Your backup dashboard should monitor:
Capacity data becomes more useful when paired with retention status. A repository may appear healthy today, but if growth trends continue, the business could face missed backups, shortened retention windows, or noncompliance in the next 30 to 90 days.
This is a classic area where backup dashboards move from reactive to preventive. Rather than discovering storage constraints after backup failures begin, IT managers can act on forecasted limits and policy pressure early.
The final metric ties backup operations directly to business impact: critical asset protection coverage.
This metric maps backup status to business-critical assets such as:
A backup dashboard should make it easy to identify assets that are:
This is where infrastructure telemetry meets asset inventory and business context. Without this mapping, a team may believe backup coverage is strong while overlooking a newly deployed database cluster, a remote office file server, or a SaaS tenant with no validated recovery plan.
For IT managers and operations leaders, this metric is often the most strategic one on the screen because it answers the board-level question behind every backup investment: Which critical business services remain exposed?
A backup dashboard should help teams decide and act, not just observe. The design must support both daily monitoring and high-pressure incident response.
Place the most important information at the top:
Below that, separate strategic metrics from operational troubleshooting detail. Executives and IT managers should see top-line risk immediately, while backup administrators should be able to drill into failed jobs, policy issues, and infrastructure causes without cluttering the main view.
A practical layout often works like this:
Filters should reflect how teams investigate problems in the real world. Useful dimensions include:
During an incident, responders need to isolate high-risk systems quickly. During an audit, managers may need to show retention or restore readiness by department. During weekly review, backup admins may want to focus only on one environment or one protection policy.
A backup dashboard that cannot be filtered in ways the team actually works will create friction instead of insight.
The best backup dashboard designs make deterioration visible before teams are overwhelmed by failures.
Use:
Keep the visuals clean. A dashboard overloaded with gauges, redundant charts, and low-value metrics slows down decision-making. Focus on views that help answer three practical questions:
Building a reliable backup dashboard depends on the quality and consistency of the data behind it. Most organizations need to combine multiple sources to get a complete recovery-readiness picture.
Start with your backup tools. Native reports and APIs typically provide:
The challenge is standardization. Different products label and structure data differently. If your organization uses more than one backup solution, normalize fields such as job state, workload type, timestamp, policy name, and error code before combining them into one backup dashboard.
Backup issues often originate outside the backup application itself. To explain performance problems and risk accurately, combine backup data with telemetry from:
This gives context to backup failures and validates protection coverage. For example, if backups are failing on a set of servers, correlated storage latency or network congestion data may explain why. If critical asset coverage looks incomplete, inventory data may reveal newly onboarded systems that were never added to policy.
When mapping fields and configuring data pipelines, use official product guides, support resources, and onboarding materials. This is especially important when pulling data from backup APIs, interpreting error states, or aligning policy objects with dashboard logic.
Many dashboard projects fail because teams rely on assumptions about field meanings or status codes. Before publishing KPIs to stakeholders, validate data definitions with backup administrators and review product documentation to confirm what each metric actually represents.
A backup dashboard can create clarity or confusion depending on what it emphasizes. The goal is not more reporting. The goal is better recovery decisions.
Avoid these common failures:
If the dashboard cannot tell you which critical systems are at risk and why, it is not doing its job.
A practical implementation approach looks like this:
This staged rollout reduces noise and helps the team build confidence in the backup dashboard before it becomes a high-visibility management tool.
The methodology is clear: define recovery-focused KPIs, connect backup data with infrastructure and asset context, design for fast filtering and escalation, and validate everything against real recovery expectations.
But building this manually is complex. Data lives across backup platforms, storage systems, endpoints, inventory databases, and operational tools. Standardizing fields, maintaining calculations, and designing a dashboard that works for both executives and operators takes ongoing effort.
That is where FineBI becomes the practical solution.
With FineBI, teams can use ready-made templates and automate this entire workflow. Instead of stitching together manual reports and fragile spreadsheets, IT managers can centralize backup metrics, unify data from multiple systems, and build a backup dashboard that highlights recovery readiness in one view.

FineBI helps enterprise teams:
If your current reporting only proves that jobs ran, it is time to move to a backup dashboard that proves you can recover. FineBI makes that shift faster, cleaner, and far easier to operationalize at enterprise scale.
A backup dashboard gives IT teams one place to monitor backup health, recovery risk, and compliance with recovery goals. Its main purpose is to show whether critical systems can actually be restored when needed, not just whether backup jobs ran.
The most useful metrics are backup success rate, backup failure rate, error patterns, RPO coverage, RTO readiness, restore test success rate, storage capacity, and critical asset protection coverage. Together, these show both operational performance and recovery readiness.
A high success rate can still hide serious risks if important systems are excluded, backups miss RPO targets, or restores fail. Recovery readiness depends on whether protected assets can be restored within business expectations.
Most teams should review key backup health indicators daily and watch trends over time. Critical environments may need near real-time monitoring so issues are caught before they affect recovery.
It speeds up decision-making by showing failed jobs, protection gaps, restore readiness, and storage risks in a single view. That helps IT managers identify what is recoverable faster and focus response efforts where the business impact is highest.

The Author
Lewis Chou
Senior Data Analyst at FanRuan
Related Articles
Executive Summary Dashboard for Enterprise Leaders: 9 Steps to Design KPIs, Layout, and Governance
Learn 9 steps to design an executive summary dashboard for enterprise leaders. Define KPIs, layout, and governance for better strategic decision-making.
Lewis Chou
May 04, 2026

Executive Dashboard Template: What Enterprise Leaders Should Include Before They Build
Learn what to include in an executive dashboard template for better decision-making. Focus on KPIs, risk signals, and strategic alignment for leadership teams.
Lewis Chou
May 04, 2026

How to Build a Teams Call Queue Dashboard: Turn Raw Queue Data Into Actionable Insights
Learn how to transform raw Teams call queue data into a dashboard for real-time monitoring, trend analysis, and proactive service level management.
Lewis Chou
May 04, 2026


