Dashboard
Lewis Chou
Apr 28, 2026
If you run delivery operations, delays rarely start with the customer complaint. They start earlier: orders waiting too long to be accepted, drivers not assigned fast enough, pickup timing drifting, or deliveries sitting in a stalled status with no one intervening. A well-used chowbus dashboard helps store managers, dispatch leads, and operations teams catch those problems while service is still recoverable.
The business value is simple: real-time visibility reduces missed handoffs, improves on-time performance, and gives teams a faster path from issue detection to action. Instead of reacting after service fails, managers can monitor the live flow of orders, preparation, dispatch, and delivery in one operational view.
All dashboards in this article were generated by FineBI.
A chowbus dashboard typically brings together the live signals that matter most in delivery operations:
This single view is especially valuable for:
What can you realistically monitor and improve from the dashboard? In most delivery environments, teams use it to answer five critical questions fast:
For enterprise operations teams, these are the core metrics a dashboard should surface clearly:
These metrics turn a dashboard from a passive reporting screen into an active control center.
The first operational use case of a chowbus dashboard is simple but essential: monitor demand as it arrives. If teams do not see changes in order flow quickly, every downstream function gets harder.
Real-time order tracking allows managers to see how many orders are:
This matters because order flow is rarely steady. A lunch spike, weather event, local promotion, or staffing shortage can change throughput in minutes. By watching these status changes live, teams can identify whether the kitchen or dispatch queue is starting to fall behind.
Operational warning signs include:
When managers catch these patterns early, they can rebalance labor, adjust prep sequencing, or escalate dispatch support before service deteriorates.
Live order updates are only useful if they drive action. In practice, staff should use the dashboard to prioritize urgent cases first:
This kind of visibility supports smoother handoffs between teams. Kitchen staff know what needs to move first. Dispatch sees which orders are about to become time sensitive. Managers can intervene before multiple small delays compound into missed delivery promises.
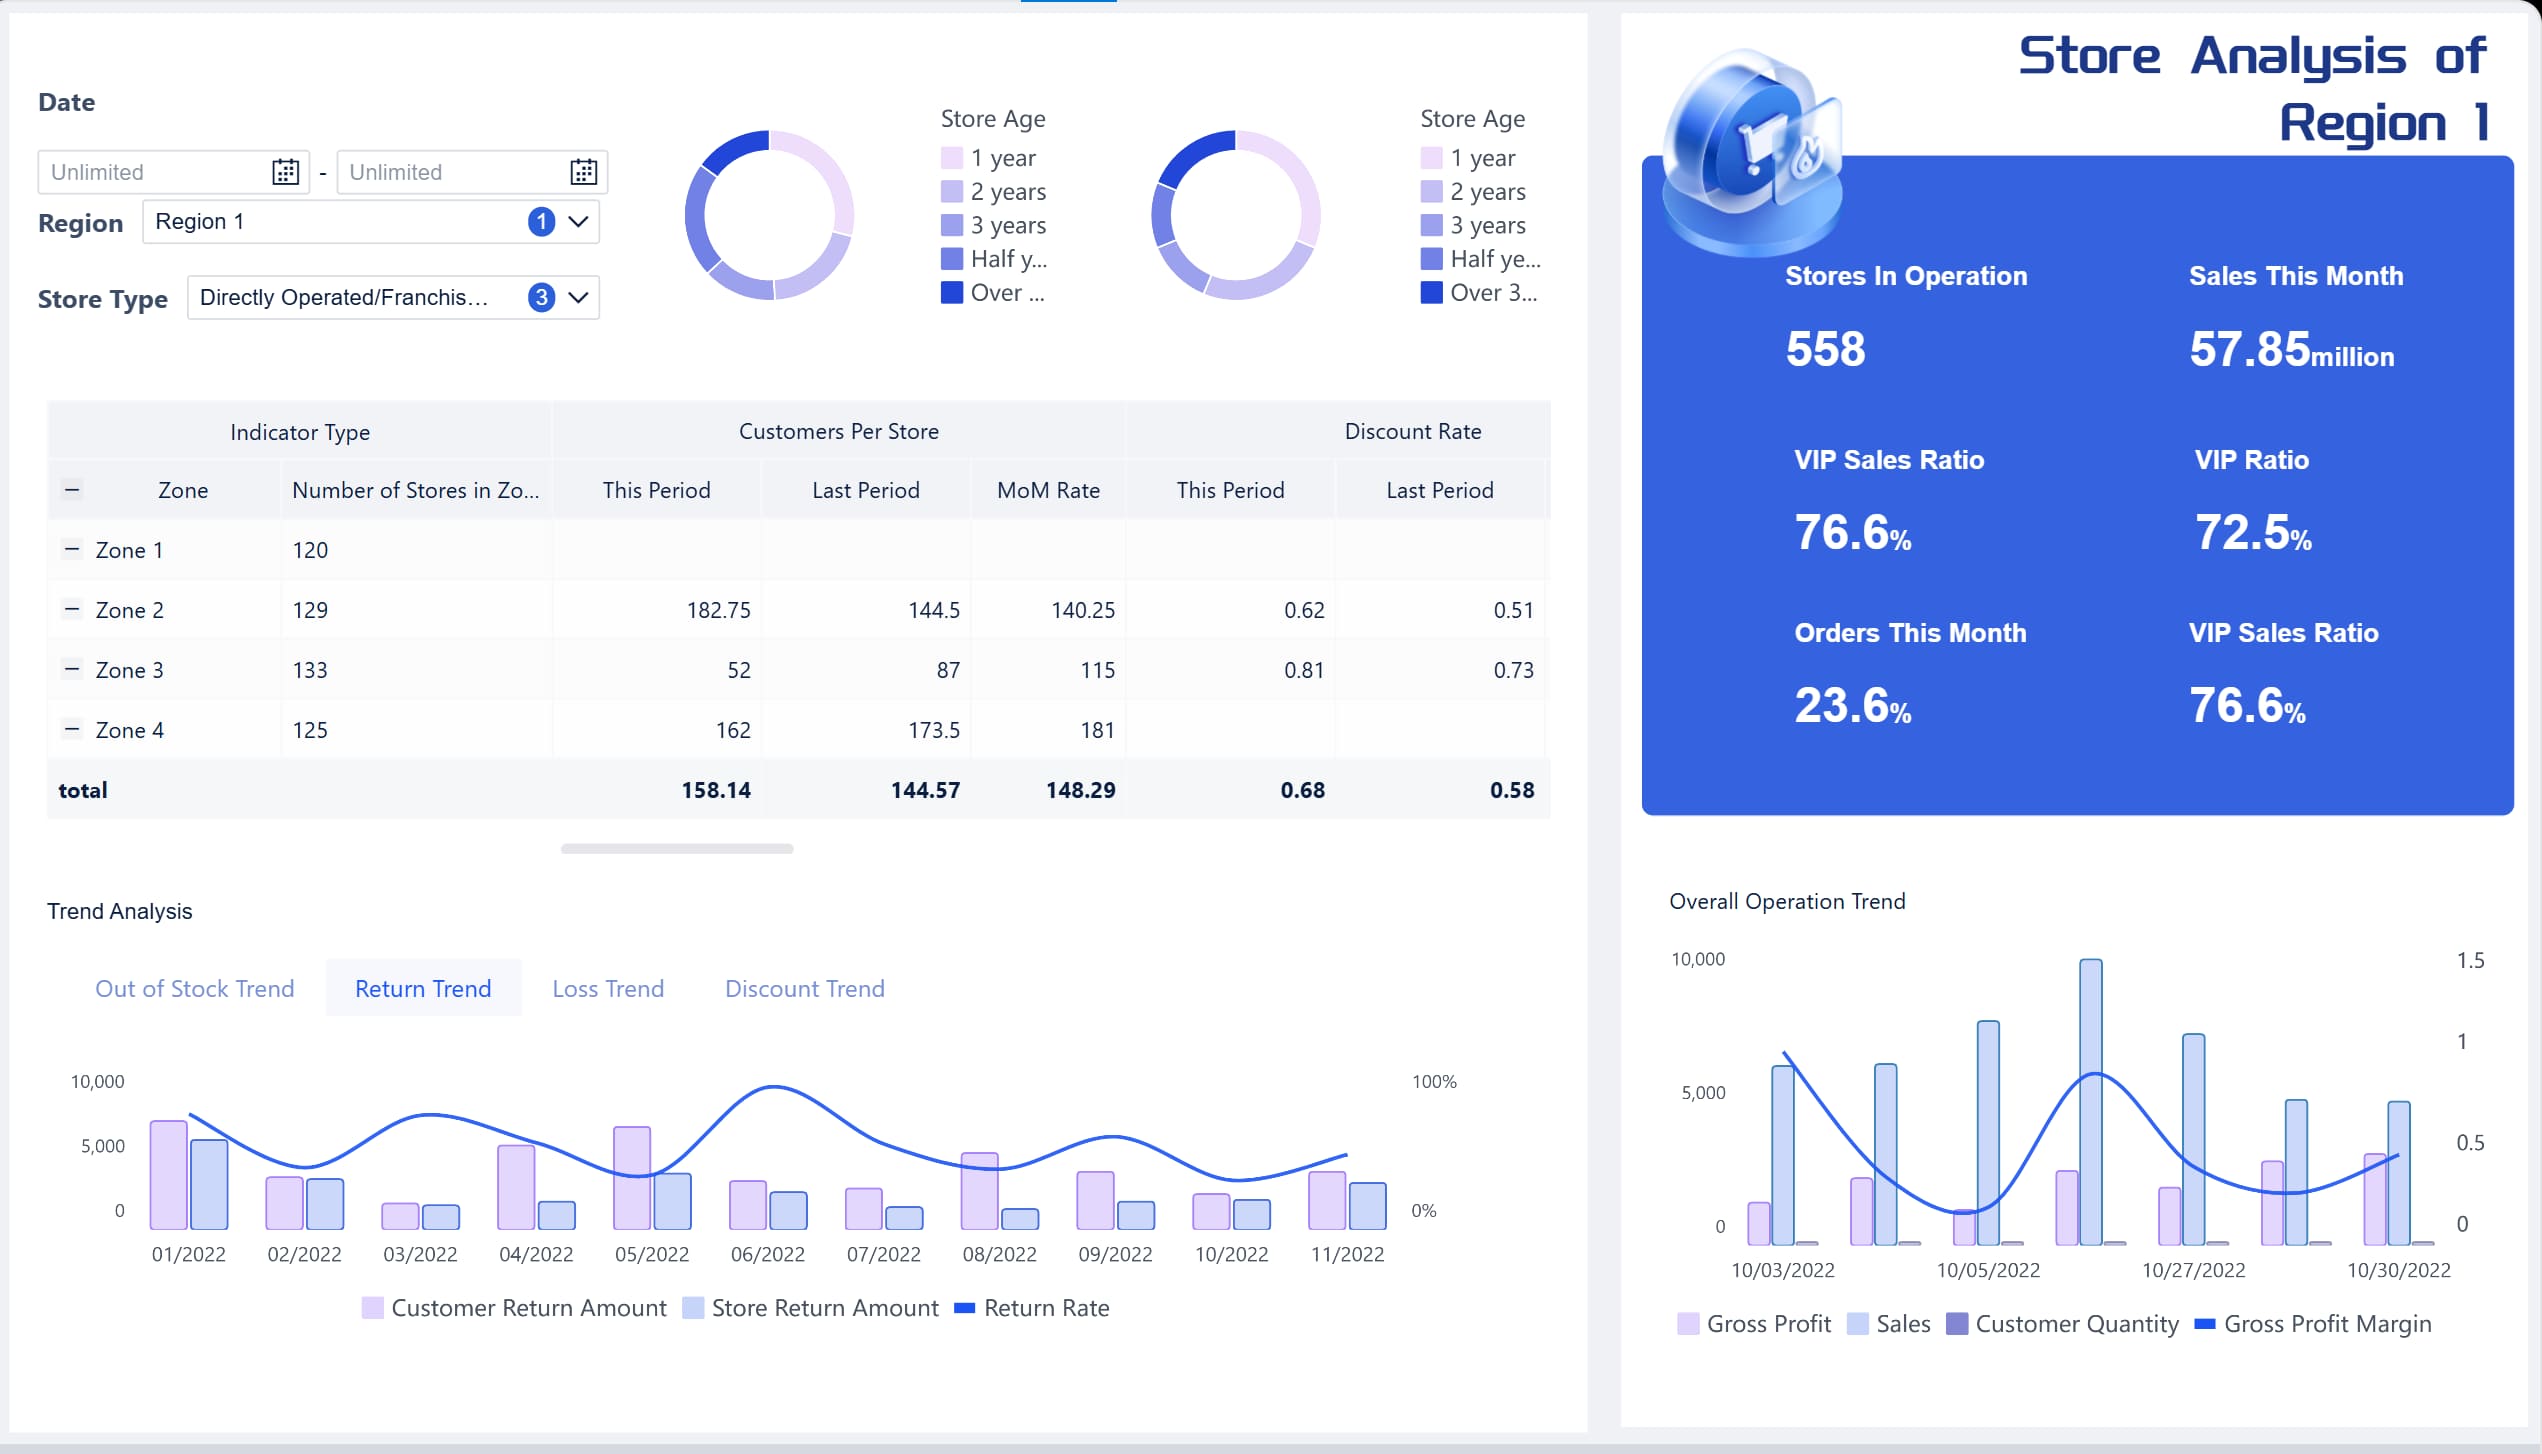
Many delivery failures are not caused by food preparation. They happen because a completed order sits idle, waiting for a driver. That is why driver assignment is one of the most important views in any chowbus dashboard.
A dashboard should make it easy to identify orders that are:
These unassigned deliveries are an early warning sign, especially during peak hours. If the queue of driver-less orders starts growing, customer impact usually follows. That may indicate:
From an operations standpoint, the goal is not just to fill assignments eventually. It is to keep assignment time within a tight target so the downstream delivery window still holds.
Once a driver is assigned, the dashboard should help teams follow the order through pickup, in transit, and completion. Live status changes let managers judge whether deliveries remain on schedule.
Useful checks include:
If service times begin to slip, checking driver activity helps teams determine where the delay is happening:
That distinction matters. Without it, teams may blame the wrong function and fail to fix the real bottleneck.
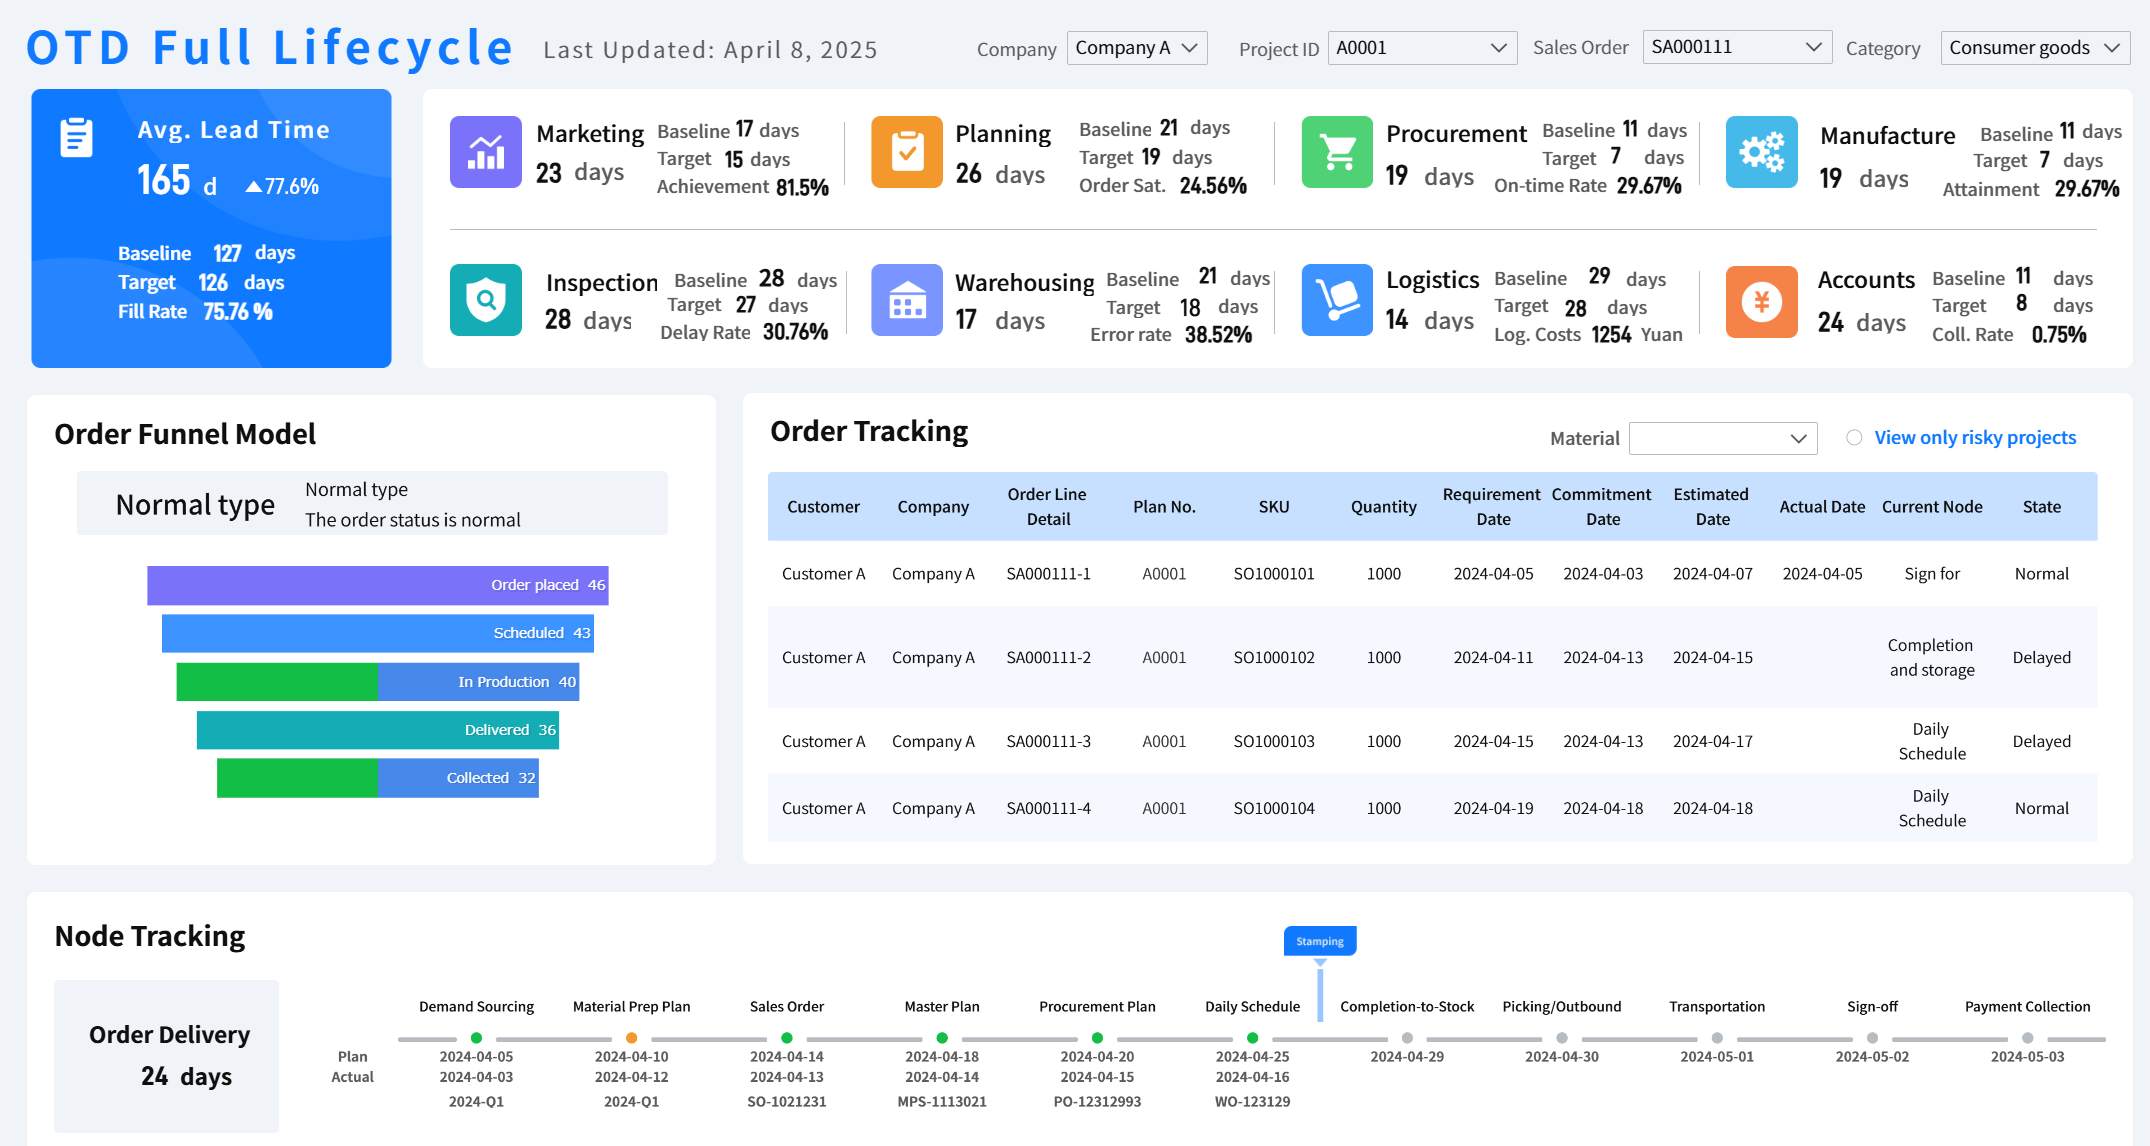
Delivery operations break down when kitchen timing and driver timing are out of sync. A strong chowbus dashboard helps teams compare these two moving parts in real time.
The ideal flow is straightforward: food becomes ready close to the moment the driver arrives. In reality, mismatches happen constantly:
These timing mismatches create avoidable delays, quality issues, and customer dissatisfaction. Hot food gets cold. Drivers waste time waiting. Pickup queues become harder to manage.
Teams can use readiness and dispatch signals to improve coordination by:
This is one of the highest-value operational uses of the dashboard because it addresses the handoff point where many delays begin.
Pickup timing trends reveal whether the operation is flowing cleanly or starting to congest. If too many ready orders sit waiting for pickup, that pileup usually points to a deeper issue.
Common causes include:
Repeated pickup delays should trigger immediate intervention. Managers may need to:
The dashboard gives teams the timing evidence to make these decisions with confidence instead of relying on instinct.
The biggest advantage of real-time monitoring is not visibility for its own sake. It is the ability to recover service while the order is still active. That makes exception monitoring a critical function of the chowbus dashboard.
Operations teams should regularly scan for deliveries that show signs of elevated customer risk, including:
These patterns often suggest a higher chance of customer complaints, refund requests, or negative reviews. Not all exceptions are equally urgent, so teams should triage based on likely impact:
This triage model helps managers focus their effort where recovery still matters most.
A strong dashboard should help teams investigate exceptions quickly, not just display them. When alerts or unusual status changes appear, managers should look for:
The key is speed. If teams wait until the order is completed to investigate, the only option left is post-service damage control. Acting while the order is still in progress creates options:
That is what separates a dashboard used for monitoring from one used for operational control.
Real-time monitoring is most effective when combined with trend awareness. A chowbus dashboard should not only show what is happening now, but also help teams understand when and why service patterns change during the day.
Hourly patterns matter because delivery operations are highly time-sensitive. Lunch and dinner rushes often expose issues that remain hidden during quieter periods.
By comparing peak hours with slower windows, managers can identify:
This insight supports better staffing and dispatch decisions. Instead of planning around assumptions, teams can build schedules around real throughput behavior.
For example, if the dashboard consistently shows assignment delays beginning 30 minutes before the dinner rush, managers can add dispatch attention earlier rather than reacting once backlogs already exist.
On-time delivery is the headline metric, but it should be read alongside consistency indicators. A location with acceptable daily averages may still have serious process issues if performance collapses at predictable times.
Daily review should look for:
Recurring delays usually point to structural problems, not isolated bad luck. Examples include:
This kind of review turns dashboard monitoring into continuous improvement rather than short-term firefighting.
The strongest operators do not just watch the dashboard. They build a repeatable routine around it. That is how the chowbus dashboard becomes a decision tool instead of background noise.
Across this guide, we covered seven practical monitoring methods:
If you want consistent results, use a structured review cadence during service:
This routine helps teams improve three outcomes that matter most:
For a single store, basic dashboard monitoring may be manageable. For multi-location brands, growing delivery programs, or enterprise operations teams, building this manually is complex. You need consistent definitions, automated refreshes, role-based views, and the ability to compare real-time activity with historical trends at scale.
That is where FineBI becomes the practical solution.
With FineBI, teams can utilize ready-made templates and automate this entire workflow. Instead of stitching together multiple reports, managers can create a centralized operational dashboard that brings together order status, prep timing, dispatch performance, pickup delays, and exception tracking in one place.

FineBI helps enterprise teams:
The strategic benefit is clear: your teams spend less time collecting data and more time acting on it.
If your goal is to turn a chowbus dashboard from a passive screen into an active control system, FineBI is the enabler. Building this manually is complex; use FineBI to utilize ready-made templates and automate this entire workflow. That gives operations leaders a scalable way to improve delivery speed, service consistency, and customer satisfaction across the business.
A Chowbus dashboard helps teams track live order volume, preparation progress, driver assignment, pickup timing, delivery status, and exception orders. It gives managers one place to spot delays before they turn into customer complaints.
The most useful metrics usually include order acceptance time, preparation time, driver assignment rate, pickup wait time, transit time, on-time delivery rate, and exception rate. Together, these KPIs show where operational bottlenecks are forming.
It helps teams identify stalled orders, unassigned deliveries, and slow handoffs early enough to act. Faster intervention improves dispatch timing and reduces avoidable late deliveries.
Orders that are ready but still waiting for a driver can quickly become late even if kitchen prep was on schedule. Monitoring assignment status helps dispatch teams catch capacity issues before delays spread across the queue.
Store managers, dispatch coordinators, operations teams, and regional leaders all benefit from it. Each group can use the same real-time view to manage workflow, staffing pressure, and service consistency.

The Author
Lewis Chou
Senior Data Analyst at FanRuan
Related Articles
Executive Summary Dashboard for Enterprise Leaders: 9 Steps to Design KPIs, Layout, and Governance
Learn 9 steps to design an executive summary dashboard for enterprise leaders. Define KPIs, layout, and governance for better strategic decision-making.
Lewis Chou
May 04, 2026

Executive Dashboard Template: What Enterprise Leaders Should Include Before They Build
Learn what to include in an executive dashboard template for better decision-making. Focus on KPIs, risk signals, and strategic alignment for leadership teams.
Lewis Chou
May 04, 2026

How to Build a Teams Call Queue Dashboard: Turn Raw Queue Data Into Actionable Insights
Learn how to transform raw Teams call queue data into a dashboard for real-time monitoring, trend analysis, and proactive service level management.
Lewis Chou
May 04, 2026


