Mastering the principles of data visualization is essential for conveying data effectively. By transforming complex datasets into visually engaging formats, you can significantly improve the comprehension and retention of information. Research suggests visualization can increase understanding by as much as 400%, enabling faster and more accurate identification of trends and discrepancies. Tools such as FineReport, FineBI, and FineVis are instrumental in achieving this. FineReport facilitates dynamic reporting, FineBI allows for intuitive self-service analytics, and FineVis offers over 60 chart types tailored for immersive large-screen visual storytelling. These tools are designed to help you deliver powerful and efficient presentations, ensuring that your insights make a maximum impact.
Understanding Your Audience of Data Visualization Principles
To create effective data visualizations, you must first know your audience. Understanding who will view your visualizations helps you tailor your approach to meet their needs and expectations.
Identifying Audience Needs of Data Visualization Principles
Assessing the audience's level of expertise
To effectively address your audience, it is crucial to evaluate their level of expertise before delivering content. Begin by distinguishing whether your audience consists of data-savvy professionals or individuals with limited experience in data interpretation. This assessment will guide the depth of detail to include in your presentation. For a technical audience, employ complex data visualizations that can be handled by tools like FineReport, Fine BI or FineVis, the latter being particularly adept at large-screen visualizations that could engage and inform at higher levels of complexity. In contrast, a general audience might benefit more from simpler visuals that distill information into more digestible parts. This approach not only tailors the presentation to the audience’s capacity but also enhances their engagement and understanding.
Determining the audience's goals and interests
To effectively engage your audience with your data visualizations, start by defining their goals and interests. For instance, if your audience consists primarily of business professionals, they are likely seeking insights that can drive strategic decisions or reveal emerging trends. It's crucial to align your visualizations, whether they're created using FineReport, Fine BI or specialized in large-screen visualization like FineVis, with these objectives.
Utilize survey data to understand your audience's preferences better and tailor your presentations accordingly. By doing this, you ensure that your visualizations not only capture attention but also deliver value by addressing specific business needs or interests. This approach will make your data more impactful and your presentations more effective in achieving the desired outcomes.
Tailoring Visualizations to Audience
Choosing appropriate complexity
To tailor the complexity of your visualizations, begin by understanding your audience's familiarity with data. For seasoned professionals, opt for intricate visualizations such as multi-layered graphs and advanced dashboards. Platforms like FineReport, Fine BI and FineVis excel in creating sophisticated large-screen visualizations that cater to experienced users. Conversely, for audiences less versed in data analysis, employ simpler, more intuitive charts such as bar graphs and pie charts. This strategic approach not only enhances comprehension but ensures that the visualization effectively communicates the intended insights, making the data accessible and engaging for every viewer.
Selecting relevant data points
To effectively engage and inform your audience with data visualization, focus on selecting data points that are most relevant and impactful. Begin by understanding your audience’s goals and interests to tailor the visualizations specifically to their needs. This alignment not only enhances the effectiveness of your visuals but also maintains audience engagement by presenting valuable insights that resonate with them.
Adhere to key principles of data visualization to ensure your visuals are clear and informative. Use simple designs and appropriate chart types to convey your message. For instance, bar charts are excellent for comparing quantitative data across categories, while line charts are ideal for illustrating trends over time. Utilize color wisely to highlight critical data, ensuring it draws attention without overwhelming the viewer. Additionally, avoid clutter and focus on presenting a clean, organized visual that allows for easy interpretation and meaningful insights.
"Effective data visualization begins with solid design principles, which include selecting the appropriate visual representation for the data."
Tools like FineReport, Fine BI and FineVis can be instrumental, especially FineVis for large screen visualizations, ensuring your data not only informs but also captivates your audience. These tools can help in creating interactive and engaging visuals that allow for deeper exploration and understanding, making your data visualization not just a presentation, but an experience.

Defining the Data Visualization Principles
To create effective data visualizations, you must first define your message. This step is crucial because it determines what you want your audience to learn or understand from the data. A clear message helps you avoid clutter and focus on the most important insights.
Clarifying the Purpose of Data Visualization Principles
Establishing the main message or insight
When establishing the primary insight of your data visualization, it is crucial to focus on clarity and relevance. Define the key message you intend to communicate, which lays the groundwork for a compelling visual presentation. This ensures that the visualization remains concise and targeted, avoiding the common pitfall of overloading it with extraneous data. Selectivity in data points enhances comprehension and impact, making the insights more accessible and actionable for your audience.
Incorporating tools like FineVis for large-screen visualizations can significantly enrich the visual experience, particularly in a professional or business intelligence context where clear and impactful data presentation is paramount.
Aligning visualization with communication goals
To effectively align your data visualization with your communication goals, it is crucial to select appropriate visualization tools and techniques that cater to the nature of your data and the preferences of your target audience. Whether you are aiming to inform, persuade, or entertain, the choice of visualization, such as BI tools or more specialized options like FineVis for large-screen visualizations, can significantly influence the clarity and impact of your presentation.
Begin by defining clear objectives for what you want your visualization to achieve and understanding the data you are working with, including its complexity and the type of information it represents. This will guide the selection of a suitable visualization tool that enhances the data's communicability and interactivity, catering to user engagement and the ease of extracting insights.
Moreover, it is important to ensure that the visualization not only presents data effectively but also resonates with your audience, providing them with intuitive and engaging visual representations that facilitate a deeper understanding of the content. This alignment not only helps in achieving your communication objectives but also in making the data memorable and impactful.
"Prioritize clarity and simplicity when creating a visualization to ensure accurate presentation of data."
Structuring the Narrative of Data Visualization Principles
Organizing data to support the message
To optimize the effectiveness of your data organization for clear communication, it's essential to start by clearly defining the key message you want to convey. Once this is established, structure your data to support this message, using visual tools and narratives to guide your audience through the insights in a logical manner. This approach not only enhances clarity and prevents misinterpretations but also significantly improves audience engagement by providing a coherent narrative flow.
Incorporating visualization tools such as FineReport and Fine BI, or FineVis, particularly for large screen displays, can be particularly effective in making complex data more accessible and engaging. FineVis excels in large-screen visualizations, which can help in presenting complex data in a visually intuitive manner, making it easier for the audience to grasp and follow the insights presented.
The structuring of your data should aim at maintaining a clear and logical flow, which enhances the viewer’s understanding and interaction with the information presented. This methodical organization aligns with best practices in data storytelling, where the narrative and visualizations play pivotal roles in conveying the story behind your data effectively.
Using storytelling techniques
To enhance your data visualization using storytelling techniques, it's essential to focus on creating a clear and compelling narrative that makes your information more engaging and memorable. Start by identifying a central theme or message you want to communicate. Structure your data story around this core idea, employing a narrative arc with a beginning, middle, and end to maintain audience interest.
Integrate visual storytelling elements such as progression, contrast, and emphasis to highlight key insights and guide the audience through the narrative effectively. This approach not only aids in communicating the data more effectively but also ensures it resonates on an emotional level, making it easier for your audience to connect with and remember the information.
For tools, consider using powerful data visualization platforms like FineReport, Fine BI or FineVis, especially if your focus is on large-screen visualizations, which can be particularly impactful for presenting complex data in an accessible way. By carefully selecting and employing the right visualization tools and techniques, you can transform raw data into a clear, engaging, and actionable story that leaves a lasting impression on your audience.
These techniques are underpinned by the need to understand your audience deeply, simplifying complex data into digestible visuals that fit the context of your narrative, thus enhancing the overall impact of your data storytelling.
Choosing the Right Data Visualization Principles
Selecting the appropriate type of data visualization is crucial for conveying your message effectively. Different visualization types serve distinct purposes, and understanding these differences can help you create impactful visualizations that resonate with your audience.
Understanding Different Visualization Types
Bar charts, line graphs, and pie charts
Bar charts, line graphs, and pie charts are among the most common types of data visualizations. Each serves a unique purpose:
- Bar charts: Ideal for comparing different groups or categories. They effectively highlight differences and trends across discrete data sets. Use bar charts when you need to compare quantities or show historical highs and lows.
- Line graphs: Best for displaying trends over time. They allow you to track changes and patterns in continuous data. Line graphs are particularly useful when you want to illustrate how data evolves over a period.
- Pie charts: Suitable for showing simple proportions. They work best when you have 2-3 items to compare. Pie charts add detail to other visualizations but should be used sparingly to avoid clutter.
Heatmaps, scatter plots, and infographics
Beyond the basics, more complex visualizations like heatmaps, scatter plots, and infographics offer additional insights:
- Heatmaps: Useful for visualizing data density and patterns. They provide a quick overview of areas with high or low values, making them ideal for large datasets.
- Scatter plots: Perfect for showing correlations between variables. They help identify relationships and trends within data, making them valuable for exploratory data analysis.
- Infographics: Combine various visualization types to tell a comprehensive story. They are effective for presenting complex information in an engaging and easily digestible format.
Matching Data Visualization Principles to Data
Considering data type and relationships
When selecting a visualization type for your data, consider both the nature of your data and the relationships you aim to showcase. If your data is categorical, bar charts are often most effective. They provide a clear comparison of different categories. For time-series data, which tracks changes over time, line graphs are preferable because they illustrate trends and developments smoothly.
Tools like FineReport, Fine BI and FineVis can enhance these visualizations, especially for large-screen displays where detail and clarity are paramount. Understanding your data type not only helps in choosing the most suitable visual representation but also in effectively communicating the underlying patterns and relationships to your audience.
Evaluating the effectiveness of each type
To enhance the effectiveness of your data visualizations, it's crucial to focus on clarity, simplicity, and audience engagement. An optimal visualization communicates insights clearly and encourages viewers to explore deeper patterns. Utilize colors, shapes, and layouts strategically to amplify the impact of your visualizations. For example, selecting the appropriate chart types—like bar charts for comparisons or line charts for trends—can significantly affect how your message is perceived.
Tools like FineBI and FineVis offer capabilities to build impactful visualizations, making them suitable for presenting complex data in an understandable manner. When choosing a visualization type, consider what you need to analyze—such as trends, correlations, or distributions—and match the visualization technique accordingly. This tailored approach not only adheres to core data visualization principles but also ensures that your visuals are engaging and informative.
"Effective data visualization begins with solid design principles, which include selecting the appropriate visual representation for the data."

In summary, the key to effective data visualization lies in matching the right visualization type with the message you want to convey, using design best practices to ensure clarity and impact, and choosing the right tools to execute your vision efficiently.
Applying Design Data Visualization Principles
To create effective data visualizations, you must apply design principles that enhance clarity and visual appeal. These principles help you communicate insights effectively and engage your audience.
Ensuring Clarity and Simplicity
Avoiding clutter and unnecessary elements
In crafting data visualizations, it's crucial to prioritize simplicity and effectiveness. Tools like FineReport, Fine BI and FineVis, which excel in large-screen visualizations, support this by enabling the creation of clear, impactful displays. To enhance clarity and focus, minimize clutter by eliminating unnecessary elements that don't contribute directly to the main message. This approach helps in avoiding distractions that can obscure crucial insights, making it easier for the audience to understand and engage with the information. Emphasizing essential data points while maintaining a clean layout not only refines the visual appeal but also reinforces the communication of key insights, ensuring that your visualizations are both functional and visually appealing.
Using whitespace effectively
Whitespace, or negative space, is a key component in effective data visualization, playing a dual role in both enhancing aesthetics and improving readability. It provides necessary breathing room between visual elements, which helps in reducing cognitive load and focusing attention on the most important data points. Strategic use of whitespace can significantly elevate the clarity of visual displays by establishing a clean, organized layout that guides the viewer's eye through the data insights effortlessly.
This technique not only prevents visual clutter but also facilitates a better understanding of complex information. For applications like FineVis, which specializes in large-screen visualizations, the thoughtful integration of whitespace is especially critical in maintaining an engaging and coherent presentation across expansive displays.
"Simplifying visuals by removing unnecessary elements and focusing on critical data points helps maintain clarity and prevents overwhelming the audience."
Enhancing Visual Appeal by Data Visualization Principles
Choosing color schemes and fonts
The effectiveness of data visualizations is significantly influenced by the choice of color schemes and fonts. When selecting colors, it's essential to adopt a palette that not only aligns with your message but also enhances the overall readability of your data. Employ contrasting colors to accentuate crucial data points and create visual hierarchy.
For text, choosing clear, legible fonts complements your visualization's aesthetic and aids in communication. These decisions are pivotal in crafting visually appealing and coherent presentations. When using tools like FineReport, Fine BI or FineVis for large-screen visualizations, ensure these elements are optimized for clarity and impact.
Balancing aesthetics with functionality
While aesthetics enhance data visualizations, they must not overshadow functionality. Striking a balance between visual appeal and the clarity of data representation is crucial. Effective visualizations seamlessly integrate appealing design with the communication of insights, ensuring that the key message is both accessible and engaging. Employing established design principles allows for the creation of visuals that are not only aesthetically pleasing but also serve as valuable tools for the audience.
"Including art and design principles in data visualization efforts improves visual appeal and effectiveness in conveying complex information."
Tools like FineReport, Fine BI and FineVis, especially renowned for large-screen visualizations, exemplify this balance by enabling the creation of impactful and informative visual displays. This approach guarantees that your visualizations are both compelling and informative, making them essential resources for decision-making and insight generation.
Testing and Refining Data Visualization Principles
Creating effective data visualizations requires a process of continuous improvement. You must test and refine your designs to ensure they communicate insights clearly and effectively. This section will guide you through gathering feedback and iterating on your design.
Gathering Feedback
Conducting user testing sessions
User testing sessions are crucial in understanding how diverse audiences interact with your data visualizations, such as those created using FineReport, Fine BI and FineVis, particularly for large-screen displays. By inviting a representative group of users to engage with visualizations, you can observe their interactions and identify any challenges they face. This direct feedback is invaluable for pinpointing areas that need refinement, ensuring that the visualizations effectively communicate the intended data insights.
As noted by a seasoned Data Visualization Expert, "Grasping how users perceive and interact with data is essential for crafting visualizations that truly make an impact." This approach not only enhances user experience but also drives the effectiveness of your visual presentations.
Analyzing feedback for improvements
To optimize your approach in analyzing customer feedback for enhancing data visualizations, it's crucial to thoroughly assess all received feedback, categorize it, and identify trends and root causes. By categorizing feedback into themes such as product quality or user experience, you can more effectively identify common issues that impact customer satisfaction. Both positive and negative feedback are valuable; positive feedback highlights what is working well, while negative feedback points out areas needing improvement, which is essential for preventing customer churn.
Furthermore, employing data visualization tools like FineVis, particularly for large-screen displays, can provide a clearer understanding of feedback patterns through dynamic visual formats such as heatmaps or bar charts. These tools allow you to visually represent complex data, making it easier to spot recurring feedback themes or issues.
To effectively use customer feedback for continual improvement, prioritize feedback from your most loyal users, as they are key to long-term success. It's also beneficial to employ automated tools for sentiment analysis, which can expediently identify common themes and sentiments in the feedback, thereby streamlining the process of turning raw data into actionable insights.
Iterating on Design
Making data-driven adjustments
To effectively make data-driven adjustments to your visualizations, leverage user feedback to enhance clarity and functionality. If users find a chart confusing, consider simplifying its design or adding explanatory text to improve comprehension. This approach aligns with best practices in data-driven decision-making, which suggest that adjustments should be based on thorough data analysis and visualization, as supported by tools like FineReport, Fine BI and FineVis.
FineVis, in particular, excels in creating engaging large-screen visualizations that can make complex data more accessible and actionable. By continuously refining your visualizations based on user interactions and feedback, you ensure your data presentations not only meet but exceed user expectations, thereby enhancing user experience and engagement.
Ensuring alignment with original goals
To refine your designs effectively, always align your visual elements with the intended communication goals. This alignment ensures that your visualizations are not only coherent but also maintain their focus on the original purpose. A well-aligned design helps in effectively conveying the intended message and engages the audience meaningfully. This approach is crucial for creating impactful visualizations that do more than just display data—they provide insights and drive engagement.
"Effective data visualization begins with solid design principles, which include selecting the appropriate visual representation for the data."
Using visualizations like bar charts for comparisons and line plots for tracking changes over time can optimize how information is perceived and understood by different audiences. Additionally, incorporating modern tools and techniques, such as those offered by platforms like FineVis for large-screen visualizations, can enhance the clarity and impact of your data presentations.
Common Pitfalls to Avoid in Data Visualization Principles
Creating effective data visualizations requires careful attention to detail. You must avoid common pitfalls that can undermine the clarity and accuracy of your visuals. By steering clear of these mistakes, you ensure that your data visualization communicates insights effectively and maintains credibility.
Misleading Visualizations
Misleading visualizations can distort the truth and lead to incorrect interpretations. You must take steps to ensure that your visuals accurately represent the data.
Data Visualization Principles: Avoiding distortion of data
Data distortion often occurs unintentionally. For example, using 3D pie charts can skew perception. The angles and perspectives can make sections appear larger than they are, leading to misinterpretations. To avoid this, stick to simpler, two-dimensional charts that present data clearly. Ensure that your visualizations maintain the integrity of the data.
Data Visualization Principles: Ensuring accurate representation
Accurate representation is crucial for maintaining trust. A common mistake involves manipulating the Y-axis scale. Truncated scales can exaggerate differences, misleading the viewer. Always use a consistent scale that reflects the true nature of the data. This practice ensures that your audience receives an honest and transparent view of the information.
"Presenting data in a misleading way can happen unintentionally, undermining the credibility of the data."
Overcomplicating Visuals
Complex visuals can overwhelm your audience. You should aim for simplicity to ensure that your data visualization remains accessible and easy to understand.
Data Visualization Principles: Keeping designs straightforward
Straightforward designs enhance comprehension. Avoid adding unnecessary elements that clutter the visualization. Focus on the essential data points that convey the main message. By keeping your designs simple, you help your audience grasp the insights quickly and efficiently.
Data Visualization Principles: Prioritizing essential information
Prioritize the most important information in your visuals. Highlight key data points that align with your communication goals. This approach ensures that your audience focuses on the insights that matter most. By emphasizing essential information, you create impactful visualizations that resonate with your viewers.
"Effective data visualization begins with solid design principles, which include selecting the appropriate visual representation for the data."
By avoiding these common pitfalls, you adhere to essential data visualization principles. This approach ensures that your visuals are not only informative but also trustworthy and engaging.
Tools and Resources for Effective Data Visualization Principles
To master data visualization, you need the right tools and resources. These can help you create clear, impactful visuals that communicate your insights effectively.
FanRuan's FineReport, FineBI, and FineVis
FanRuan offers a suite of powerful tools designed to enhance your data visualization capabilities.
Overview of features and capabilities
- FineReport: This tool provides enterprise-level reporting and dashboard capabilities. You can create dynamic reports with its flexible report designer. FineReport supports diverse visualization types, making it easier to uncover deeper insights from your data.
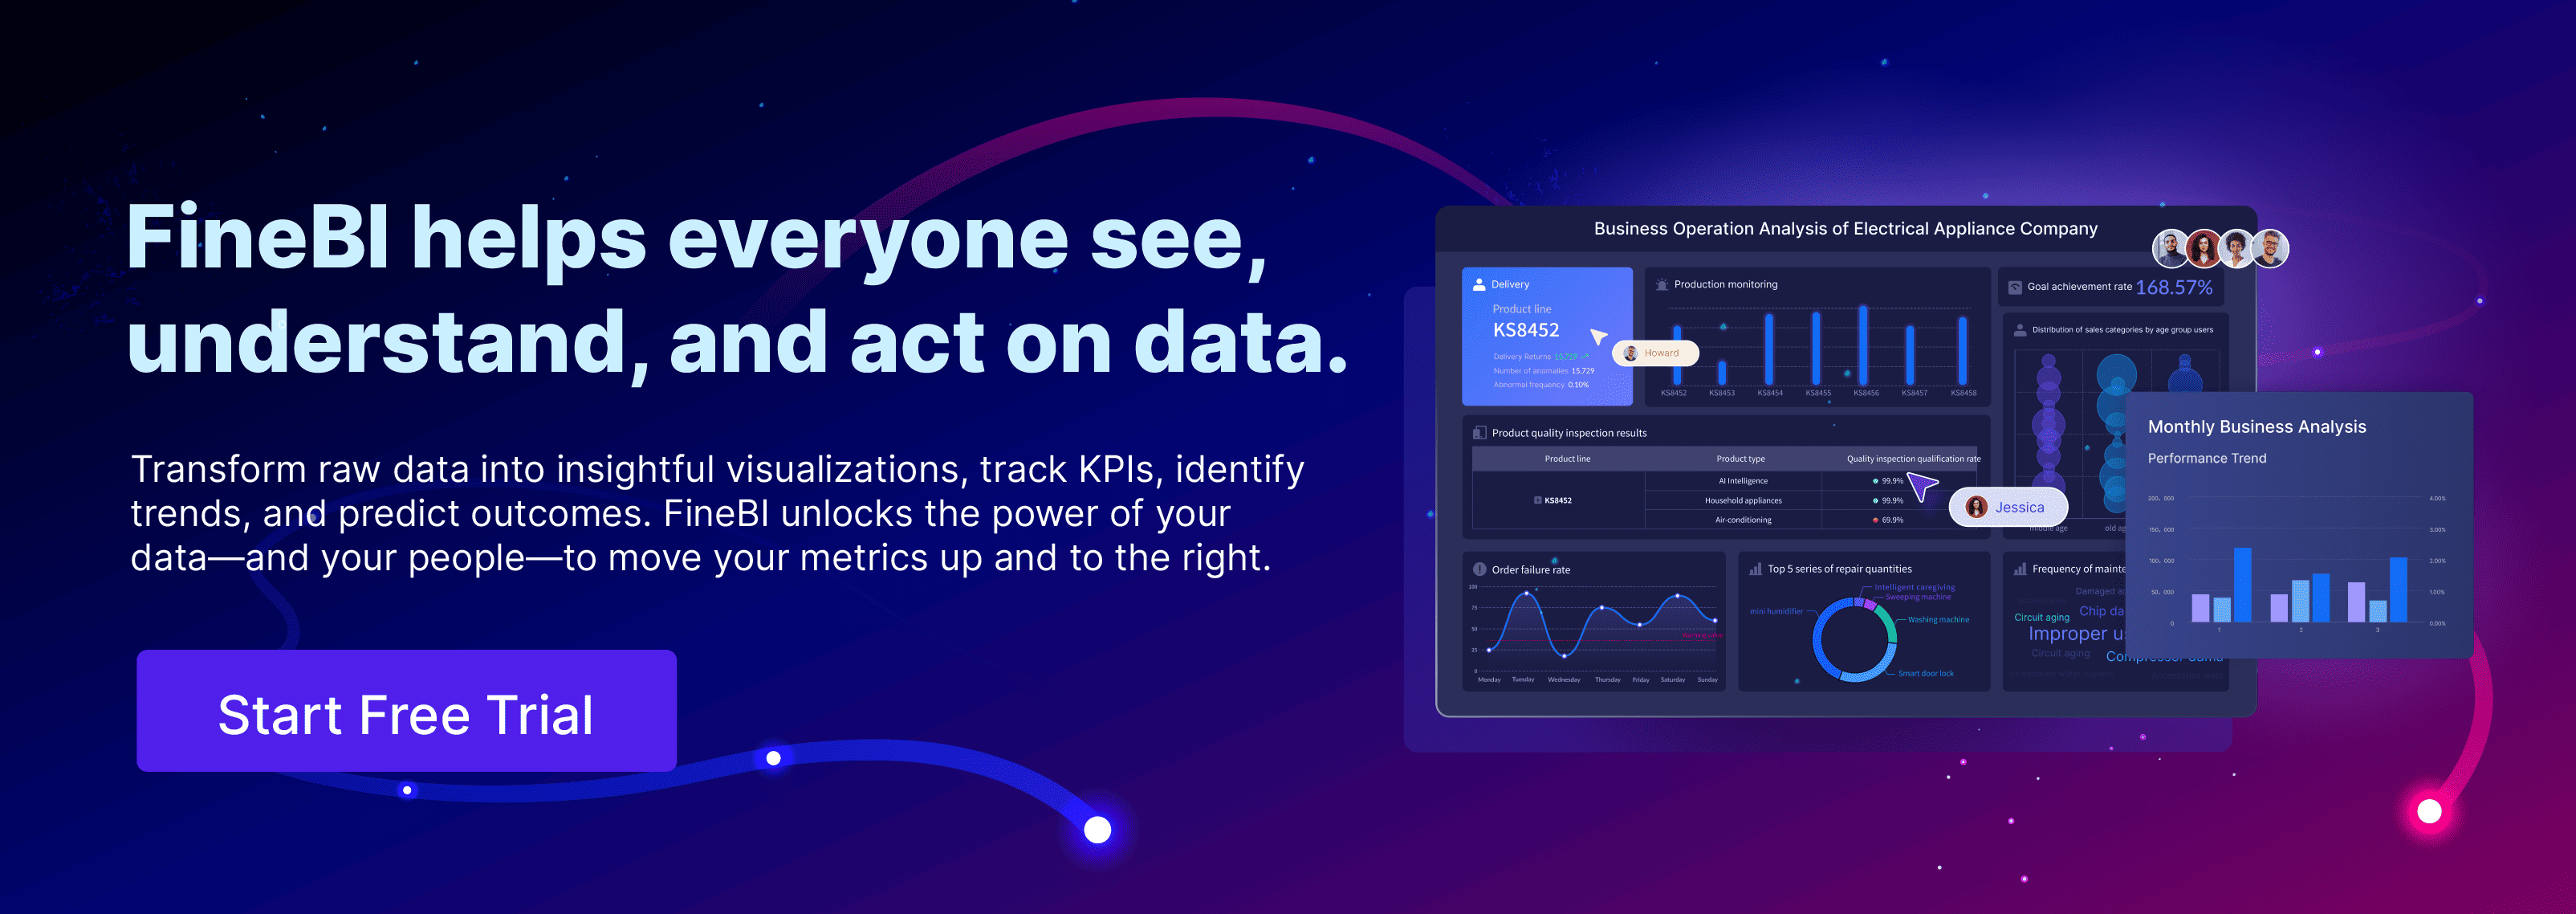
- FineBI: As a self-service business intelligence software, FineBI empowers you to explore data independently. It allows you to connect, analyze, and share data across your organization. With FineBI, you can transform raw data into insightful visualizations, track KPIs, and predict future outcomes.
- FineVis: FineVis excels in creating interactive and dynamic visualizations. With over 60 chart types, you can craft compelling visual stories effortlessly. Its zero-code, drag-and-drop interface makes it accessible to users of all skill levels, enabling you to customize dashboards quickly.
How these tools support data visualization principles
FineReport, FineBI, and FineVis each play a unique role in advancing data visualization principles by focusing on ease of integration, user empowerment, and dynamic presentation. FineReport excels in data integration, allowing comprehensive analysis through its support for various data sources and offering an extensive range of visualization styles. FineBI enhances user experience by enabling zero-code visual analytics and recommending optimal chart types for effective data presentation.
FineVis distinguishes itself with robust 3D visualization capabilities and an intuitive drag-and-drop interface, ideal for creating interactive dashboards that adapt to various devices. Together, these tools effectively democratize data analysis, making it accessible and impactful across different user levels and business needs.
Learning and Development Resources
To further enhance your data visualization skills, consider exploring various learning and development resources.
Online courses and tutorials
Online platforms offer an extensive array of courses on data visualization, catering to learners at all levels. Popular platforms like Coursera, Udemy, and LinkedIn Learning feature courses designed by top universities and industry leaders, focusing on both foundational skills and advanced techniques. These courses typically cover a variety of tools, including Tableau for creating compelling large-scale visualizations and Power BI for crafting interactive reports. With the flexibility of learning at your own pace, these courses are ideal for applying new skills directly to your projects, whether you're using FineReport, Fine BI and FineVis, or other visualization tools.
Books and articles for further reading
To deepen your understanding of data visualization principles, engaging with seminal books like Edward Tufte's "The Visual Display of Quantitative Information" and Cole Nussbaumer Knaflic's "Storytelling with Data" is highly beneficial. These works are acclaimed for their thorough exploration of how best to display quantitative data and tell compelling stories through visuals. Incorporating these insights with tools like FineReport, Fine BI and FineVis, especially for large-screen visualizations, can greatly enhance your ability to present complex data in an accessible and effective manner. Such knowledge is foundational for creating visualizations that not only capture attention but also communicate information clearly and effectively.
"Effective data visualization begins with solid design principles, which include selecting the appropriate visual representation for the data."
Enhancing your data visualizations is crucial in today's data-driven world. By leveraging advanced tools such as FineReport, Fine BI and FineVis, you can create impactful visuals that effectively communicate key insights. These tools support a variety of visualization types, from dynamic large-screen displays to intricate dashboard elements, catering to diverse data presentation needs. They enable seamless integration with data sources and provide intuitive interfaces that simplify the visualization process. Whether you are aiming to convey complex datasets in a straightforward manner or to tell a compelling data-driven story, these tools equip you with the capabilities to deliver clear and engaging visuals that resonate with your audience.

FAQ of Data Visualization Principles
1. What are the key principles of effective data visualization?
Effective data visualization relies on several key principles:
- Clarity: Ensure your visuals communicate the intended message without confusion.
- Simplicity: Avoid unnecessary elements that may distract from the main insights.
- Consistency: Use consistent colors, fonts, and symbols to enhance readability.
- Context: Provide labels, legends, and titles to give context and explanation.
- Balance: Utilize white space and alignment to create a harmonious layout.
2. How do I choose the right type of visualization for my data?
Selecting the right visualization type depends on your data and the message you want to convey:
- Bar Charts: Ideal for comparing different categories or groups.
- Line Graphs: Best for showing trends over time.
- Pie Charts: Suitable for displaying simple proportions.
- Heatmaps: Useful for visualizing data density and patterns.
- Scatter Plots: Perfect for identifying correlations between variables.
3. Why is understanding the audience important in data visualization?
- Audience Expertise: Different audiences have varying data literacy levels. Executives need high-level insights, while analysts require detailed data. Tailoring visuals ensures understanding.
- Audience Interests: Understanding the audience's focus helps highlight relevant insights, making the data more impactful and aligned with their goals.
- Presentation Context: The setting influences the visual format. High-level charts work in meetings, while detailed dashboards are suitable for in-depth analysis.
- Engagement: Customizing visuals increases audience engagement, encouraging questions and meaningful discussions.
- Better Decisions: Clear visuals lead to informed decision-making, ensuring the data is understood and applied effectively.
4. How can I avoid common pitfalls in data visualization?
To avoid common pitfalls:
- Avoid Misleading Visuals: Ensure accurate representation by using appropriate scales and avoiding distortion.
- Keep Designs Simple: Focus on essential information and remove clutter.
- Prioritize Clarity: Use straightforward designs to enhance comprehension.
5. What tools can help me create effective data visualizations?
Tools like FineReport, FineBI and FineVis offer powerful features for creating impactful data visualizations. FineReport provides dynamic reporting capabilities, FineBI empowers self-service analytics, and FineVis offers over 60 chart types for compelling storytelling. These tools support essential data visualization principles, ensuring clarity and engagement.
6. Where can I learn more about data visualization principles?
To deepen your understanding, consider exploring:
- Online Courses: Platforms like Coursera and Udemy offer comprehensive courses on data visualization.
- Books: Titles like "The Visual Display of Quantitative Information" by Edward Tufte provide valuable insights.
- Articles: Reading articles on data visualization can keep you updated on the latest trends and techniques.
By adhering to these principles and utilizing the right tools and resources, you can master data visualization and communicate insights effectively.
Understanding and applying data visualization principles is crucial for effective communication. These principles help you transform complex data into clear insights. Tools like FineReport, FineBI and FineVis empower you to practice and refine these skills. Effective data visualization enhances decision-making by making information accessible and engaging. It allows you to communicate insights swiftly and accurately. Explore further resources to continue learning and mastering these skills. By doing so, you can create compelling visual stories that captivate your audience and drive informed decisions.
Click the banner below to experience FineReport for free and empower your enterprise to convert data into productivity!


FAQ

The Author
Howard
FanRuan에서 재직하는 고급 데이터 분석가
Related Articles

10 Good Data Visualization Examples by Use Case: Sales, Surveys, Finance & Time-Series
If you are searching for $1 , you likely do not need another gallery of pretty charts. You need examples that help sales leaders hit targets, finance teams explain variance, operations managers monitor change, and analys
Yida Yin
Jun 15, 2026

12 Best Data Visualization Tools for 2026: Features, Pricing, Pros and Cons
$1 are software platforms that turn raw data into charts, dashboards, maps, and interactive visual stories for analysis and decision making. 12 best data visualization tools for 2026 at a glance
Lewis Chou
Apr 23, 2026

Top 8 Data Visualization softwares You Should Try in 2026
Compare the top 8 data visualization software for 2026, including FineReport, Tableau, Power BI, and more to find the best fit for your business needs.
Lewis
Mar 19, 2026