Are you still wrestling with cumbersome excel report workflows every morning? Copy‑pasting data, fixing broken links, and wrestling with version chaos can turn your first cup of coffee into frustration. Your teams deserve better than static spreadsheets and manual refreshes. Enter FineReport: a low‑code, drag‑and‑drop BI solution that transforms your outdated excel report process into a dynamic, automated, and secure reporting powerhouse. In this article, we’ll explore six key reasons why enterprises are ditching their excel habits and embracing FineReport—from automating repetitive tasks to unlocking real‑time insights and granular permission controls. Ready to break free from your excel report bottleneck? Let’s dive in.
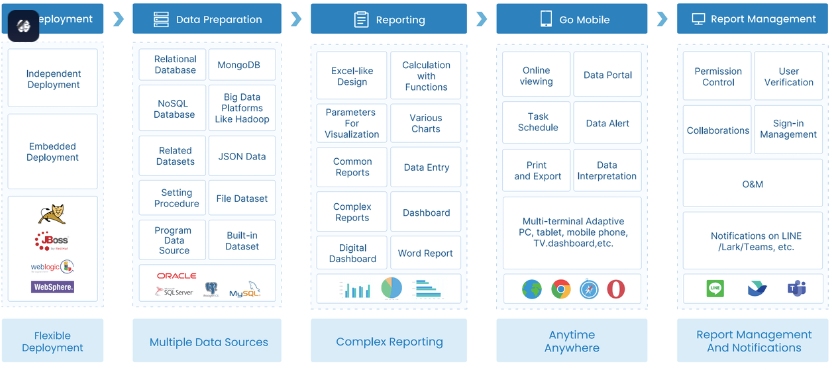
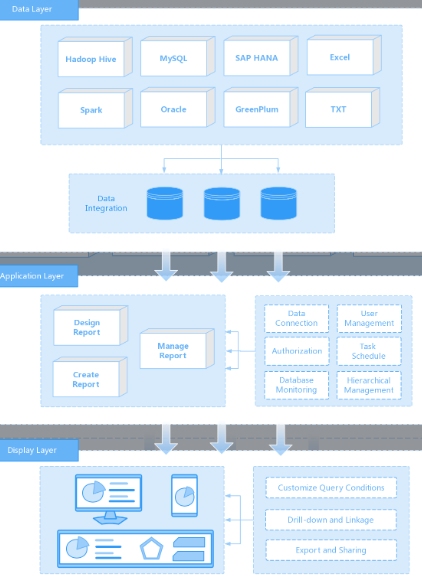
At the beginning, let's take a look at the architecture of FineReport, which will help to you get an over-round impression with it. FineReport, different from other repot tools, combines Report Designer and Report Server together. The workflow of FineReport can be divided into five main stages: Installation and Deployment, Data Preparation, Report Creation, Report Distribution, and Report Management. Typically, developers craft reports and dashboards, which are then shared with business users and managers for querying, analysis, exporting, and printing. Choosing FineReport not only enables you to gain access to the Report Designer but also shows you a comprehensive Decision-Making Platform. Now let's move on and discover the difference between FineReport and excel report.
Ⅰ. Break Free from Repetitive Excel Report Tasks with Automation
Pain: Manual Workflows & Copy-Paste Chaos in Your excel report
If you’re still exporting data from multiple spreadsheets, copy-pasting into a master workbook, and manually updating charts each morning, you know the drill all too well. Disparate data in standalone files leads to broken links and endless version confusion, and every “quick fix” only delays the headache until tomorrow’s excel report update FineReport. When hundreds of thousands of rows crash your workbook or VBA macros fail, your daily report routine grinds to a halt—and your team loses hours wrestling with formatting and integration FineReport.
FineReport Solution: Scheduling, Batch Bursts & Template Reuse
FineReport eliminates manual workflows by letting you define a report template once and schedule it to run automatically—daily, weekly, or monthly—with zero copy-paste required. Behind the scenes, the platform executes batch bursts of report generation, binding live data to your template and exporting to Excel, PDF, or email in one click FineReport. Even better, you can reuse the same excel report template across departments: design it once, share it everywhere, and maintain it centrally, slashing development and maintenance time by up to 90% FineReport. There is a good example in Supply chain management. Clients complaining about the reliance on manual operations or the so called paper-based reports/legacy reports/manual Excel, leading to high error rates. At the same time IT departments are becoming a single bottleneck, causing delayed responses. The appear of FineReport just like the batman jumps out of the darkness, offering automated Report transferring Excel/paper into interactive FVS/FBI dashboards, enabling automated data collection. Let's look at the example of supply chain management after adopting the FineReport.
Ⅱ. KPI Dashboard Requirements in Your Excel Report
Excel Report Limitations for KPI Dashboards
An excel report often starts as a simple table, but as you layer on KPIs it quickly buckles under its own weight. Chart updates require manual cell references, layouts break when you insert rows, and any change in source data forces you to rebuild slicers or pivot charts. By the time you share that report, key metrics may be out of sync or hidden behind confusing tabs.
FineReport’s Advanced KPI Dashboard Capabilities
FineReport lets you replace that brittle excel report with a true dashboard canvas. Drag-and-drop gauges, geo-maps, and trend lines—no formulas required. Conditional styling automatically flags threshold breaches, while parameter controls and drill-downs give users interactive access without duplicating the excel report file. Live data binding ensures every widget reflects current values. Now you can click the banner and try FineReport for yourself.

Advice for Migrating KPI Dashboards from Excel Report to FineReport
Audit Your KPIs: List all metrics in your existing excel and group them by theme.
Prototype in FineReport: Use a blank dashboard template to place your top 5 KPIs with drag-and-drop widgets.
Validate & Iterate: Compare visualizations side-by-side with your old excel report and refine filters or styles before full rollout.
Ⅲ. Real-Time Data Dashboard Requirements in the Excel Report
Static “Snapshot” Nature of Traditional excel report
An excel report delivers a frozen view of data captured at the time of export. Each pivot table and chart must be manually refreshed, and distributing updated report files via email guarantees stakeholders are working off stale numbers—undermining timely decision-making FineReport.
FineReport’s Real-Time Data Dashboards & Live Linkages
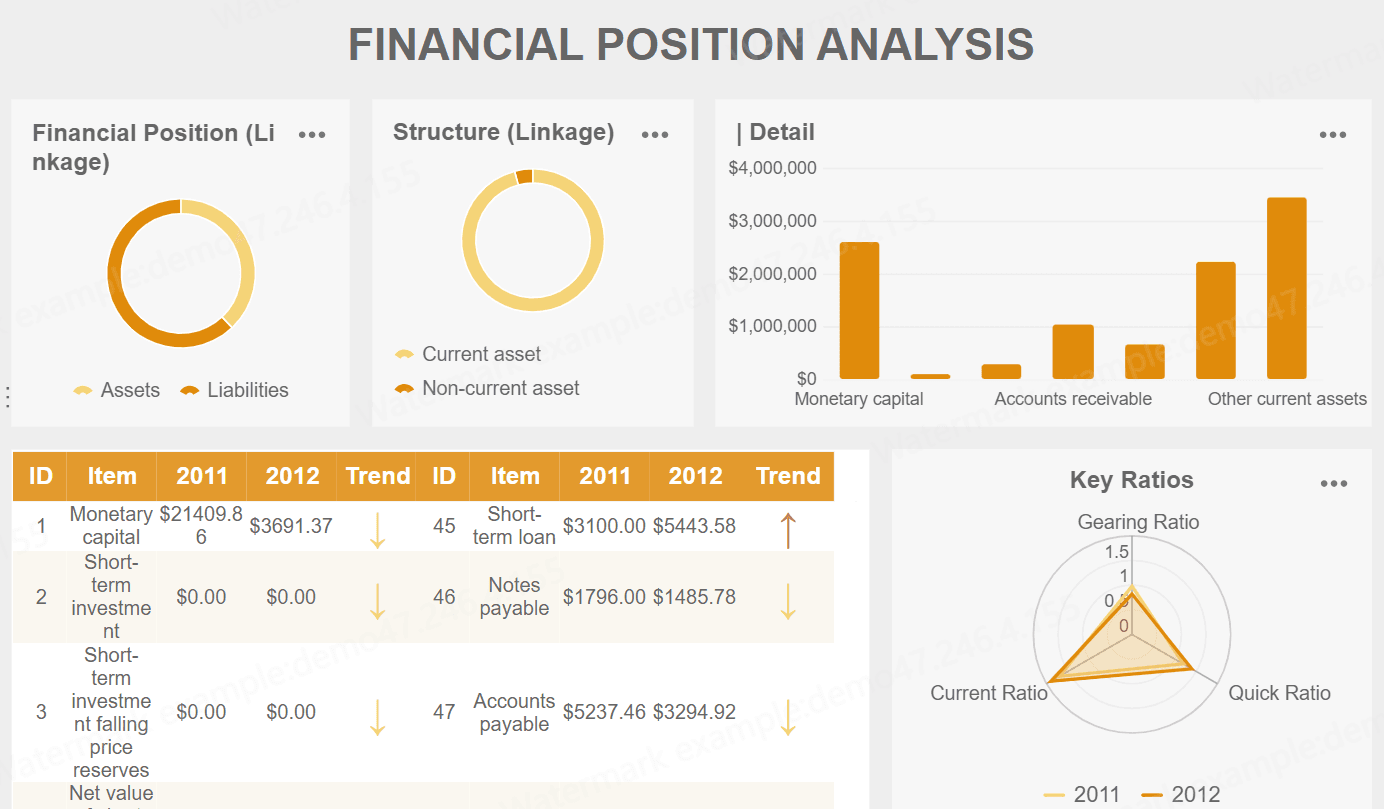
Another sparkle of FineReport is the Real-Time Dashboard. FineReport shatters the snapshot barrier by querying live databases (SQL Server, Oracle, MySQL, etc.) on every dashboard view, so your reports always reflect up-to-the-second information FineReport. You can schedule automatic refresh intervals from seconds to hours and configure push notifications (email, SMS, or FineMobile) that alert users immediately when KPIs cross critical thresholds. The best example we found in the area of Financial Management where time and accuracy mean everything. They required many times that Dashboard must load instantly, Initial render for complex dashboards must less than 2 seconds and Query response on million-row datasets must less than 1 second. With the combination of FDL FineReport makes it.
Step-by-Step Guide to Building Real-Time Dashboards Beyond Excel Report
Connect Live Data
In FineReport’s Report Designer, add a DB Query to point at your operational system—no exports or interim files needed.Design Real-Time Widgets
Drag line charts, gauges, or geo-maps onto the canvas and bind them to your live query; data refreshes automatically on view.Set Auto-Refresh & Alerts
On the Decision-Making Platform, define your dashboard’s refresh frequency and configure threshold-based alerts to push updates via email, SMS, or mobile.Publish & Share
Deploy your dashboard to the web portal or embed it in your intranet so everyone accesses the latest data—no more exchanging stale excel report files.
Ⅳ. Strategic Data Analytics Requirements for Excel Report
Constraints of an Excel Report in Strategic Analytics
When you push an excel report beyond basic summaries, its limitations become glaring. Standard pivot tables choke on more than four dimensions and often require separate files for each slice of the data—forcing you to manually merge and reconcile sheets across teams FineReport. Worse yet, disparate departments create their own versions of the same excel report, leading to data silos and inconsistent metrics that undermine executive decision-making FineReport.
FineReport’s Tools for Deep, Multi-Dimensional Analysis
FineReport addresses these challenges with a built-in OLAP engine and seamless data blending. Instead of crafting multiple excel report pivots, you define a single multi-dimensional cube by dragging dimensions (region, product, time) and measures (revenue, margin) into the dataset designer . FineReport pre-aggregates and indexes data for lightning-fast slice-and-dice, supports cross-database joins, and lets users drill down on any hierarchy in real time—no manual refresh or file juggling required FineReport. So it shows up with the clear architecture. First is the Data layer where report developers integrate the underlying data. Application layer follows, where report developers develop reports in the designer and manage reports on the decision-making platform. The last one is Display layer: report users view reports via PC, mobile or dashboard and can conduct data query in reports, click links to enable drill-down and linkage of report contents, export and share report pages.
Ⅴ. Achieve Seamless Data Connectivity Instead of Manual Excel Report Imports
Pain: Tedious One-Off Data Imports & ETL Dependencies
Let’s face it—manually pulling data from different systems just to update your excel report feels like chasing your own tail. Every refresh means jumping between platforms, downloading files, and pasting them into spreadsheets that break the moment something changes. And if you’re leaning on custom ETL scripts, even the smallest data tweak can throw off your entire process. It’s time-intensive, error-prone, and impossible to scale.
FineReport Solution: 500+ Built-In Connectors & ETL-Free Data Prep
FineReport flips the script by connecting directly to your business’s data sources—whether that’s an ERP, CRM, SQL database, or even a legacy spreadsheet. With over 500 built-in connectors, you can link to virtually any data system without needing an external ETL tool. Once connected, FineReport lets you prepare, blend, and visualize data all within a single platform—making the traditional excel report process feel like a relic of the past.
How-To Guide: Consolidate Data Sources and Retire Your Excel Report
Identify All Data Touchpoints
Start by mapping every system or file that feeds into your current excel report—including internal databases, cloud services, and local spreadsheets.Establish Live Connections
Use FineReport’s intuitive interface to set up direct data connections—supporting everything from SQL and Oracle to CSV and web APIs.Unify & Design Once
Combine data sources into unified datasets without any external prep work. Use drag-and-drop tools to build reports that update automatically.Replace Static Files with Dynamic Reports
Deploy your new dashboards and reports to the web with real-time updates. Say goodbye to emailing multiple excel report versions or fixing broken links.Maintain Less, Analyze More
With centralized management, your team can spend less time wrangling data and more time acting on insights.
No more downloading. No more merging. No more maintenance headaches. Just one click and now you can see how the magic FineReport works which is ready to surprise you.
With FineReport, you don’t just connect your data—you unify your workflow. It’s the smarter way to evolve beyond the manual excel report grind and move toward truly intelligent reporting.
Your legacy excel report may have served its purpose, but the future of reporting and analytics demands something more: automation instead of copy‑paste drudgery, interactive KPI dashboards instead of flat tables, strategic analytics instead of one‑dimensional pivots. FineReport delivers all this—and more—so you can stop fighting spreadsheets and start generating insights. Say goodbye to your daily excel report struggle: Click the banner below to try FineReport for free and join the growing ranks of enterprises that have already made the switch to smarter report!
Continue Reading about FineReport
Sales Report Sample: Templates and Guidelines
Top 10 Types of Reports in Business & Management (with Examples)
What Is Financial Reporting And Why Is It Important?

The Author
Lewis
Senior Data Analyst at FanRuan
Related Articles
The Role of Data Entry in Digital Transformation
Data entry is vital in digital transformation, ensuring data accuracy, enabling automation, and driving actionable insights for business growth.
Lewis
May 09, 2025
Top Platforms for Data Entry Work From Home in Malaysia
Discover the top platforms for data entry work from home in Malaysia. Find flexible, reliable opportunities to earn income remotely with no experience needed.
Lewis
May 09, 2025

What Is Data Entry and Its Role in Businesses Malaysia
What is data entry? It involves inputting and managing information in digital systems, ensuring accuracy, efficiency, and supporting decision-making in modern businesses.
Lewis
May 09, 2025