DAS Korea: From Manual Spreadsheets to Real-Time Automation—Uniting Data Across 12 Global Branches
Streamlined Operational Processes
More Accurate Data
24/7 Visualization
Underdeveloped IT systems, with Data Collection Processes
Founded in 1987, DAS Corporation specializes in the development and production of automotive seats, seat frames, and core mechanisms, and is one of the world’s leading automotive seat manufacturers. Headquartered in Gyeongju, South Korea, the company operates 12 overseas branches—6 in China, 2 in the United States, and 4 across Europe and Asia. DAS is a key supplier to HKMC (Hyundai/Kia Motors), and in mainland China, its major clients include Geely and Chang'An Automobile.
There has long been a disconnect between data from the international branches and the headquarters, preventing real-time integration. Each month, the planning team at headquarters collected raw data from every branch via email to prepare monthly reports for the CEO. This manual process resulted in inefficiencies and inaccuracies. The key task was to optimize business data management by leveraging existing infrastructure and to quickly build a lightweight yet practical reporting and decision-making system to support strategic decisions.
How to Achieve Global Data Integration with Various Metrcis?
Business metrics can be categorized into four main areas: production, quality, accounting and others.
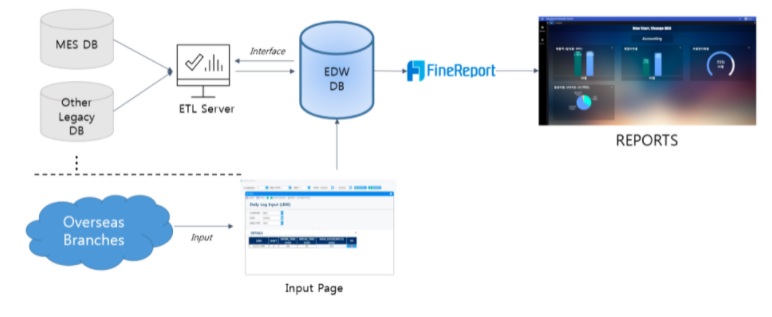
To present the reports, DAS created an additional data warehouse called EDW (Enterprise Data Warehouse). There are two main reasons for this: First, from the headquarters’ perspective, the data structures across various business systems are inconsistent, so refined data is required. For each dataset, key indicators are selected and calculated. These are automatically processed and imported into the EDW database through an ETL (Extract, Transform, Load) server. Second, some overseas branches of DAS Corporation have relatively low levels of systematization, so they currently input data directly into the EDW database (e.g., daily manufacturing logs).
Throughout the entire data modeling process, FineReport’s fast and intuitive visualization capabilities provided great convenience, enabling us to quickly extract the 「essence」from complex data, significantly reducing the workload. Moreover, the data entry (data collection) feature was particularly impressive — it precisely addressed the pain point of aggregating data from our overseas subsidiaries. With simple configuration, data could be written into the database, which also helped us cut down on development costs.
24/7 Real-time Display, along with Visualization and Interactivity, Makes Data Exploration Much Easier
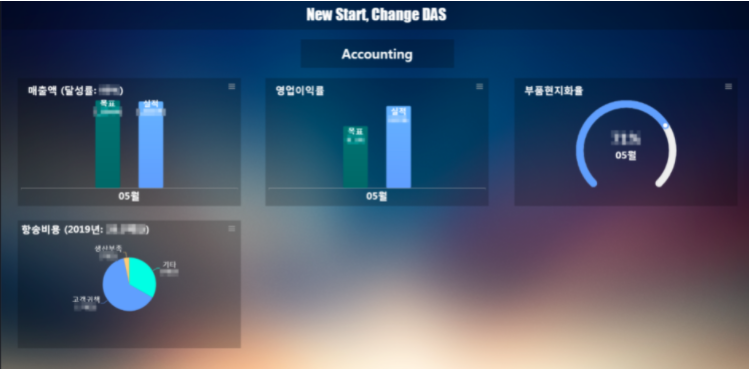
The KPI center fully leverages FineReport’s decision-making dashboard feature displaying 24/7 on large monitors in executive offices, it provides real-time visualization of 14 key indicators across DAS’s production, quality, and accounting domains.Each KPI utilizes visual chart elements such as bar charts, pie charts, and gauges to intuitively display target vs. actual performance, achievement rates, and proportional breakdowns. Additionally, clicking on any chart area allows users to drill down into detailed data for each KPI (see image below for reference).
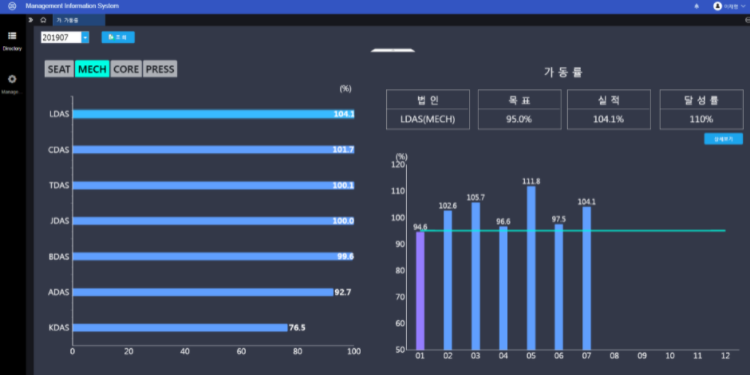
The screen shown is the first-level drill-down view of the KPI Dashboard. On the left, a bar chart compares performance across various subsidiaries. When multiple production stages are involved, the data is neatly organized using a tabbed layout. On the right, a combo chart (bar + line) tracks actual performance against monthly targets, clearly presenting goals, results, and achievement rates. The interface is fully interactive, allowing users to access deeper insights via a “Detailed Data” button. All first-level drill-down pages maintain a consistent visual design, which enhances the overall user experience and significantly boosts development efficiency through high template reusability. As a result, the project team successfully delivered over 60 high-quality report pages in just three months.
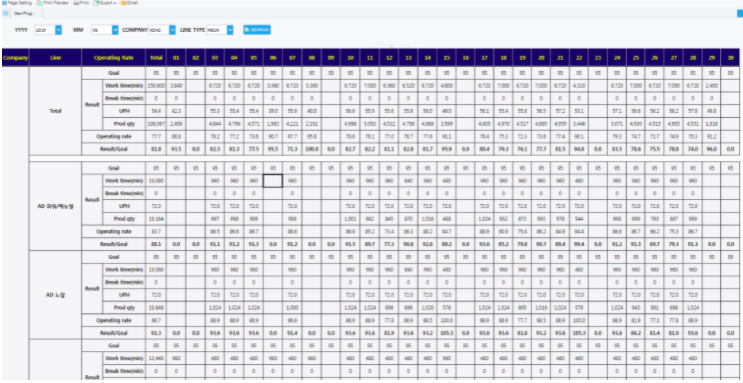
Unlike dashboards, reports provide more comprehensive data. These reports forgo visual charts in favor of raw tabular data, offering a more practical format for specialists who need to extract detailed insights directly from the data.
Data Integration Improves Accuracy in MES Systems
By implementing FineReport, DAS Corporation has streamlined its reporting process, eliminating the need for the headquarters' strategic planning team to manually collect and consolidate data for every business meeting. Decision-makers can now access real-time global data with greater speed and accuracy, significantly enhancing the management of overseas subsidiaries. This initiative has laid a strong foundation for DAS's pursuit of operational efficiency. In addition, the integration has introduced more rigorous and precise data management requirements across core systems such as SAP ERP, MES, GQMS, Oracle, and Windows Server.
DAS Corporation has developed over 58 reports using FineReport, with its unified data decision-making platform averaging more than 5,000 visits per month.
A unified global system has become an urgent priority. The key task is to optimize business data management by making the most of existing infrastructure, rapidly building a lightweight yet practical reporting and decision-making system, and enabling structured data to support strategic decisions.