How FineBI Works
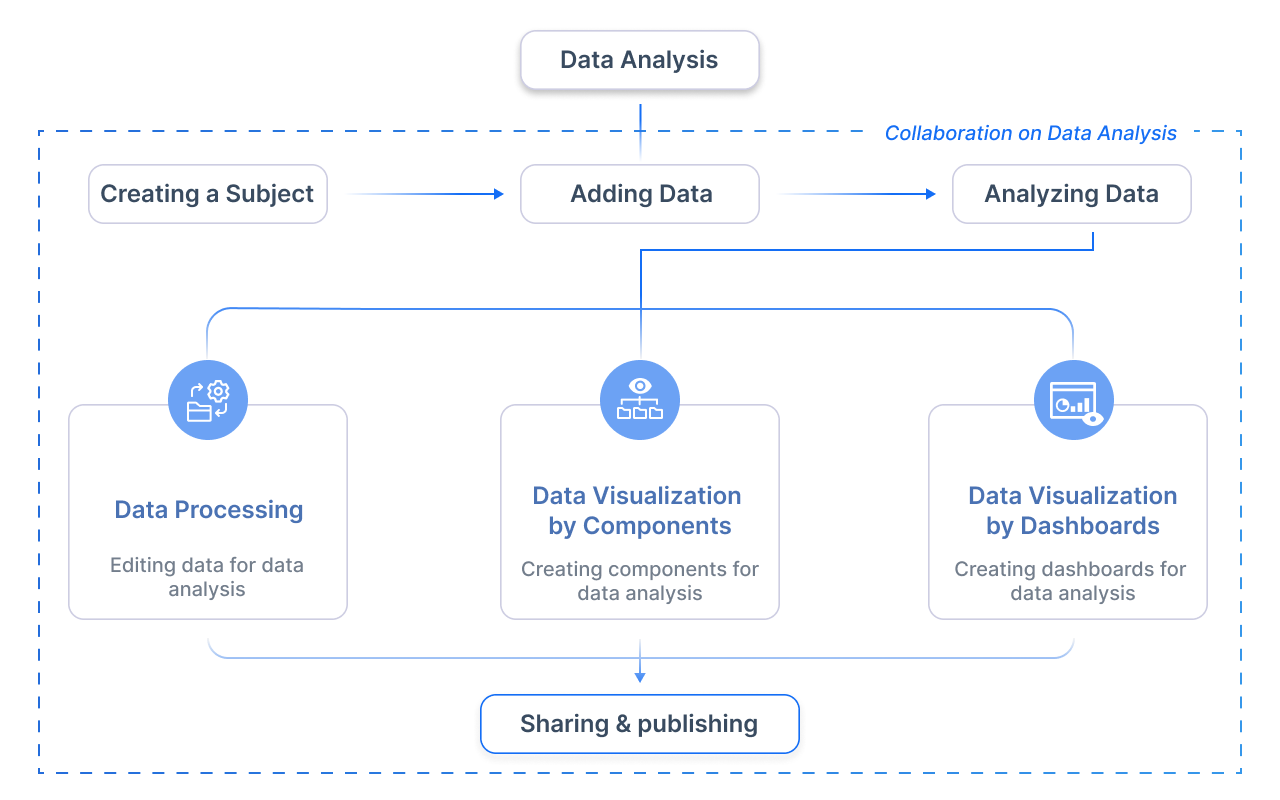
FineBI’s workflow is structured into four stages:
- Data Integration: Connect to sources, schedule incremental updates.
- Data Processing: Build datasets with joins, formulas, and hierarchies.
- Visual Exploration: Drag-and-drop charts, apply filters, and save reusable templates.
- Publishing & Governance: Share dashboards securely, audit user activity.
Connect to Data Sources
Overview
Before you can prepare, process, or visualize your data in FineBI, the first step is to connect to your data sources. FineBI offers 60+ out-of-the-box connectors, supporting everything from traditional databases and cloud data warehouses to big data platforms and API integrations. No matter where your data resides, FineBI makes it easy to bring all your information together for unified analysis.
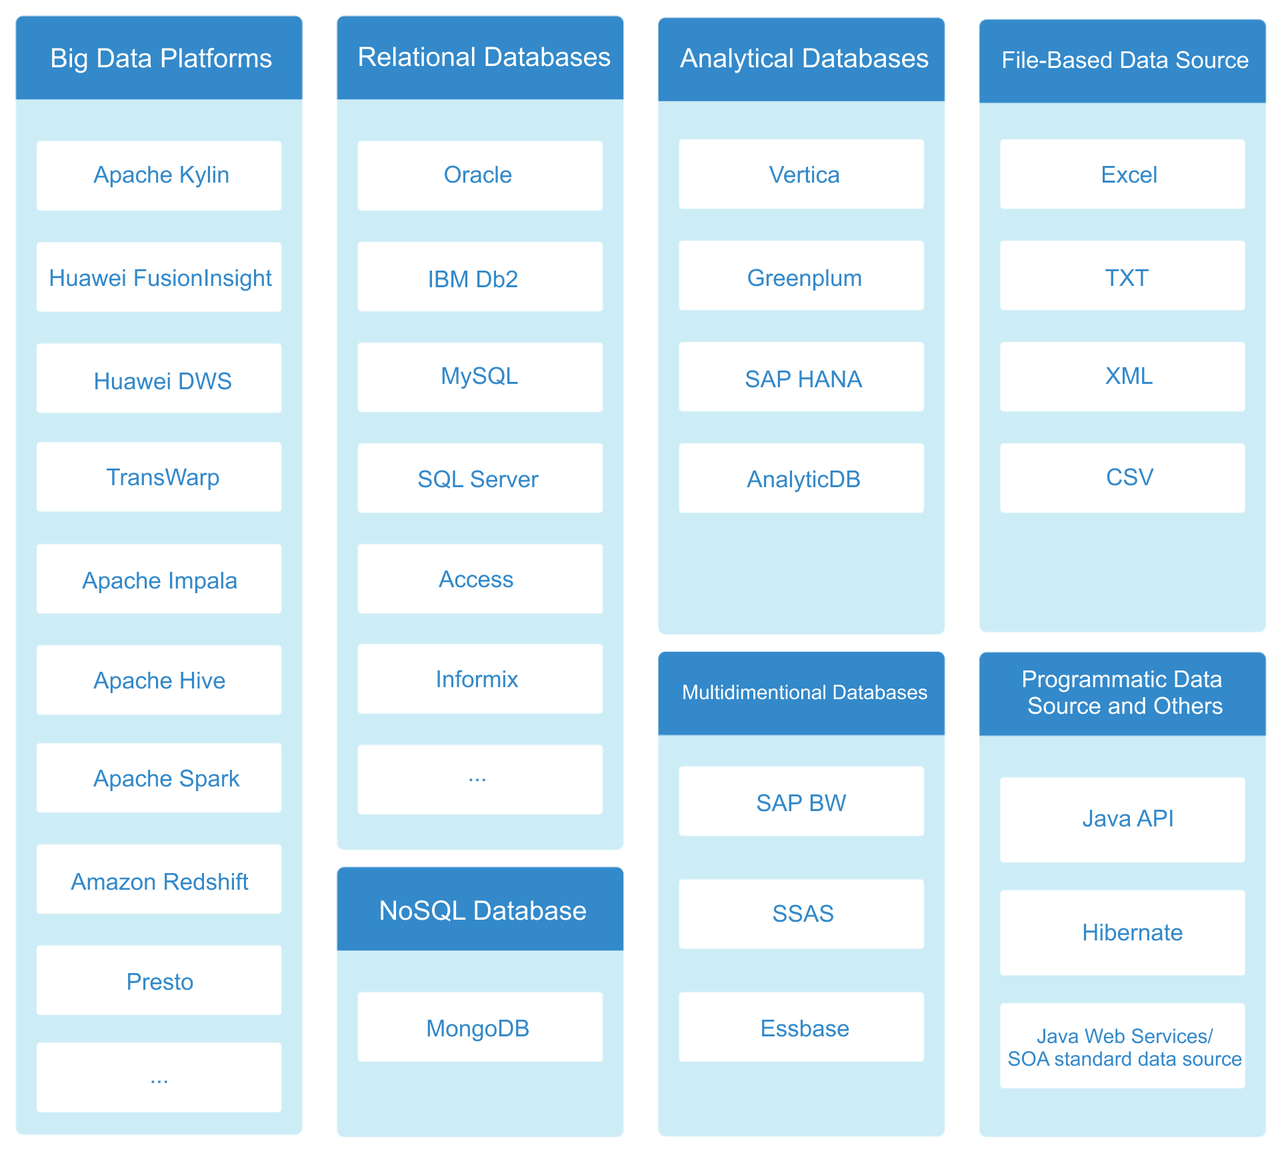
1. Database Drivers
FineBI supports a wide variety of database systems, enabling seamless connection to both on-premises and cloud-based environments.
-
Relational Databases - Connect to popular relational databases including:
MySQL
Open-source relational database management system
PostgreSQL
Advanced open-source object-relational database
SQL Server
Microsoft's enterprise-grade database platform
Oracle
Enterprise-level database management system
-
Cloud Data Warehouses - Integrate with modern cloud-native warehouses:
Snowflake
Cloud-native data warehouse platform
Amazon Redshift
AWS cloud data warehouse service
Google BigQuery
Serverless data warehouse solution
-
Big Data Platforms - Leverage big data frameworks such as:
Hadoop
Distributed storage and processing framework
Spark
Fast and general-purpose cluster computing
HBase
Distributed, scalable big data store
Cassandra
Highly scalable NoSQL database
FineBI supports advanced connection settings including SSL, authentication options, and query performance tuning, ensuring secure and efficient database access.
2. File & API Integration
In addition to databases, FineBI enables you to easily connect to file-based data and web APIs:
- File Uploads: Upload Excel, CSV, or flat files directly into FineBI for immediate use.
- API Connections: Connect to REST APIs and fetch real-time data from external systems.
- Structured Data Parsing: Parse JSON and XML data formats, ensuring compatibility with various third-party systems.
FineBI supports scheduled data fetching from APIs, enabling you to keep dashboards up-to-date with minimal manual effort.
3. Custom Connections & Extensions
For more advanced use cases or integration with legacy systems, FineBI provides flexible custom connection options:
- JDBC/ODBC Support: Link to any system supporting JDBC or ODBC drivers, extending compatibility to a broad range of platforms.
- SDK Integration: Use Python or Java SDKs to develop custom connectors tailored to your specific business systems.
- FineDataLink Integration:
Leverage FineDataLink, FanRuan’s dedicated data development framework, to:
- Streamline data integration pipelines.
- Perform advanced ETL (Extract, Transform, Load) operations.
- Enhance data management and governance across your organization.
FineDataLink can also serve as the bridge between FineBI and complex multi-source data environments, enabling consistent, high-quality data delivery for reporting and analytics.
Next Steps
Once your desired data sources are connected, you can proceed to Prepare and Process Data to customize, clean, and structure the data for in-depth analysis and visualization in FineBI.
Prepare and Process Data
Overview
Before building dashboards in FineBI, it is essential to prepare and process your data to ensure it is clean, consistent, and ready for analysis. FineBI provides a variety of self-service, user-friendly tools that allow you to connect, transform, and refine your data—without needing complex coding skills.
Whether you're dealing with data from relational databases, Excel files, or big data platforms, FineBI simplifies the data preparation process, making it easier for you to focus on analysis and visualization.
1. Create Self-Service Data Sets
Once your data source is connected, you can begin by creating self-service data sets. FineBI enables users to extract relevant tables and fields and customize the data sets based on their specific analytical needs.
Key operations include:
- Selecting Fields: Choose specific columns to focus on necessary data only.
- Joining Tables: Combine multiple tables using key relationships to enrich your data set.
- Adding Calculated Fields: Define new metrics using formula expressions.
- Applying Filters: Filter out unnecessary records to streamline the data set.
You can preview the results of your operations at any time to ensure the data set meets your analysis requirements.
2. Use Union Data Sets
For cases where data needs to be consolidated from multiple self-service data sets, FineBI offers the Union Data Set feature. This allows you to:
- Merge Multiple Data Sets: Combine similar data sets into one unified source.
- Ensure Data Consistency: Align fields and formats across different departments or systems.
- Apply Further Processing: Perform calculations or filtering on the unified data set.
This is particularly useful when integrating data from different business systems for comprehensive analysis.
FineBI supports both row-wise union and column-wise union, giving you flexibility depending on your data structure.
3. Clean and Refine Data
FineBI provides a range of built-in data cleaning tools to ensure data quality and consistency:
- Edit Field Names and Types: Standardize field names and data types for clarity.
- Handle Null Values and Duplicates: Replace, remove, or fill missing values and eliminate duplicate records.
- Standardize Values: Ensure values follow a consistent format.
- Sort and Group Data: Organize the data meaningfully to prepare for analysis.
Clean and refined data at this stage helps prevent downstream issues such as incorrect visualizations or misinterpretation of results.
Next Steps
Once your data has been properly prepared—whether through creating self-service data sets, merging multiple sources, or cleaning and refining records—you’re ready to proceed to the next step: Creating Dashboards to visualize, explore, and derive insights from your data.
Create Dashboards
Overview
A dashboard in FineBI is a visual interface that integrates various charts, tables, and indicators to present key metrics and business trends in one place. With FineBI’s self-service dashboard, you can quickly transform raw data into interactive, real-time visualizations—without writing any code. Simply drag and drop components to build your dashboard, apply filters, and customize layouts based on your business needs.
FineBI supports seamless integration of data from multiple sources. Whether you're monitoring sales performance, financial status, or operational efficiency, dashboards provide a unified view to facilitate informed decision-making.
How to Create A Dashboard in FineBI
Creating dashboards in FineBI is a structured process that transforms your data into insightful visualizations. Follow these steps to build an effective dashboard:
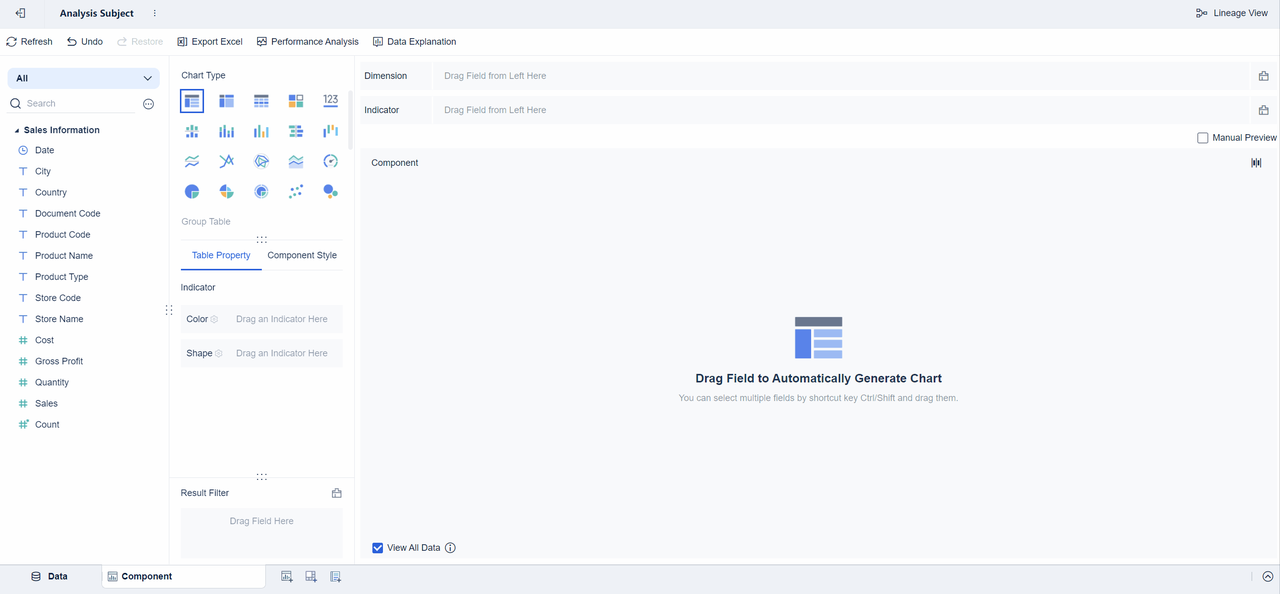
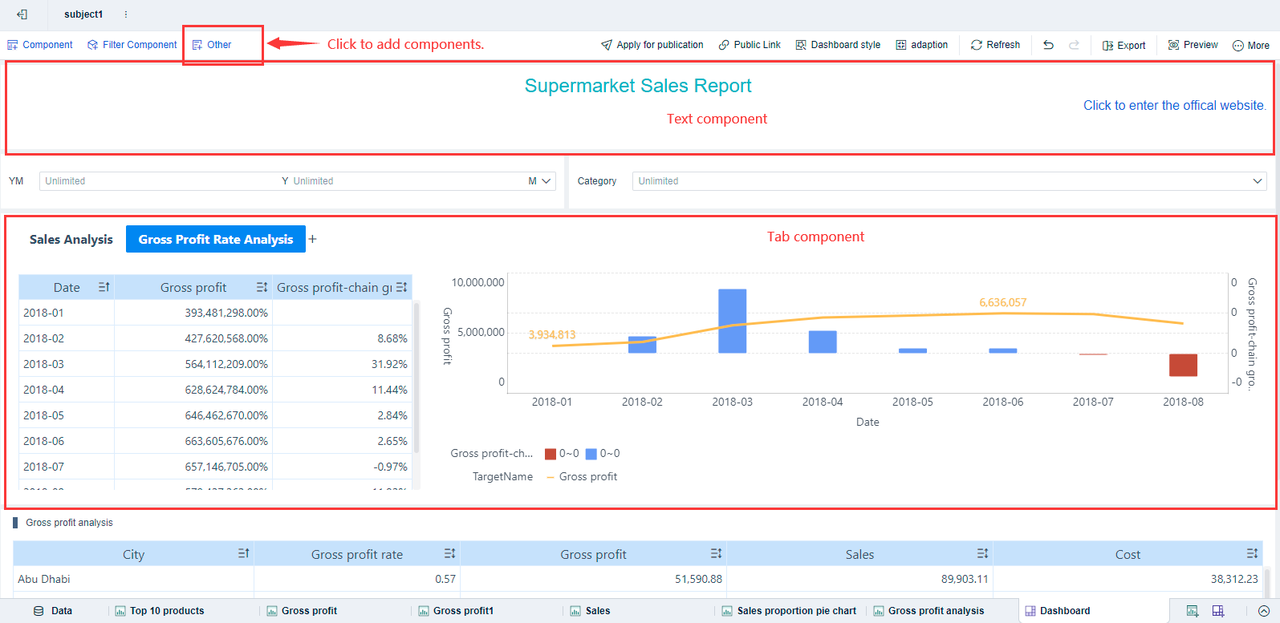
- Add Components
- In the dashboard editor, click the "Add Component" button to insert various components such as charts and tables.
- Drag and drop the desired data fields into the Dimension and Indicator areas of the component to create the necessary visualizations.
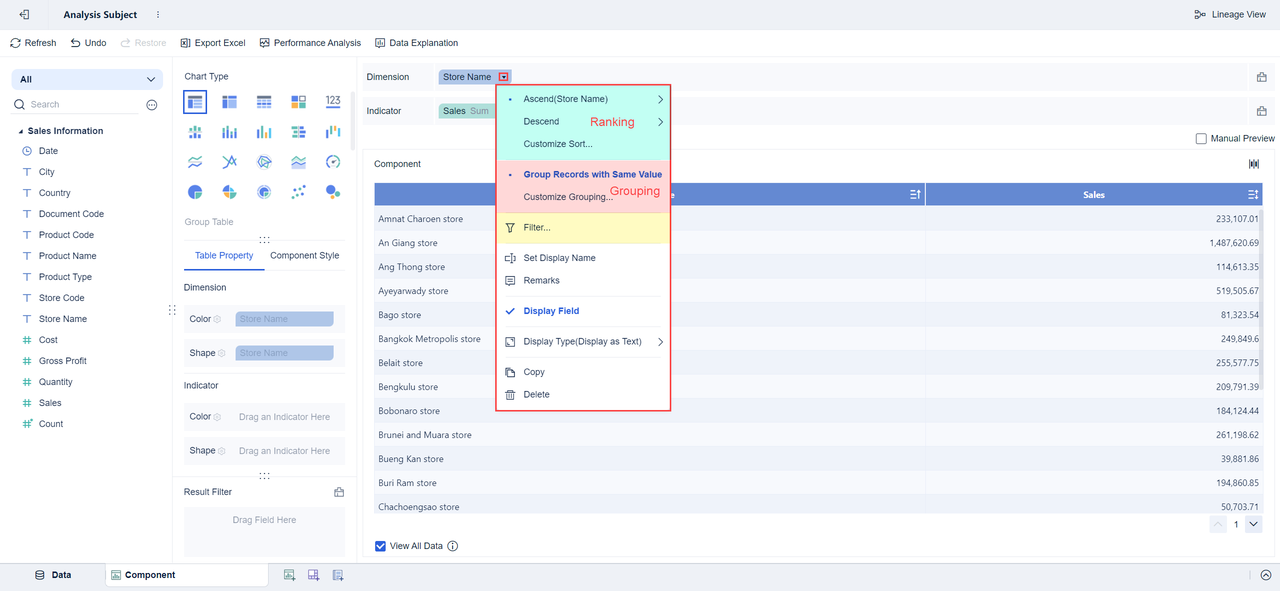
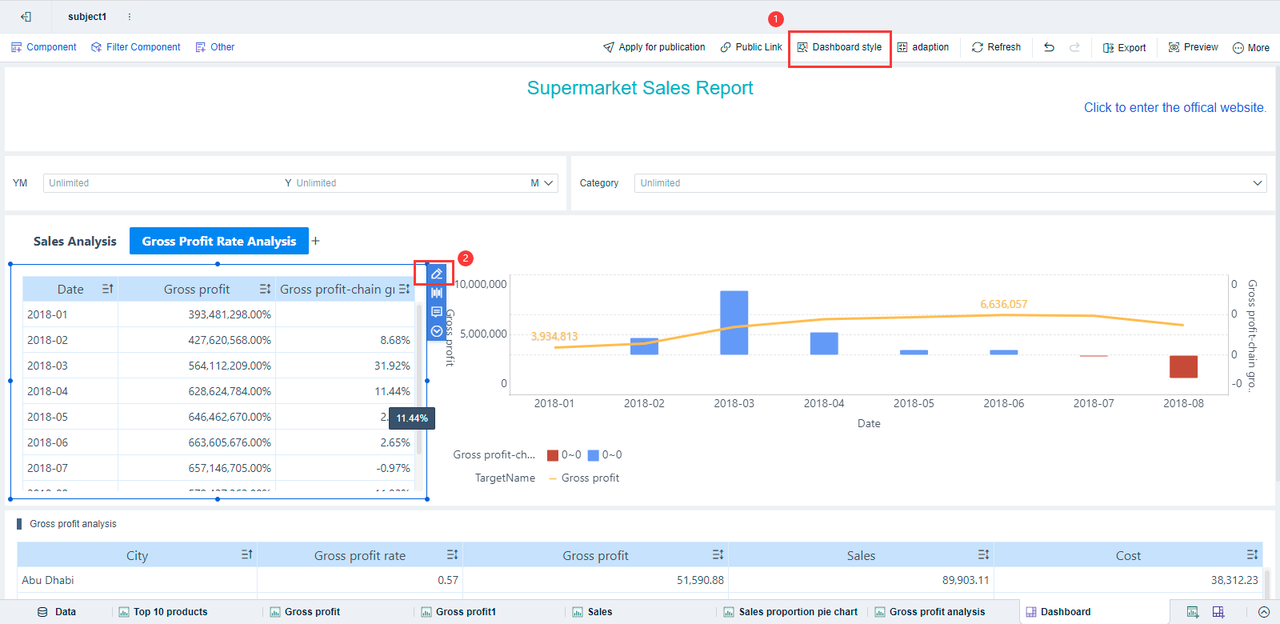
- Further Data Analysis
After dragging the desired fields into the Dimension and Indicator areas, you can fine-tune the data to ensure it is displayed in the most meaningful way. Click the icon next to each field in the analysis area to open a drop-down menu of available settings.
- Customize Component Layout
- Adjust the size and position of each component by dragging their borders to ensure a clear and aesthetically pleasing dashboard layout.
- Incorporate Additional Elements
- Click on "Other" to add elements like text components, image components, web components, and tab components, enriching the dashboard's content.
- Enhance Dashboard Appearance
- Utilize the "Dashboard Style" settings to select predefined styles or customize the appearance, improving the visual appeal of the dashboard.
- For tab components, access "Style Settings" to further refine their appearance.
- Preview and Publish
- After designing the dashboard, click the "Preview" button in the upper right corner to view the final output.
- Once satisfied, save and publish the dashboard to share it with others.
By following these steps, you can create a comprehensive and visually appealing dashboard in FineBI, effectively presenting and analyzing your data.
Key Features and Advantages
Self-Service Dashboard Creation
FineBI empowers business users to independently create dashboards through an intuitive drag-and-drop interface. No technical expertise required—users can freely select visual components, customize styles, and arrange layouts.
Rich Visualization Components
FineBI offers a wide variety of built-in charts and tables, including:
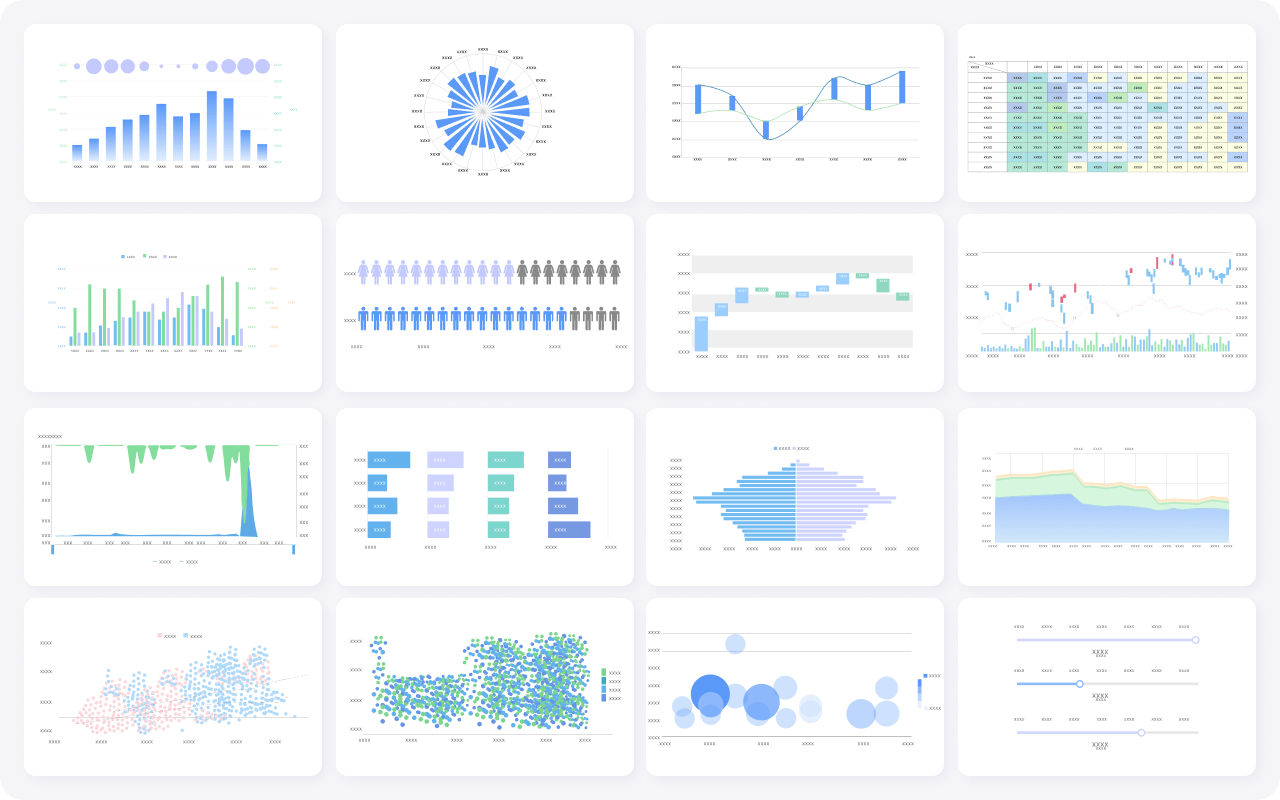
- Bar charts, pie charts, line charts
- Pivot tables and crosstabs
- Geographic maps
- Trend and comparison analysis charts
Additionally, features like conditional formatting, drill-down, and linkage between components make the dashboard highly interactive.
Real-Time Filtering & Interaction
Users can apply filters, slicers, and parameter controls directly on the dashboard. Filtered results update in real time, enabling users to dynamically analyze different dimensions and time periods without altering the underlying data set.
You can configure global filters to control multiple components at once, making it easier to switch perspectives across the entire dashboard.
Responsive Design Across Devices
FineBI dashboards are fully responsive, automatically adapting to desktops, tablets, and smartphones. This ensures that decision-makers can access and interact with data anytime, anywhere.
Collaboration & Secure Sharing
Dashboards can be shared within teams or departments with customized permissions. FineBI supports user-level and role-level access control to ensure sensitive data is securely distributed.
You can use the Dashboard Templates provided by FineBI to quickly get started. Templates include pre-built layouts and components tailored to common business scenarios. Simply select a template and customize it based on your data.
Next Steps
Once your dashboard is built, you can proceed to publish it for your team, set up data refresh schedules, or configure alerts and notifications to stay informed of key changes.
Share the Dashboard
Once your dashboard is complete, FineBI offers several flexible options to share your insights with others:
- Collaboration Sharing: Share the entire analysis subject with other users, allowing them to view or collaboratively edit dashboards and components. Assign specific permissions such as Use (view only) or Edit (collaborative editing) based on your needs.
- Directory Publishing: Publish your dashboard to a designated directory for enterprise users to access it regularly. Admin users can publish directly, while common users need approval.
- Public Link Sharing: Generate a public link to share the dashboard without requiring FineBI login credentials, ideal for external sharing or small groups. Customize mobile layouts and ensure proper network configuration for external access.
For more details on each sharing method, refer to the official documentation here: FineBI Sharing Analysis.