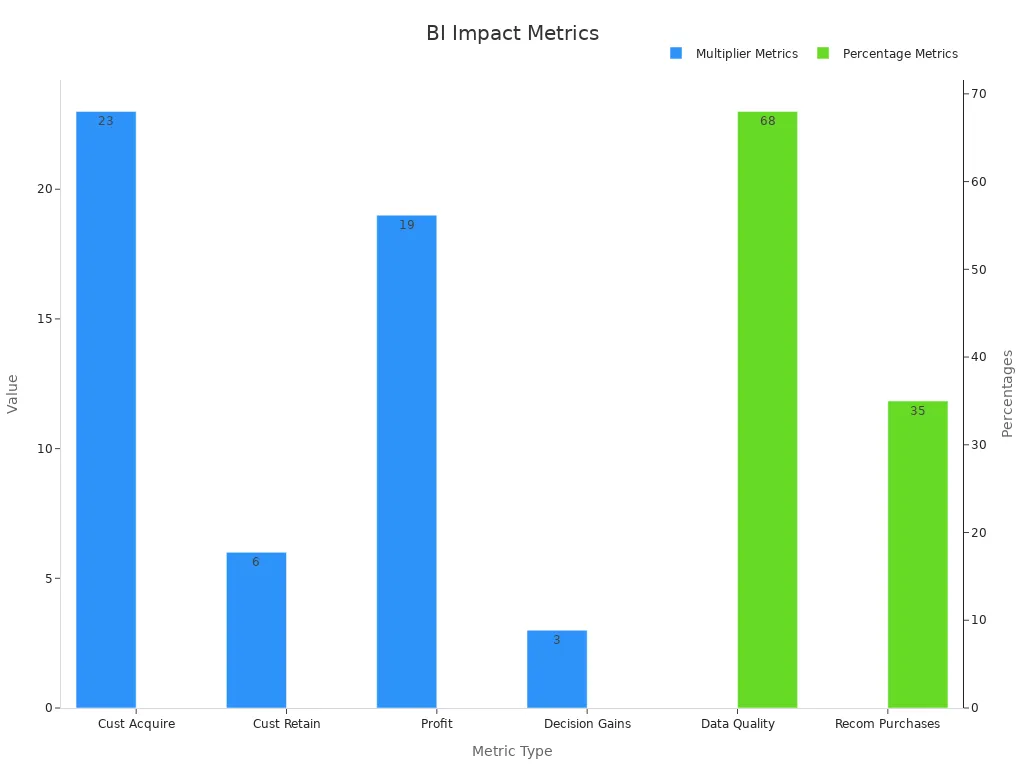
Business intelligence gives you the power to turn raw data into actionable insights for your business. You use business intelligence to analyze trends, identify opportunities, and improve your decision-making process. In today’s fast-paced business world, organizations that rely on business intelligence gain a significant edge. Companies that use modern business intelligence are 23 times more likely to acquire customers and 19 times more likely to be profitable, according to recent surveys.
| Metric Description | Numerical Evidence |
|---|---|
| Likelihood to acquire customers | 23 times more likely |
| Likelihood to retain customers | 6 times more likely |
| Likelihood to be profitable | 19 times more likely |
| Improvement in data quality scores | 68% higher data quality scores |
Your business can use business intelligence to improve data quality, increase efficiency, and build a strong foundation for growth.
You may hear the term business intelligence often, but what does it really mean? Business intelligence refers to the use of technology, processes, and strategies to turn raw data into useful information for your business. The concept dates back to 1865, when Richard Millar Devens first described how a banker used data to gain an advantage. Over time, business intelligence evolved from simple manual methods to advanced computer systems. In 1958, IBM researcher Hans Peter Luhn described business intelligence as a way to collect and share information to help people make better decisions. Today, you use business intelligence to gather, analyze, and act on data quickly and efficiently.
Modern business intelligence tools combine several elements. These include data integration, analytics, and visualization. You can connect to many data sources, process large amounts of information, and create reports or dashboards that show trends and patterns. ScienceDirect defines business intelligence as a set of methods and technologies that transform raw data into meaningful insights. This helps you understand your business better and make smarter choices.

Tip: Business intelligence tools like FineBI allow you to connect to different databases, clean your data, and build dashboards—all without needing to write code.
Business intelligence matters because it helps you make informed decisions. When you use business intelligence tools, you can spot trends, track performance, and respond to changes faster than your competitors. You do not have to rely on guesswork. Instead, you use real data to guide your actions.
Industry studies show that business intelligence improves how your business operates. Organizations that use business intelligence report higher returns on investment, better efficiency, and more accurate decisions. For example, one industry report found that integrating business intelligence infrastructure leads to stronger capabilities and reliability. This means you can trust the insights you get from your data, which gives your business a real edge.
Business intelligence also supports growth and innovation. You can identify new opportunities, improve customer experiences, and streamline your operations. As your business grows, business intelligence tools help you manage more data and keep your strategies on track.
Business intelligence is not just for large companies. Any business can benefit from using these tools. When you use business intelligence, you build a strong foundation for success in a data-driven world.
Business intelligence works through several key components that help you turn raw data into valuable insights. You start with data collection, where you gather information from different sources. Next, you use data integration to bring all this information together. After that, analytics tools help you explore and analyze the data. Finally, visualization tools let you see trends and patterns in easy-to-understand charts and dashboards. Modern business intelligence tools, like FanRuan’s FineBI, combine these steps into a single platform. This approach makes data analysis and reporting faster and more accurate.

Data integration is the process of combining data from many sources into one unified view. You might have information stored in databases, spreadsheets, or cloud services. FineBI makes it easy to connect to over 60 types of data sources, including big data platforms and APIs. With FineDataLink, you can automate ETL (Extract, Transform, Load) and ELT processes. This means you can clean, transform, and synchronize your data in real time. As a result, you get high-quality data ready for analysis. FanRuan has completed over 92,000 projects worldwide, showing how effective their data integration and analytics solutions are for real businesses.

Analytics and visualization help you make sense of your data. With FineBI, you can use drag-and-drop features to build dashboards and reports without coding. Real-time analytics let you spot issues or opportunities as soon as they happen. The table below shows how real-time visual monitoring outperforms manual or periodic methods:
| Anomaly Detection Method | Response Time | Detection Accuracy | Resource Requirements |
|---|---|---|---|
| Manual Report Analysis | Hours to Days | Medium | High (analyst time) |
| Periodic Automated Alerts | Hours | Medium-High | Medium |
| Real-Time Visual Monitoring | Seconds to Minutes | Very High | Low (after setup) |
Real-time analytics and visualization speed up your decision-making. You can reduce response times from hours to minutes. This is important as the amount of data grows worldwide. By using business intelligence tools like FineBI, you gain a clear advantage in data analysis, data reporting, and business performance.

You make better decisions when you use business intelligence. These tools give you actionable insights based on real data, not just guesses. FineBI helps you see trends and patterns quickly. You can spot problems before they grow and find new opportunities for your business. When you have access to clear analysis, you can guide your team with confidence. Business intelligence supports every department, from sales to operations, by providing the right information at the right time. This means you can react faster to changes in the market and stay ahead of your competitors.
Business intelligence increases efficiency across your organization. You save time by automating data collection and analysis. FineBI lets you build dashboards and reports without waiting for IT support. You can focus on what matters most—making decisions and taking action. Many leading companies use business intelligence to streamline their operations:
Here is a table showing how different organizations benefit from business intelligence:
| Company/Institution | Industry | BI-Driven Efficiency Gain |
|---|---|---|
| General Electric (GE) | Manufacturing | 30% reduction in equipment downtime |
| Toyota | Manufacturing | 25% reduction in production inefficiency |
| MIT | Education | 10% increase in graduation rates |
| Stanford University | Education | 15% increase in research publications |
You can see the impact of business intelligence in many industries. For example, Lotte.com used customer behavior analysis to reduce shopping cart abandonment and increased sales by $10 million. Cementos Argos improved profitability by standardizing finance processes with actionable insights. Baylis & Harding used real-time dashboards for financial and sales data, making proactive decisions easier. Sabre Airline Solutions created executive dashboards for near real-time insights, leading to higher revenue and client satisfaction.
FanRuan’s FineBI empowers you to perform self-service analytics, collaborate with your team, and access real-time insights. You can turn raw data into actionable results, helping your business grow and succeed.

When you implement business intelligence solutions, you may face several common challenges. Many organizations struggle with data scattered across different systems, which leads to quality and integration problems. You might also see low user adoption if employees feel unfamiliar with new tools or worry about changes to their workflow. Sometimes, business intelligence projects fail because the results do not match your company’s goals. Research shows that these issues often cause BI initiatives to fall short.
Tip: You can overcome these challenges by setting clear goals, involving users early, and focusing on actionable insights.
You can boost your chances of success by following proven best practices. Start by mastering integrated BI tools like FineBI, FineReport, and FineDataLink. These tools help you bring together data from many sources, ensuring reliable information for your business. Self-service analytics let non-technical users explore and create reports on their own. Interactive dashboards make real-time analysis easy and support quick decision-making.

FanRuan’s FineBI addresses the most common BI implementation challenges. FineBI breaks down data silos by connecting to over 60 data sources, including big data platforms and cloud services. You can automate data integration and cleansing, which improves the quality of your analysis. FineBI’s self-service features empower business users to perform analytics without waiting for IT support. The platform offers role-based access control and strong data governance, so you can manage permissions and protect sensitive information.
You can also use FineDataLink to streamline complex integration tasks and ensure your data is always up to date. FineBI’s intuitive interface and collaborative dashboards make it easy for teams to share insights and drive business growth. By following these steps and leveraging FineBI’s strengths, you set your organization up for BI success.
Business intelligence gives you the power to drive growth and agility in your organization. You use actionable insights to spot trends, make bold moves, and stay ahead in a changing market. Research shows that business intelligence and analytics help you innovate, act quickly, and reduce costs. FanRuan’s FineBI makes actionable business insights easy to access and use. You can build a culture that values learning, innovation, and proactive business decisions.
| Construct | Key Indicators Summary |
|---|---|
| Data-Driven Culture | Treating data as an asset; decisions based on data; continuous improvement of decision processes. |
| Innovativeness | Promotion of novel products; openness to innovation; support for creative problem-solving. |
| Pro-activeness | Initiating actions before competitors; anticipating market changes; prioritizing new projects. |
| Risk-Taking | Preference for bold actions; willingness to venture into unknown; acting boldly under risk. |
When you choose modern business intelligence tools, you give your team the actionable insights needed to thrive in today’s world.
Click the banner below to experience FineBI for free and empower your enterprise to convert data into productivity!

작성자
Seongbin
FanRuan에서 재직하는 고급 데이터 분석가
관련 기사

2026년 AI 툴 추천 12선: 업무 효율 높이는 기능·가격·활용 시나리오 비교
AI 도구는 이제 단순한 $1 보조 수단이 아니라, 문서 작성부터 회의 정리, 검색, 디자인, 자동화, 개발 협업까지 업무 방식 자체를 바꾸는 핵심 인프라가 되고 있습니다. 하지만 시장에 도구가 너무 많아지면서 “무조건 유명한 툴”보다 “우리 업무에 맞는 툴”을 고르는 일이 더 중요해졌습니다. 이 글에서는 2026년 기준으로 실무에 바로 적용하기 좋은 $1 12가지를 기능, 가격, 활용 시나
Seongbin
2026년 6월 03일
AI 솔루션 ROI 계산법 7단계: 경영진을 설득하는 비용 대비 효과 산정 가이드
기업이 $1 도입을 검토할 때 가장 자주 부딪히는 질문은 단순합니다. “그래서, 돈이 얼마나 들고 얼마나 남는가?” 현업 담당자는 기술 가능성을 보고, IT 부서는 구현 난이도를 보고, 경영진은 결국 투자 대비 효과 를 봅니다. 아무리 모델 성능이 뛰어나도 사업 성과로 연결되지 않으면 예산 승인을 받기 어렵습니다. 반대로 기대효과를 숫자로 명확히 설명하면 도입 논의는 훨씬 빨라집니다. 특히
Seongbin
2026년 5월 28일

AI 플랫폼 선택법: 기능보다 먼저 봐야 할 7가지 체크포인트
$1을 검토할 때 많은 기업이 가장 먼저 보는 것은 데모 화면, 생성형 기능, 자동화 범위 같은 “보이는 기능”입니다. 하지만 실제 도입 성패는 기능 목록보다 더 앞단에서 갈립니다. 우리 회사의 문제를 얼마나 정확히 정의했는지 , 데이터와 보안 요건을 감당할 수 있는지 , PoC 이후 운영까지 이어질 구조인지 가 훨씬 중요합니다. 특히 최근에는 대화형 업무 지원, $1, 보고 자동화, 생성형
Seongbin
2026년 5월 28일


