A daily report gives you a clear record of what happens in your company in Malaysia each day. You can use it to track important business data, spot trends, and make decisions faster. Companies that use daily reports see higher productivity and profits, with 98.6% of executives aiming for a data-driven culture.
When you rely on detailed reports, your company gains transparency and better performance. Tools like FineReport from FanRuan help your company in Malaysia automate these reports, saving time and reducing errors.
Key Takeaways
- Daily reports record key activities and results each day, helping businesses stay organized and informed.
- Using daily reports improves accountability by tracking who does what and recognizing achievements.
- Daily reports support faster, better decisions by providing up-to-date data and spotting trends early.
- Regular reporting boosts efficiency by highlighting areas for improvement and aligning teams with goals.
- Daily reports motivate teams by showing progress, setting clear goals, and enabling quick feedback.
- Clear, well-structured reports with essential data and visuals make information easy to understand.
- Automating daily reports with tools like FineReport saves time, reduces errors, and keeps data current.
- Reviewing and giving feedback on daily reports drives continuous improvement and business growth.
Daily Report Overview
Definition
A daily report is a document that records the key activities, results, and issues in your company in Malaysia each day. You use it to capture important data, such as sales numbers, project updates, or resource usage. This report gives you a clear view of what happens in your company in Malaysia, helping you stay informed and organized.
Many companies in different industries rely on daily reports. For example, in healthcare, you might track patient satisfaction, waiting times, and treatment costs. In logistics, you can monitor shipping success rates and warehouse costs. These reports help you see patterns and make better decisions for your company in Malaysia.
Tip: When you use daily reports, you create a habit of tracking progress and spotting problems early. This habit can make your company in Malaysia more efficient and successful.
Purpose
You use a daily report to support your company's goals and improve performance. The main purpose is to give you and your team up-to-date information. This information helps you make quick decisions, solve problems, and keep everyone on the same page.
Here are some reasons why your company in Malaysia needs daily reports:
- Track progress on projects and tasks.
- Monitor key performance indicators (KPIs) like sales, costs, or customer satisfaction.
- Communicate updates between departments.
- Identify issues before they become bigger problems.
- Support accountability by showing who did what each day.
Industry benchmarks show that regular reporting helps you refine your strategies. You can compare your company's numbers to industry standards, such as sales revenue or customer retention rates. This process lets you see where your company in Malaysia stands and where you need to improve.
Types
You can find many types of daily reports in a company. Each type serves a different purpose and audience. Here are some common examples:
- Daily sales report: Tracks sales numbers, product performance, and reasons for returns. This report helps your company in Malaysia adjust sales strategies and improve customer satisfaction.

- Production report: Used in manufacturing to monitor costs, output, and machine efficiency. It helps your company in Malaysia spot trends and boost productivity.
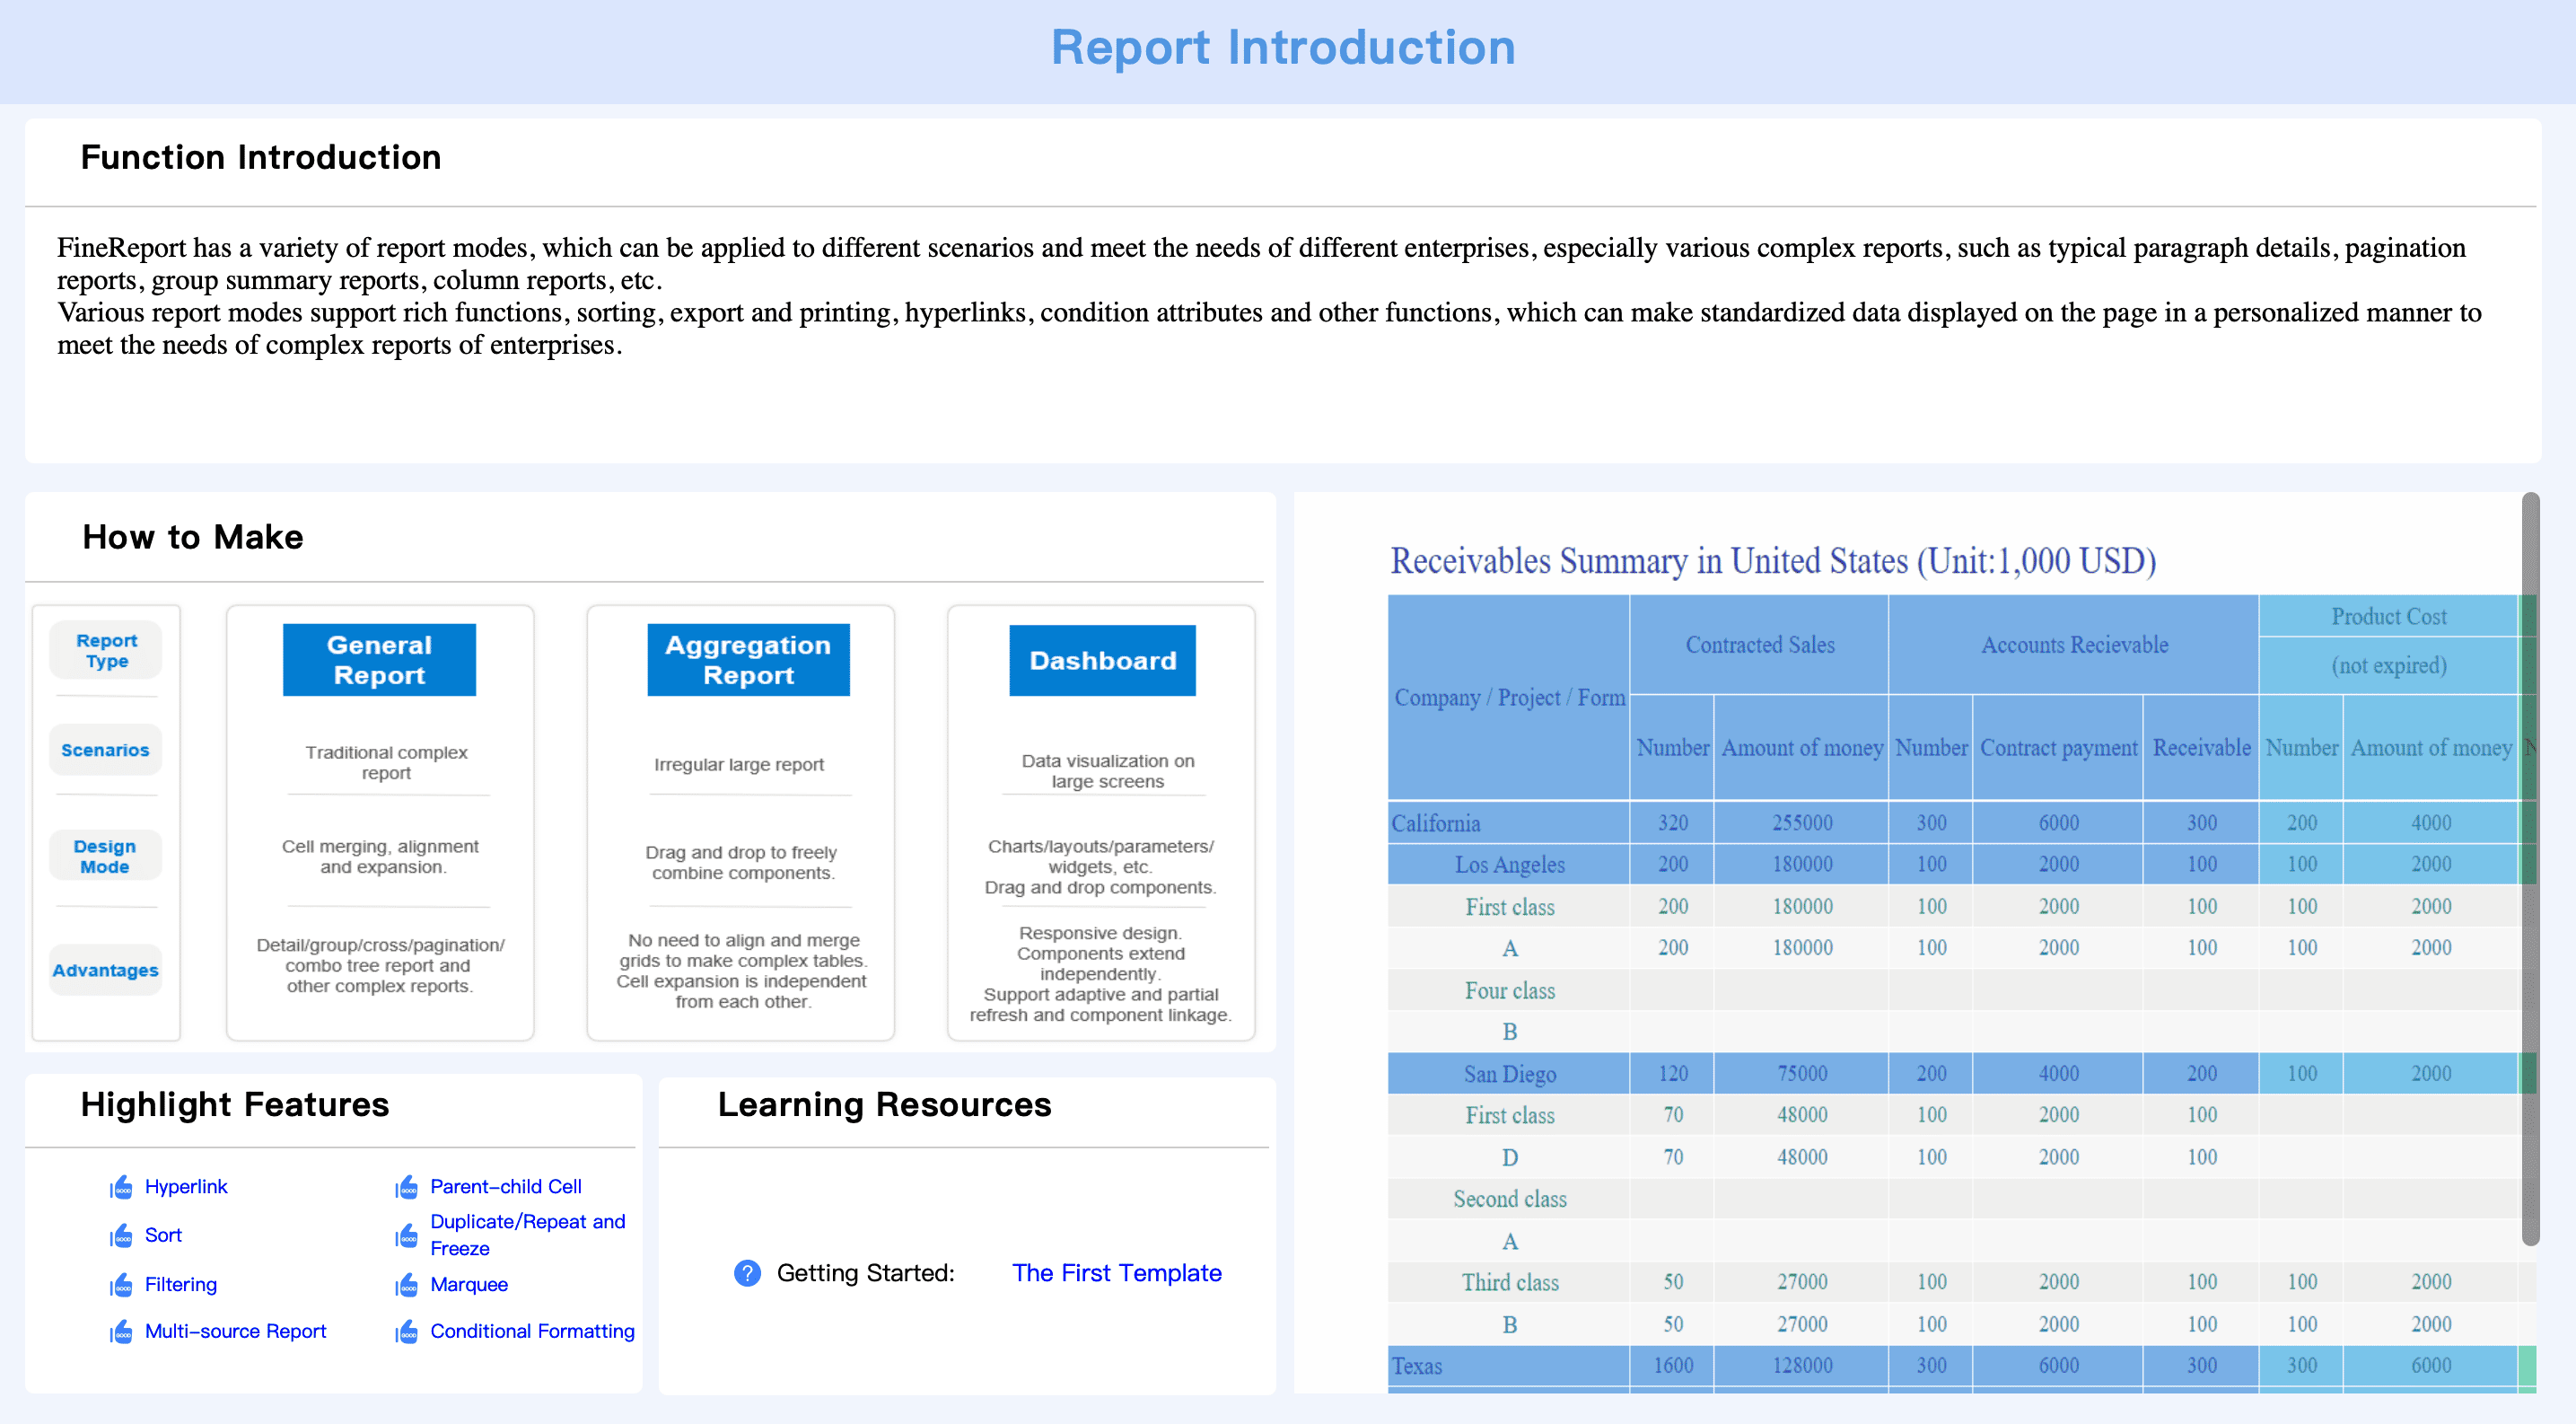
Warehouse KPI dashboard: In logistics, this report tracks order accuracy, shipping rates, and warehouse expenses. It helps your company in Malaysia optimize operations.
KPI Dashboard Created by FineReport - Patient satisfaction report: In healthcare, this report measures waiting times and treatment quality. It helps your company in Malaysia allocate resources and improve service.
- External client report: In IT, you use this report to update clients on project status, deadlines, and budgets. It keeps your company in Malaysia transparent and builds trust.
According to a Deloitte survey, half of all managers feel unhappy with the speed and quality of report delivery. This shows that better reporting tools can make a big difference in your company in Malaysia.
You can use daily reports for many purposes, such as sharing information, tracking progress, coordinating teams, and meeting external requirements. By choosing the right type of report, you help your company in Malaysia stay focused and competitive.
Benefits
Accountability
Daily reports help you build a culture of accountability in your company in Malaysia. When you ask your team to submit a report every day, you make sure everyone knows what is expected. Each person records their actions, results, and any issues they face. This habit keeps your team focused and responsible for their work.
You can use these reports to track who completed tasks and who needs support. Managers can quickly spot gaps or delays. If someone misses a deadline, you see it right away and can offer help or adjust plans. This process prevents problems from growing and keeps your company in Malaysia moving forward.
A daily report also helps you recognize achievements. When you see progress in the report, you can celebrate wins and motivate your team. This recognition boosts morale and encourages everyone to keep performing at their best.
Tip: Use daily reports to set clear goals and review progress. This approach helps your company in Malaysia stay on track and reach targets faster.
Decision-Making

You make better decisions when you have accurate, up-to-date information. A daily report gives you a snapshot of your company’s performance. You can see trends, spot issues, and act before problems get worse. This quick access to data helps you respond to changes in the market or within your company in Malaysia.
Many leading companies use daily reports to guide their choices. For example, Red Roof Inn used flight cancellation and weather data to target stranded travelers, which led to a 10% increase in hotel check-ins. Netflix relies on user behavior data from daily reports to decide which shows to produce, resulting in hits like House of Cards. Google reviews daily managerial performance data to improve productivity, while Coca-Cola uses social media reports to personalize ads and boost clickthrough rates by four times. Uber tracks real-time ride data to match supply with demand, improving service for both drivers and riders.
| Company | Data Used | Decision-Making Improvement | Quantitative Outcome |
|---|---|---|---|
| Red Roof Inn | Flight cancellation and weather data | Targeted marketing to stranded passengers near airports | 10% increase in hotel check-ins |
| Netflix | User behavior data (plays, ratings, searches) | Content greenlighting based on predictive analytics | Successful hits like House of Cards |
| Managerial performance reviews and surveys | Identified key managerial behaviors to improve productivity | Defined top 8 behaviors of great managers | |
| Coca-Cola | Social media image recognition and sentiment | Personalized ads targeting based on customer data | 4x increase in ad clickthrough rates |
| Uber | Real-time ride and location data | Optimized ride availability and surge pricing | Improved supply-demand matching |
Academic research shows that managers use daily analytics to monitor performance and take corrective action. For complex decisions, they combine these reports with expert advice. This approach improves accuracy and helps your company in Malaysia stay competitive. Another study found that well-designed dashboards and daily reports make decisions easier by reducing complexity and increasing satisfaction with the information.
Efficiency
You can boost your company’s efficiency by using daily reports. These reports help you track key business metrics, such as sales, expenses, or customer feedback. When you see this data every day, you can quickly identify areas that need improvement.
- Tracking business metrics gives your company in Malaysia direction for operational improvements.
- You can compare your company’s performance to industry benchmarks and spot over- or underperformance.
- Daily reports keep everyone in your company in Malaysia aligned with shared goals.
- Sharing metrics in reports improves communication with customers, shareholders, and employees.
- Analyzing daily data helps you catch problems early and take action before they grow.
A daily report also supports efficient resource use. For example, you can monitor inventory levels, production rates, or service requests. If you notice a sudden drop in sales or a spike in costs, you can investigate and fix the issue right away. This quick response saves your company in Malaysia time and money.
| Aspect | Details |
|---|---|
| KPI Purpose | Measure progress toward goals and support data-driven decisions |
| Benefits of Tracking KPIs | Clarity and focus, performance tracking, informed decision-making, accountability |
| Operational KPIs | Provide detailed, timely info for daily decisions and corrective actions |
| Examples of Operational KPIs | Accounts Receivables Turnover, Days Sales Outstanding, Operating Cash Flow |
| Reporting Frequencies | Live (real-time), Daily (operational KPIs), Weekly, Monthly, Quarterly, Biannual, Annual |
| Daily Reporting | Common for operational KPIs, offers snapshots of daily performance trends for quick action |
| Presentation Tools | Dashboards for real-time monitoring; KPI reports for in-depth analysis and strategic review |
Note: When you use daily reports, you make your company more agile. You can adapt to changes quickly and keep your business running smoothly.
Motivation
Daily reports do more than track numbers. They help you build a motivated team in your company in Malaysia. When you see your progress each day, you feel a sense of achievement. This feeling pushes you to do better and reach new goals. Your company in Malaysia benefits when everyone feels inspired to improve.
You can use daily reports to set clear targets for your team. When you know what your company expects, you work with more focus. You see your results and understand how your work fits into the bigger picture. This connection between effort and outcome keeps you engaged.
Managers in your company in Malaysia can use daily reports to give feedback. When you finish a task, your manager can see it right away. You get praise for good work or advice if you need to improve. This quick feedback helps you grow and stay on track. Your company in Malaysia becomes a place where people want to do their best.
Tip: Celebrate small wins in your daily report. When your company in Malaysia recognizes these wins, you feel valued and want to keep performing well.
A daily report also helps your company spot top performers. You can see who meets goals and who goes the extra mile. Your company can reward these employees, which boosts morale for everyone. When you know your hard work gets noticed, you feel more loyal to your company in Malaysia.
Here are some ways daily reports motivate you and your team in your company in Malaysia:
- You see your progress and feel proud of your work.
- Your company sets clear goals, so you know what to aim for.
- Managers in your company in Malaysia give fast feedback, helping you improve.
- Your company rewards good performance, making you feel appreciated.
- You feel part of a team that works toward shared goals.
A motivated team helps your company in Malaysia grow. When you use daily reports, you create a culture where everyone wants to succeed. Your company in Malaysia becomes stronger, more productive, and ready to face new challenges.
Daily Report in Business Operations in Malaysia
Performance Tracking
You need to know how your company in Malaysia performs each day. A daily report gives you a clear view of your progress. You can track sales, production, or service quality. This helps you see if your company meets its goals. Many companies use daily reports to measure key metrics. For example, in manufacturing, you can track equipment setup time and error rates. One study showed that companies reduced equipment setup time by 33% and cut documentation errors from 5% to 1.5% after using daily reports. Your company in Malaysia can use these numbers to spot trends and make quick changes.
Industry best practices show that standardized daily reports help you compare results over time. You can use tools like FineReport from FanRuan to automate this process. FineReport lets you collect data from different sources and create easy-to-read dashboards. This makes it simple for your company in Malaysia to monitor performance and share results with your team.
Communication
Clear communication keeps your company in Malaysia running smoothly. Daily reports help you share updates between teams and departments. When everyone sees the same information, you avoid confusion and mistakes. For example, companies that use daily reports during Gemba Walks improved on-time delivery rates from 75% to 92%. They also reduced setup times and errors. In healthcare, daily reporting increased operating room use by up to 20% and improved scheduling.
| Key Performance Indicator | Before Implementation | After Implementation |
|---|---|---|
| Equipment Setup Time | 45 minutes | 30 minutes |
| Documentation Error Rate | 5% | 1.5% |
| On-time Delivery Rate | 75% | 92% |
FineReport supports your company in Malaysia by making it easy to share reports on any device. You can send updates to managers, staff, or clients. This keeps everyone informed and helps your company in Malaysia respond quickly to changes.
Tip: Use daily reports to keep your company in Malaysia aligned. When everyone knows the latest results, your company in Malaysia can solve problems faster.
Risk Management
Every company faces risks. You need to spot problems early to protect your business. Daily reports help you track issues and respond before they grow. Risk Management Units in many industries rely on daily data to find and fix risks. They use tools like Tracking Error and Value-at-Risk to measure risk and keep your company in Malaysia safe.
Industry studies confirm that daily reports are essential for risk management. Regulatory groups like the FDA and EMA recommend daily reporting to catch problems early. Your company can use FineReport to automate risk tracking. FineReport collects and analyzes risk data, then sends alerts to the right people. This helps your company in Malaysia act fast and avoid costly mistakes.
Note: A daily report is not just about collecting data. It must give you clear, actionable steps to manage risks and improve your company’s future.
Key Elements of Daily Report
Essential Data
You need to include the right data in your daily report to help your company succeed. When you focus on essential data, you give your team the facts they need to make smart choices. Your company in Malaysia should always include key metrics, such as sales numbers, expenses, and project updates. You can also add customer feedback, inventory levels, or any other data that shows how your company performs each day.
A good report does more than list numbers. It summarizes general facts and highlights exceptions. This approach helps your company in Malaysia understand what is normal and what needs attention. When you present comprehensive data, you prevent misleading conclusions. Your company can see the full picture, not just a few numbers. Managers in your company rely on well-structured reports with essential data to interpret results and make informed decisions. Visual summaries, such as charts or tables, turn raw data into insights your company in Malaysia can use every day.
Tip: Always check that your data is accurate and up to date. Reliable data builds trust in your company and supports better decisions.
Structure
A clear structure makes your daily report easy to read and understand. Your company should organize each report with sections for key activities, results, and issues. Start with a summary that gives an overview of the day. Follow with detailed sections for each department or project in your company in Malaysia. Use bullet points or tables to present data clearly.
Here is a simple structure you can use:
| Section | Purpose |
|---|---|
| Summary | Quick overview of the day’s main points |
| Key Metrics | Sales, expenses, production, or service data |
| Achievements | Completed tasks or goals |
| Issues | Problems or risks your company faces |
| Next Steps | Plans or actions for the next day |
When you use a consistent structure, your company saves time. Everyone knows where to find the information they need. Well-structured reports also help your company compare results over time and spot trends faster.
Note: Visual summaries and clear sections help your company turn data into meaningful insights.
Common Mistakes
Many companies make mistakes when creating daily reports. You can avoid these errors by keeping your report clear and focused. Here are some common mistakes:
- Using complex language or making the report too long. This reduces clarity and makes it hard for your company to understand the results.
- Failing to align the report with your company’s goals. This leads to reports that do not support your business.
- Inconsistent formatting. This makes your report look unprofessional and hard to read.
- Reporting unreliable data. This undermines trust in your company’s reporting process.
- Not encouraging collaboration between departments. This limits the value of your report for your company in Malaysia.
- Poor visual design, such as using the wrong chart types or not using headers. This confuses readers in your company.
- Not using enough whitespace or consistent branding. This makes your report look messy and less professional.
- Disorganized layouts. This makes it hard for your company in Malaysia to find important information.
You can improve your company’s reports by applying a clear typographic hierarchy. Use headers, subheaders, and paragraph text to guide readers. Consistent branding also helps your company look professional and cohesive. Creative use of brand elements can make your company’s reports unique while maintaining consistency.
Tip: Review your report before sharing it. Make sure it is clear, accurate, and easy for your company to use.
FineReport for Daily Reporting in Malaysia
Automation
You want your company in Malaysia to save time and reduce errors. FineReport helps you do this by automating your daily reporting process. You can schedule reports to run at set times, so your team never misses a deadline. The system sends completed reports directly to the right people, whether they are in the office or working remotely. This automation means you spend less time on manual tasks and more time focusing on what matters most for your company in Malaysia.
FineReport also supports automatic data collection. You do not need to gather numbers from different places by hand. The platform pulls data from your systems and updates your report in real time. This keeps your information accurate and up to date. You can trust that your company always has the latest numbers for quick decision-making.
Tip: Use scheduled tasks in FineReport to deliver daily insights to your team before the workday begins.
Integration
Your company likely uses many different systems to store data. FineReport makes it easy to bring all this information together. The platform connects with all mainstream databases and lets you combine data from multiple sources with just one click. This built-in capability means you can analyze sales, inventory, and customer feedback in a single report.

FineReport’s drag-and-drop design lets you build reports quickly, even if you do not have technical skills. You can create a new report or dashboard in as little as 10 minutes. The system supports three different design modes, so you can choose the one that fits your company’s needs. This flexibility helps your company in Malaysia adapt as it grows and changes.
You can also access your reports on any device. FineReport supports mobile access, so you and your team can check results from your phone or tablet. This keeps everyone in your company connected and informed, no matter where they are.
Visualization
You need to see your company’s data in a way that makes sense. FineReport gives you powerful visualization tools to turn raw numbers into clear, interactive charts and dashboards. You can choose from many chart types and customize them to highlight what matters most for your company in Malaysia.
With FineReport, you can build dashboards that show key performance indicators at a glance. The drag-and-drop interface makes it easy to add or change visual elements. You can also use 3D dashboards for a more dynamic view of your company’s operations. These visual tools help you spot trends, track progress, and share insights with your team.
Note: Visual dashboards make it easier for everyone in your company to understand the story behind the numbers.
Creating a Daily Report in Malaysia
Steps
You can create a reliable daily report by following a clear process. Start by deciding what data you need to track. Collect information from your team or systems at the same time each day. Use charts like X and R charts or p-charts to show trends and spot problems. Train your team on how to measure and record data correctly. Make sure everyone uses the same methods so your results stay accurate.
Next, set up a plan for what to do if you see something unusual in your data. Flow charts can help you decide on actions when things go out of control. Keep a control plan that lists who is responsible, what charts to use, and how to measure results. After you collect enough data, calculate control limits to see what counts as normal. Use simple rules to check if your process is stable. If you find a problem, look for the cause and fix it right away. Always compare your results to what your business expects. Keep checking your process every day to make sure you keep improving.
Tip: Use templates and tutorials from tools like EngineRoom or MoreSteam’s SPC toolbox to make these steps easier.
Tools
You have many tools to help you build daily reports. ClearPoint Strategy is a popular platform used by thousands of organizations. It lets you connect real-time data, so your reports always show the latest numbers. You can use ready-made templates or design your own dashboards to fit your business needs. The platform also gives you interactive charts that make your data easy to understand.
Collaboration features let your team work together on reports. Automation saves you time by handling routine tasks, so you can focus on analysis. Strong security keeps your business data safe with features like multi-factor authentication. KPI tracking tools help you watch your most important numbers every day.
Note: Choose tools that match your business goals and make reporting simple for everyone.
Best Practices
You can make your daily reports more effective by following best practices. Always keep your reports clear and easy to read. Use tables and charts to show key points. Make sure your data is accurate and up to date. Set up a routine for collecting and checking information. Share your reports with your team so everyone stays informed.
Customize your reports to match your business needs. Use dashboards to highlight important trends. Encourage your team to give feedback and suggest improvements. Protect sensitive data with strong security settings. Automate as much as possible to save time and reduce mistakes.
| Practice | Benefit |
|---|---|
| Use clear templates | Saves time and reduces errors |
| Automate data collection | Keeps reports up to date |
| Share with your team | Improves communication |
| Track KPIs | Supports business goals |
Remember: Good daily reports help your business stay on track and make better decisions every day.
Maximizing Value
Review
You can get more value from your daily reports by making regular reviews part of your routine. When you review reports, you check for accuracy, spot trends, and make sure your team meets goals. This process helps you catch mistakes early and keeps your business moving in the right direction.
Many leading companies use review systems to improve performance. For example, HSBC uses a digital HR app that tracks performance in real time. This tool lets you review progress every day, not just at the end of the year. You can see what works, what needs fixing, and how your team is doing. Regular reviews also help you keep your reports fair and unbiased. When you review daily, you build trust and make better decisions.
Tip: Set a specific time each day to review your reports. This habit helps you stay organized and focused.
Feedback
Feedback turns your daily reports into powerful tools for growth. When you give and receive feedback, you help your team learn and improve. You can use feedback to recognize good work, fix problems, and encourage new ideas.
FedEx shows how feedback can change a company’s culture. The company moved from just looking at numbers to having real conversations. Managers now coach employees and talk about what went well and what could be better. This approach builds teamwork and keeps everyone engaged. HSBC also uses feedback to support fairness and teamwork. Their app lets you ask for feedback from anyone, not just your boss. This open system helps you learn from different people and grow faster.
You can make feedback part of your daily routine by:
- Asking your team what worked well and what did not.
- Sharing positive results and celebrating wins.
- Offering advice when you see areas for improvement.
- Encouraging everyone to share their thoughts.
Note: Feedback works best when it is honest, specific, and focused on actions, not people.
Continuous Improvement
You can drive your business forward by using daily reports for continuous improvement. When you track key metrics every day, you spot patterns and find ways to get better. This process helps you make small changes that add up to big results over time.
Companies that use continuous improvement strategies see real benefits. For example, tracking and analyzing daily data can lead to higher productivity, fewer mistakes, and lower costs. The table below shows how these strategies can impact your business:
| Improvement Area | Statistical Impact Range | Explanation |
|---|---|---|
| Productivity Gains | 20-30% increase | Streamlined workflows boost output. |
| Defect Reduction | Up to 40% decrease | Better quality control lowers errors. |
| Cost Savings | 15-25% reduction | Smarter resource use cuts expenses. |
| Resource Utilization | 30-40% improvement | Data analysis helps use materials and labor more efficiently. |
| Risk Exposure Reduction | Up to 35% decrease | Early warnings prevent downtime and safety issues. |
You can use tools like statistical process control charts to watch for changes in your data. When you see a problem, you can act fast to fix it. Tracking metrics like Net Promoter Score (NPS) also helps you measure customer satisfaction and loyalty. By making improvement part of your daily routine, you keep your business strong and ready for growth.
Remember: Continuous improvement is not a one-time project. It is a daily habit that helps your business succeed.
Daily reports help you build accountability, make better decisions, and improve efficiency in your business in Malaysia. When you track KPIs and share clear visual data, you empower your team to act quickly and stay motivated.
- Regular reporting lets you spot trends, benchmark against competitors, and support strategic planning.
- Modern tools like FineReport from FanRuan-en offer real-time dashboards, drag-and-drop design, and seamless integration for any industry.
Upgrade your daily reporting process to unlock faster insights and stronger results. Explore FineReport to see how you can transform your business operations.
Click the banner below to try FineReport for free and empower your enterprise to transform data into productivity!

Continue Reading About Daily Report


FAQ

The Author
Lewis
Senior Data Analyst at FanRuan
Related Articles

Financial Reporting Valuation Explained: A Practical Guide to ASC 820, ASC 805, ASC 350, and ASC 718
$1 valuation is the process companies use to measure assets, liabilities, equity instruments, and reporting units for compliant $1. For CFOs, controllers, finance directors, and audit facing accounting teams, the challen
Yida Yin
Jun 25, 2026

Best Ad Reporting Tool in 2026: 8 Options Compared for Marketers and Analysts
$1 is an $1 and dashboard platform that helps teams unify ad data, build highly customized reports, and automate distribution at scale. 8 ad reporting tool options compared 1. DashThis One sentence overview: DashThis is
Yida YIn
Jun 25, 2026
Office 365 Reporting Tool Guide: Track Usage, Security, and License Waste in One Dashboard
An office 365 $1 should do more than generate static usage charts. For IT managers, operations leaders, and Microsoft 365 administrators, the real value is operational visibility: who is actually using the platform, wher
Yida Yin
Jun 25, 2026