If you run a large enterprise with complex legacy systems, Crystal Report often fits best as your reporting tool. For organizations in Malaysia seeking modern, scalable BI solutions, FineReport stands out. Choosing the right reporting software shapes how you manage data, streamline operations, and drive business growth in Malaysia.
- AI-powered reporting software automates tasks, boosts decision-making, and uncovers trends, supporting faster, more efficient BI processes.
- Flexible BI platforms enhance scalability, reduce costs, and reveal new opportunities.
FanRuan’s FineReport delivers a flexible, cloud-ready solution trusted by global businesses to power their BI and reporting needs in Malaysia.
Key Takeaways
- FineReport offers modern, flexible BI tools with easy drag-and-drop design and supports over 500 data sources for real-time, automated reporting.
- Crystal Report excels in detailed, pixel-perfect reports and strong integration with legacy systems but has a steeper learning curve and limited cloud support.
- Choose reporting software based on your data sources, user skills, deployment needs, and collaboration features to match your business goals in Malaysia.
- Modern BI tools like FineReport improve decision-making with interactive dashboards, mobile access, and advanced visualization options.
- Avoid common mistakes like data overload and poor report customization by balancing report frequency and tailoring reports to your team’s needs.
Quick Comparison: Crystal Report or FineReport
Summary Table
Here is a concise comparison of Crystal Report and FineReport. This table highlights the core features you should consider when choosing the right reporting software for your business in Malaysia.
| Feature | Crystal Report | FineReport by FanRuan |
|---|---|---|
| Formatting | Advanced pixel-perfect formatting | Highly customizable, Excel-like design |
| Visualization | Basic charts and graphs | 100+ interactive charts, 3D dashboards |
| Visualisation | Limited interactivity | Dynamic, responsive, and mobile-ready |
| Data Integration | Strong with SAP and legacy systems | 500+ sources, real-time, cloud-ready |
| BI Capabilities | Traditional BI, static reports | Modern BI, dynamic dashboards |
| Reporting Capabilities | Fixed, scheduled, and ad-hoc reports | Automated, real-time, and mobile reports |
| Analysis | Static, requires IT intervention | Self-service, interactive, real-time |
| Deployment | On-premises focus | Cloud, on-premises, hybrid |
| Cost | License-based, higher TCO | Flexible pricing, scalable for growth |
| User Experience | Developer-centric, steep learning curve | Intuitive, drag-and-drop, low-code |
| Software Integration | Integrates with SAP, ERP | Integrates with ERP, CRM, SaaS, APIs |
| Mobile BI | Limited | Full-featured, responsive |
| Collaboration | Basic | Advanced, permission control |
Tip: Use this table to quickly identify which reporting tool aligns with your current and future BI needs.
Key Differences
When you compare Crystal Report and FineReport, you notice several important differences that impact your BI strategy and daily operations:
- Modern BI and Visualization
FineReport gives you access to advanced visualisation and interactive dashboards. You can create 3D dashboards and use over 100 chart types. Crystal Report offers basic visualization, which may not meet the needs of modern BI projects. - Data Integration and Connectivity
FineReport connects to more than 500 data sources, including cloud platforms and real-time databases. You can integrate data from multiple systems without complex setup. Crystal Report focuses on legacy and SAP integration, which limits flexibility for growing businesses in Malaysia. - Reporting Capabilities and Automation
FineReport automates reporting tasks, supports real-time data updates, and delivers reports to any device. You can schedule, distribute, and customize reports with ease. Crystal Report provides fixed and scheduled reporting but lacks the automation and mobile BI features you find in FineReport. - User Experience and Learning Curve
FineReport uses an Excel-like, drag-and-drop interface. You can build reports without deep technical skills. Crystal Report requires more technical expertise and has a steeper learning curve, which can slow down your reporting projects. - Deployment and Scalability
FineReport supports cloud, on-premises, and hybrid deployment. You can scale your BI solution as your business grows in Malaysia. Crystal Report mainly supports on-premises deployment, which may increase costs and limit scalability. - Cost and Total Ownership
FineReport offers flexible pricing and lower total cost of ownership. You can start small and expand as needed. Crystal Report uses a license-based model, which often results in higher upfront and ongoing costs. - Collaboration and Security
FineReport provides advanced collaboration features, including permission control and secure sharing. You can manage user access and ensure data security across your organization. Crystal Report offers basic collaboration, which may not support complex BI environments.
Note: If you want a reporting software that grows with your business in Malaysia and supports modern BI, FineReport stands out as a future-ready tool.
Crystal Report Overview
Features
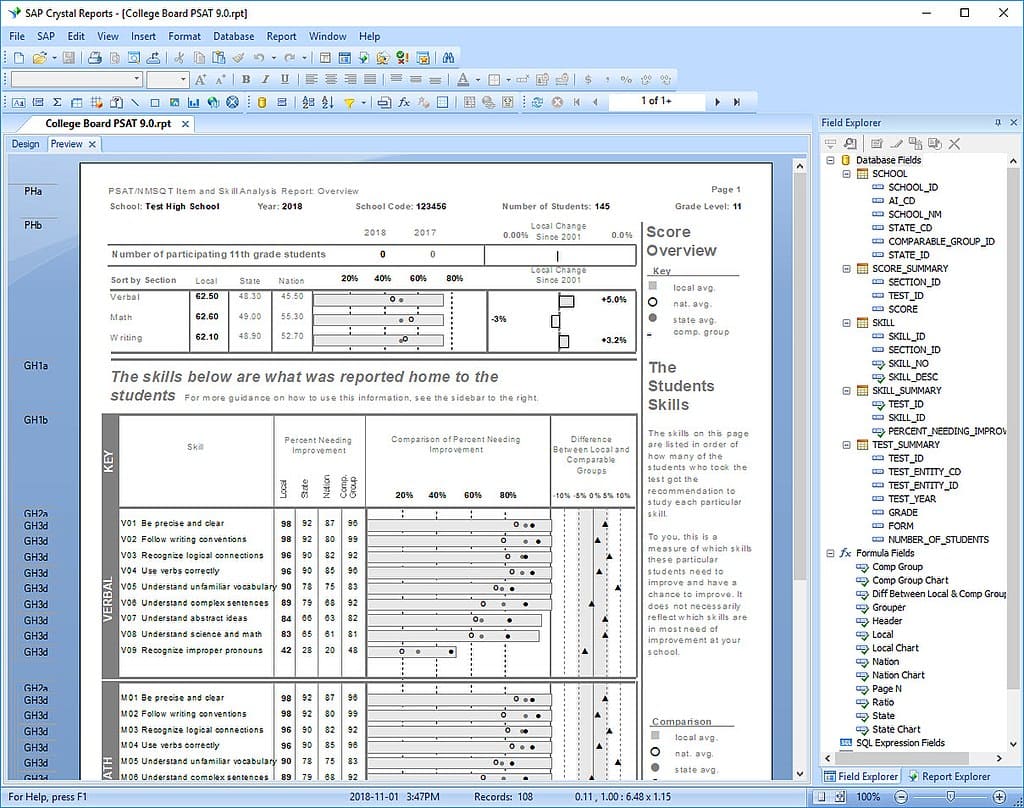
When you use crystal report, you gain access to a robust management reporting tool that has served businesses for decades. You can design pixel-perfect documents and generate detailed data summaries. Crystal report supports a wide range of data sources, including SQL databases, Excel files, and enterprise systems. You can create static or parameterized reports, schedule automated deliveries, and export results in multiple formats. The tool offers advanced formatting options, letting you control every detail of your report layout. You also benefit from built-in formulas and conditional formatting, which help you highlight key data points.
Strengths
Crystal report stands out for its reliability and deep integration with legacy systems. If your organization relies on SAP or other enterprise platforms, you will find crystal report especially useful. The software handles large volumes of data efficiently, making it ideal for complex financial or operational reporting. You can trust its security features to protect sensitive information. Many IT teams appreciate the flexibility to customize reports using scripting and formulas. Crystal report also provides strong support for scheduled reporting, so you can automate routine data tasks and ensure timely delivery.
Tip: If you need a stable solution for traditional reporting and have experienced IT staff, crystal report remains a solid choice.
Limitations
You may encounter challenges if you want to scale or modernize your reporting environment. Crystal report focuses on on-premises deployment, which can limit your ability to access data remotely or support mobile users. The learning curve is steep, especially if you lack technical expertise. You might find it difficult to integrate new cloud-based data sources or automate real-time analytics. While crystal report excels at static reporting, it does not offer the interactive dashboards or advanced visualization features found in newer tools. As your data needs grow, you may need to consider more flexible solutions.
FineReport by FanRuan in Malaysia
Features
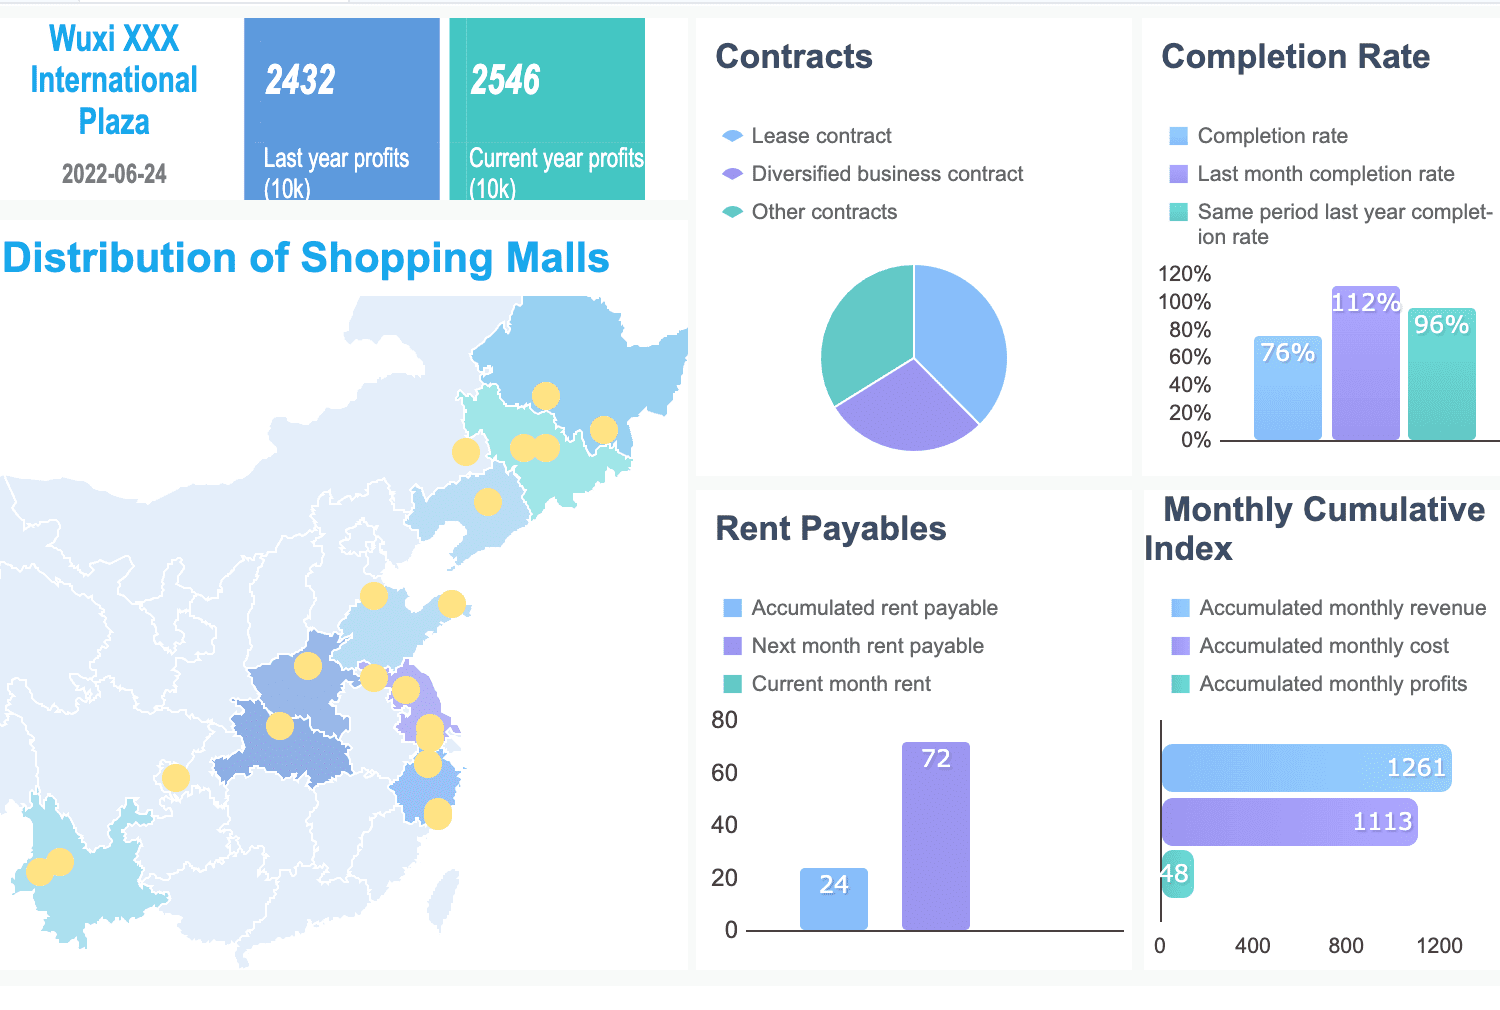
You gain access to a powerful suite of tools with FineReport. The drag-and-drop interface lets you build complex reports without writing code. You can connect to multiple data sources, including SQL databases, Excel, and cloud services, making data integration seamless. FineReport offers interactive dashboards with filters, drill-downs, and real-time updates, so you always see the latest data. You can choose from advanced charting options like bar, line, pie, heat maps, and radar charts to enhance your data visualisation capabilities. The platform supports mobile compatibility, allowing you to access reports on any device. Automated scheduling ensures you never miss a report deadline, and collaboration tools let your team share, comment, and co-develop reports. FineReport also provides strong data security with role-based access control and encryption.

FineReport’s dynamic data visualisation and real-time analytics features help you uncover insights quickly and make smarter decisions.
Advantages
You benefit from FineReport’s adaptability and scalability in any business intelligence application. The platform, built on Java, integrates easily with your existing systems, whether you deploy it independently or embed it. You can handle large data volumes and diverse business needs in Malaysia thanks to support for multiple data sources. The interactive dashboards and over 50 styles of HTML5 charts—including 3D and dynamic effects—let you customize your data visualisation capabilities. Widgets for data entry, validation, and submission adapt to complex business operations in Malaysia. The mobile app supports data analysis, parameter queries, and offline viewing, so you stay connected wherever you are.

Use Cases
FineReport fits a wide range of scenarios. You can use it for financial reporting, sales tracking, or operational monitoring. Project teams rely on its tools to deliver reports faster and with fewer errors. IT departments use FineReport for self-service analytics and integration with other enterprise systems. If you need to manage large datasets, automate reporting, or enable real-time collaboration, FineReport gives you the flexibility and insights you need to drive business growth in Malaysia.
To learn more about the FineReport features, you can click on the button below to go to the product guide.
Reporting Software Features: Crystal Report or FineReport in Malaysia
Data Integration

You need seamless data integration to unify information from multiple sources. Modern BI software connects to databases, cloud platforms, and spreadsheets, giving you a real-time view of your business in Malaysia. With advanced integration, you can automate workflows and reduce manual errors.
- Unified, real-time data views across systems
- Automated report generation for efficiency
- Collaboration features for teamwork and sharing
- Mobile access for data anywhere
| Metric Category | Description and Assessment Method |
|---|---|
| Data Integrity and Synchronization Accuracy | Compare data sets from CRM and ERP to identify errors; perform routine audits. |
| Workflow Automation Efficiency | Measure time and resource savings before and after integration; track error reduction. |
| Financial Performance Indicators | Evaluate cost savings, revenue growth, and speed of financial reporting post-integration. |
You gain better insights and faster decision-making with strong data integration.
Visualization
Effective report visualization software transforms raw data into clear, actionable insights. You can use customizable dashboards, interactive charts, and advanced visualisation to present complex information. FineReport, for example, offers over 100 chart types and 3D dashboards, enhancing your data visualisation capabilities.
Visualization tools let you tailor data presentation for different audiences. You can use heat maps, pie charts, and dynamic effects to highlight trends. Real-time analytics and visualisation help you spot issues and opportunities quickly.

User Experience
A great user experience in reporting software means you can build, view, and share reports with ease. Modern BI platforms use drag-and-drop interfaces and templates, making report creation simple for everyone.
| Software | Key Features Relevant to User Satisfaction Measurement | How It Supports User Experience Survey Data |
|---|---|---|
| Displayr | Automated dashboards, text analytics, collaborative editing | Deep analysis of user satisfaction, real-time feedback |
| Tableau | Flexible integration, advanced visualizations, interactive dashboards | Dynamic reports reveal user satisfaction trends |
You benefit from intuitive design, self-service analytics, and real-time collaboration. These features boost productivity and satisfaction.
Deployment
You want flexible deployment options to match your business needs in Malaysia. Elite BI performers deploy software updates and new reports up to 1,460 times per year, keeping systems current and secure.
| Performer Type | Deployment Frequency (per year) | Example Companies |
|---|---|---|
| Elite Performers | ~1,460 | CapitalOne, Amazon, Google, Netflix |
| Low Performers | 7 | N/A |
Frequent deployment supports rapid innovation and reliable BI operations.
Pricing
Pricing models for reporting software vary. You can choose subscription-based, usage-based, or customized enterprise plans.
| Pricing Model | Advantages | Disadvantages |
|---|---|---|
| Subscription-based | Predictable costs, access to updates, scalability | Ongoing fees, possible unused features |
| Usage-based | Pay only for what you use, flexible alignment | Hard to predict costs, risk of spikes |
| Customized Enterprise | Tailored flexibility, potential savings for large organizations | Complex negotiation, higher upfront costs |
Subscription models offer predictable budgeting, while usage-based plans suit variable needs. Customized plans fit large enterprises with specific requirements. You should weigh cost-effectiveness, features, and long-term value when selecting your reporting software.
Crystal Reports vs Power BI
Reporting Capabilities
When you compare reporting capabilities in crystal reports vs power bi, you see clear differences in approach and flexibility. Crystal Reports gives you robust parameter management and supports complex formulas directly within your reports. You can connect to transactional databases without building a separate data model, which streamlines traditional reporting tasks. Power BI, on the other hand, requires you to design a data model with relationships for optimal performance. You use DAX for calculations, which may require rewriting formulas if you migrate from Crystal Reports. Power BI supports scheduled data refreshes and real-time analytics through DirectQuery, but with some feature limitations.
| Performance Metric | Crystal Reports Characteristics | Power BI Characteristics |
|---|---|---|
| Complex Formulas & Calculations | Supports complex formula fields directly in reports | Uses DAX language for complex calculations; requires formula rewriting during migration |
| Data Model Requirements | Connects directly to transactional databases without enforced data model | Requires well-designed data model with relationships for optimal performance |
| Data Refresh & Live Connectivity | Supports real-time or near-real-time data from transactional systems | Supports scheduled refreshes; real-time requires DirectQuery with feature limitations |
| Parameter Management | Robust parameter handling for dynamic filtering before report generation | Uses slicers and filters; parameterized reports are more complex to replicate |
| Complex Data Grouping & Sorting | Allows complex grouping, sorting, and section-based formatting | Grouping and sorting are more visual; less focused on highly formatted, sectioned reports |
| Data Security | User-level security to restrict report portions based on permissions | Implements Row-Level Security (RLS) via roles in data model; requires redesign of security logic |
| Performance Optimization | Direct database pulls can cause performance issues with large datasets | Requires data model optimization, aggregations, and visual complexity management for performance tuning |
| Mobile and Cloud Readiness | Desktop-centric, traditional IT environment | Cloud-first, optimized for mobile access and interactive dashboards |
Data Visualization
Crystal reports vs power bi also differ greatly in data visualization. Crystal Reports focuses on static reports with basic charts and limited interactivity. You can create highly formatted documents, but you may find the visual options restrictive for modern analytics needs. Power BI excels in interactive dashboards and dynamic visualizations. You can use a wide range of chart types, slicers, and drill-down features to explore your data. Power BI integrates with Microsoft products and supports cloud and mobile access, making it ideal for organizations that prioritize real-time analytics and collaboration.
Tip: If you want to empower business users in Malaysia with self-service analytics and interactive dashboards, Power BI offers a more user-friendly experience compared to Crystal Reports.
Business Scenarios
You should consider your business scenario in Malaysia when choosing between crystal reports vs power bi. Crystal Reports works best for organizations that need static, highly formatted reports and have established IT processes. You may prefer it if your team handles complex financial statements or regulatory documents that require precise layouts. Power BI fits businesses that value agility, cloud readiness, and interactive analytics. You can quickly build dashboards, share insights, and adapt to changing data needs. Power BI supports both technical and non-technical users, making it suitable for teams that want to democratize analytics across the organization.
- Crystal Reports offers versatile data connectivity and strong reporting capabilities for traditional IT environments.
- Power BI provides advanced analytics, seamless integration with Microsoft tools, and a lower learning curve for most users.
Use Cases of Crystal Report and FineReport
Small Business in Malaysia
You face unique challenges as a small business owner in Malaysia. You need BI tools that simplify data management and help you compete with larger firms. Many small businesses now turn to BI software for better data analysis and reporting. Recent trends show a sharp rise in AI and BI adoption.
- AI adoption among businesses jumped from 22% in 2021 to 35% recently, a 64% increase.
- Since 2016, AI usage in small businesses in Malaysia has grown by 415%.
- 25% of small businesses in Malaysia now use AI technologies.
- 92.1% of businesses saw measurable results from AI investments in 2022.
You can use BI platforms like FineReport to automate reporting, visualize data, and gain actionable insights. These tools help you improve operational efficiency, control costs, and sustain growth. However, many small businesses report that lack of knowledge remains a barrier. Choosing a user-friendly BI solution can help you overcome this challenge and unlock the full value of your data.
Enterprise
As an enterprise, you handle large volumes of data from multiple sources. You need BI solutions that scale with your operations and support complex data integration. FineReport enables you to connect to hundreds of data sources, automate workflows, and deliver real-time analytics. You can empower teams across departments to collaborate on data analysis and reporting. Enterprises benefit from advanced BI features like permission control, mobile access, and customizable dashboards. These capabilities ensure you meet compliance requirements and drive strategic decisions with accurate insights. With the right BI platform, you can streamline processes and maintain a competitive edge.
Industry Needs
Every industry in Malaysia has specific BI requirements. For example, manufacturing needs real-time monitoring, while finance demands strict data security and transparency. Empirical studies show that industries value software that delivers accessible, usable, and understandable data. You should look for BI tools that offer strong performance metrics, such as efficiency and effectiveness in reporting. FineReport supports industry-specific needs in Malaysia by providing customizable templates, robust data integration, and transparent analytics. This approach helps you adapt to changing regulations and market pressures, ensuring your data analysis and reporting processes remain reliable and effective.
Pros and Cons of Crystal Report and FineReport in Malaysia
Crystal Report
When you consider Crystal Report as your reporting software, you gain access to a robust reporting tool trusted by many businesses worldwide. This tool stands out for its detailed report formatting and strong integration with legacy systems in Malaysia.
Pros:
- You can develop reports quickly with an easy-to-use designer interface, which reduces coding effort.
- The drag-and-drop report creation feature enables you to generate reports faster than many other tools.
- You can create complex reports with interactive charts, which helps you understand your business model better in Malaysia.
- Exporting reports into popular formats like PDF, Word, Excel, and HTML is straightforward.
- Crystal Report integrates with development environments such as Visual Studio .NET, requiring minimal coding.
- The software supports dynamic, customizable report design with pixel-perfect control.
- You benefit from multilingual support and various layouts, including invoices and statements.
- Mobile access allows stakeholders to view reports on the go.
| Metric / Feature | Details / Statistics |
|---|---|
| Global Market Share | 74.10% among BI tools (2023 report by 6sense) |
| Customer Distribution by Country | 55.85% USA, 6.66% UK, 5.18% Canada |
| Pricing | Fixed price: $495 per user; upgrade $295 per user |
| Business Impact | Enables rapid report development and professional reports that aid decision-making |
Cons:
- You may find the learning curve steep if you lack technical experience.
- The software focuses on on-premises deployment, which can limit flexibility.
- Integration with modern cloud-based data sources is limited.
- Interactive dashboard and advanced visualization features are basic compared to newer tools.
If you need a stable solution for detailed reporting and have experienced IT staff, Crystal Report remains a strong choice.
FineReport
FineReport offers you a modern, flexible reporting software that adapts to your business needs in Malaysia. This tool excels in scalability and ease of use, making it ideal for enterprises seeking growth and agility.
Pros:
- You can consolidate data from multiple sources, creating custom reports and gaining real-time actionable insights.
- The software handles large data volumes without performance loss, supporting your business in Malaysia as it grows.
- Real-time data processing lets you respond quickly to market changes.
- The user-friendly interface makes it easy for non-technical users to build reports.
- Integration with AI and machine learning automates data analysis and enhances predictive insights.
- Cloud-based deployment options provide flexibility, allowing you to access data anywhere and support complex analytics.
| Feature Category | Details |
|---|---|
| Reporting Features | Customizable dashboards, data source connectors, drag & drop design, drill down, email and financial reports, OLAP, scheduled/automated reports |
| Deployment Options | Web-based, on-premises, iPhone app, iPad app, Android app, Windows, Mac, Linux, Chromebook |
Cons:
- You may need to invest time in exploring all advanced features to maximize value.
- Some highly specialized reporting requirements may require additional configuration.
FineReport stands out as a future-ready reporting tool, giving you the flexibility and scalability needed for modern business intelligence.
Decision Guide
Checklist
Choosing the right reporting tool shapes your ability to make data-driven decisions and maximize your bi investment. Use this checklist to match your business needs in Malaysia with the best business intelligence options:
- Assess Your Data Sources
Identify all systems you need to connect. Make sure your reporting software supports integration with databases, cloud platforms, and spreadsheets. - Define Reporting Goals
Decide if you need static reports, interactive dashboards, or real-time analytics. Consider how your team will use the data to support daily operations. - Evaluate User Skills
Check if your users prefer a drag-and-drop interface or have technical skills for advanced customization. The right tool should fit your team's comfort level. - Consider Deployment Needs
Choose between cloud, on-premises, or hybrid deployment. Think about future scalability and remote access requirements. - Review Collaboration Features
Look for permission controls, sharing options, and mobile access. These features help your team work together and stay informed. - Analyze Cost Structure
Compare license fees, subscription plans, and total cost of ownership. Pick a solution that fits your budget and growth plans.
Tip: Regularly review your bi strategy to ensure your reporting tool continues to meet your evolving data needs.
Common Mistakes
Many organizations in Malaysia face similar challenges when selecting reporting software for bi. Avoid these common pitfalls to ensure your data supports effective business intelligence:
- Failing to verify data accuracy can mislead your team and result in poor decisions.
- Overwhelming users with too much data causes data overload and hides important trends.
- Reporting too frequently or not enough can either obscure key metrics or delay responses.
- Neglecting to customize reports for different stakeholders leads to ineffective communication.
- Focusing only on low-level or high-level data may misalign your reports with business goals in Malaysia.
- Not balancing report frequency can create confusion and reduce the value of your bi efforts.
Note: Clear data input guidelines and CRM tools help maintain accuracy and reduce errors. Always balance report frequency to avoid overload and keep your team focused on what matters.
You should match your reporting tool to your business needs in Malaysia. Crystal Report works best for enterprises with legacy systems and complex, static reporting. FineReport fits modern businesses seeking scalable, automated, and visual BI. Small and medium companies benefit from customizable, fast reporting, while large organizations need advanced integration and real-time insights.
For your next steps, audit your current tools, invest in scalable technologies like AI and cloud, and build a skilled team. Use the checklist above to guide your decision and explore modern solutions such as FineReport for future-ready reporting.
Click the banner below to try FineReport for free and empower your enterprise to transform data into productivity!

Continue Reading About Crystal Report and FineReport
Crystal Reports: Alternatives and Comparison with FineReport


FAQ

The Author
Lewis
Senior Data Analyst at FanRuan
Related Articles

Best Reporting Tools for In-House Teams: 7 Options Compared for Dashboards, Scheduled Reports, and Operational Reporting
If you are searching for the $1 for in house teams , you are likely trying to solve a practical problem: how to give internal stakeholders reliable dashboards, recurring reports, and operational visibility without creati
Yida YIn
Jul 02, 2026

Best Finance Reporting Software for CFOs in 2026: 7 Tools Compared for Automation, Governance, and Reporting Depth
If you are searching for finance $1 , you are likely trying to solve a familiar CFO problem: finance data exists across ERP systems, spreadsheets, and BI dashboards, but producing reliable, board ready, repeatable report
Yida Yin
Jul 02, 2026

7 White Label Reporting Tool Options Compared: What Agencies and SaaS Teams Should Evaluate Before Buying
A white label $1 is software that lets you deliver dashboards, reports, or analytics experiences under your own brand instead of the vendor’s. If you are a marketing agency, consultancy, SaaS company, or product team, yo
Yida Yin
Jul 01, 2026