In 2026, businesses rely heavily on data to make smarter decisions. Open source reporting tools play a vital role in transforming raw data into actionable insights. Here are the best open source reporting tools for your business:
FineReport
KNIME
OpenReports
JasperReports
LibreOffice Base
SQL Power Wabit
Eclipse BIRT
Apache Superset
Metabase Open Source Edition
ReportServer Community
These tools are not only cost-effective but also highly adaptable. They allow you to customize reports to meet unique needs while offering scalability to match your growing operations. Whether you manage a small team or a large enterprise, open-source solutions can enhance your report automation and ensure efficient reporting processes.
Every demo in this article was designed with FineReport. Ready to transform your reporting experience? Click below to start your free FineReport trial and discover what’s possible!
Open source reporting tools are software solutions that allow you to create, manage, and share reports without the constraints of proprietary licenses. These tools are developed collaboratively by communities or organizations, making their source code freely available for modification and distribution. They empower you to tailor the software to your unique needs, whether you want to build customizable dashboards or integrate with existing systems.
Unlike traditional automated reporting tools, open source alternatives offer unmatched flexibility. They support a wide range of data sources, enabling seamless integration with databases, spreadsheets, and cloud-based reporting platforms. Tools like Apache Superset and Metabase exemplify this adaptability, providing robust features for data visualization and business intelligence. Their growing adoption in industries like healthcare and finance highlights their versatility and effectiveness.
Open source reporting tools offer several advantages that make them a preferred choice for businesses:
Cost-Effectiveness: These tools eliminate the need for expensive licenses, reducing your operational costs. You can allocate resources to other critical areas of your business.
Customization: Open source tools allow you to create tailored solutions. Whether you need self-service capabilities or advanced report automation, these tools adapt to your requirements.
Scalability: As your business grows, these tools scale effortlessly. They integrate with cloud-based reporting systems, ensuring you can handle increasing data volumes.
Community Support: Open source tools benefit from active communities. Developers and users collaborate to improve features, fix bugs, and share best practices.
Industry Adoption: Major companies now establish Open Source Program Offices (OSPOs) to manage and promote open-source solutions. This trend underscores the reliability and trustworthiness of these tools.
Tip: Open source BI tools like Redash and Metabase are excellent for creating insights-driven, customizable dashboards. They simplify complex data visualization tasks, making them accessible even to non-technical users.
By leveraging open source reporting tools, you gain the ability to transform raw data into actionable insights while maintaining control over your software environment. These tools not only enhance report automation but also foster a culture of innovation and collaboration within your organization.
Criteria for Selecting the Best Open Source Reporting Tools
Cost and Licensing
When choosing open source reporting tools, cost and licensing play a significant role. Many tools are free to use, but some may include hidden costs for advanced features or enterprise-level support. You should carefully evaluate the licensing terms to ensure they align with your business needs. For example, some licenses allow unlimited customization, while others may restrict commercial use.
Understanding the total cost of ownership is essential. This includes potential expenses for hosting, maintenance, and training. User reviews on platforms like G2 and Capterra often highlight these hidden costs, helping you make informed decisions. By analyzing pricing structures, you can avoid unexpected financial burdens and allocate resources effectively.
Features and Functionality
The features and functionality of a tool determine its ability to meet your reporting needs. Look for tools that offer robust data analysis capabilities, customizable dashboards, and a powerful reporting engine. These features enable you to create detailed reports and gain actionable insights.
User feedback from platforms like Reddit and YouTube provides valuable insights into how these tools perform in real-world scenarios. For instance, users often compare feature sets against common business requirements, such as self-service analytics and data visualization and analytics. Tools with strong API capabilities and reporting engine integration also stand out, as they fit seamlessly into existing workflows.
Scalability and Integration
Scalability ensures that the tool grows with your business. Open source BI tools excel in this area, offering flexibility to handle increasing data volumes. They integrate with various data sources, making them ideal for businesses with diverse reporting needs.
Integration capabilities are equally important. Tools that support data visualization and business intelligence workflows allow you to connect multiple systems effortlessly. Community support often plays a crucial role here, as active communities provide guidance on integrating tools into complex environments. By choosing scalable and integrative solutions, you can future-proof your reporting processes.
Ease of Use and Support
When choosing an open-source reporting tool, ease of use is a critical factor. An intuitive interface enables users to build reports quickly without advanced technical expertise. Many non-open-source tools, such as FineReport, offer drag-and-drop functionality that simplifies report creation, even for those with limited data analysis experience. Features like a spreadsheet-style interface also make the shift from manual tools such as Excel far smoother and more efficient.
Support is another key factor to consider. Open source tools often come with active user communities. These communities provide forums, tutorials, and documentation to help you troubleshoot issues or learn new features. Some tools also offer professional support packages for businesses that need dedicated assistance. This ensures you can resolve challenges efficiently and keep your reporting processes running smoothly.
To evaluate ease of use and support quality, businesses often rely on user experience surveys. These surveys measure how well a tool meets user expectations. Here’s a quick overview of common metrics:
Survey Type
Purpose
Customer Effort Score (CES)
Measures how easy it is for customers to complete tasks and resolve issues with support.
Customer Satisfaction (CSAT)
Assesses customer happiness with services, focusing on individual interactions.
Net Promoter Score (NPS)
Evaluates customer loyalty and likelihood to recommend the product or service to others.
These metrics highlight how user-friendly a tool is and how effectively its support system operates. Tools with high CES and CSAT scores often stand out as reliable options for businesses.
Tip: Look for tools with active forums or high NPS ratings. These indicators often reflect strong community engagement and reliable support systems.
By choosing a tool that balances ease of use with robust support, you can empower your team to focus on insights rather than technical hurdles. This ensures smoother workflows and better decision-making for your business.
Top 10 Open Source Reporting Tools for 2026
Tool #1: FineReport by FanRuan
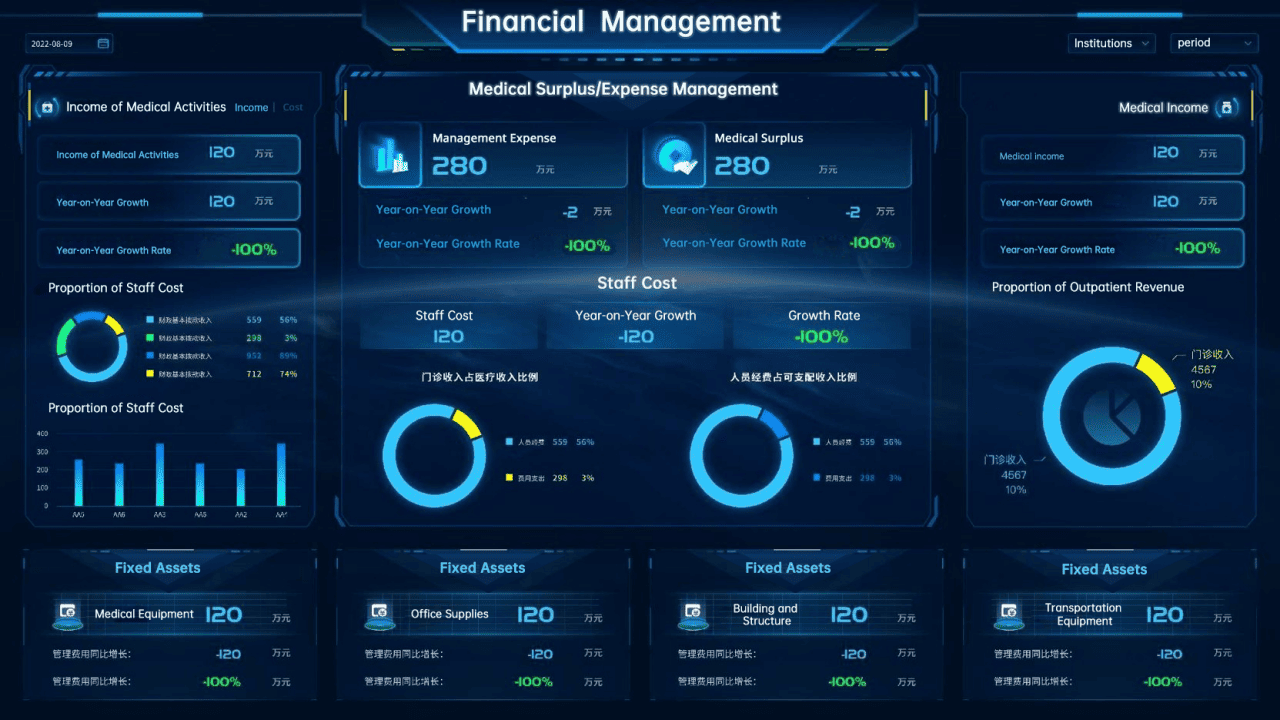
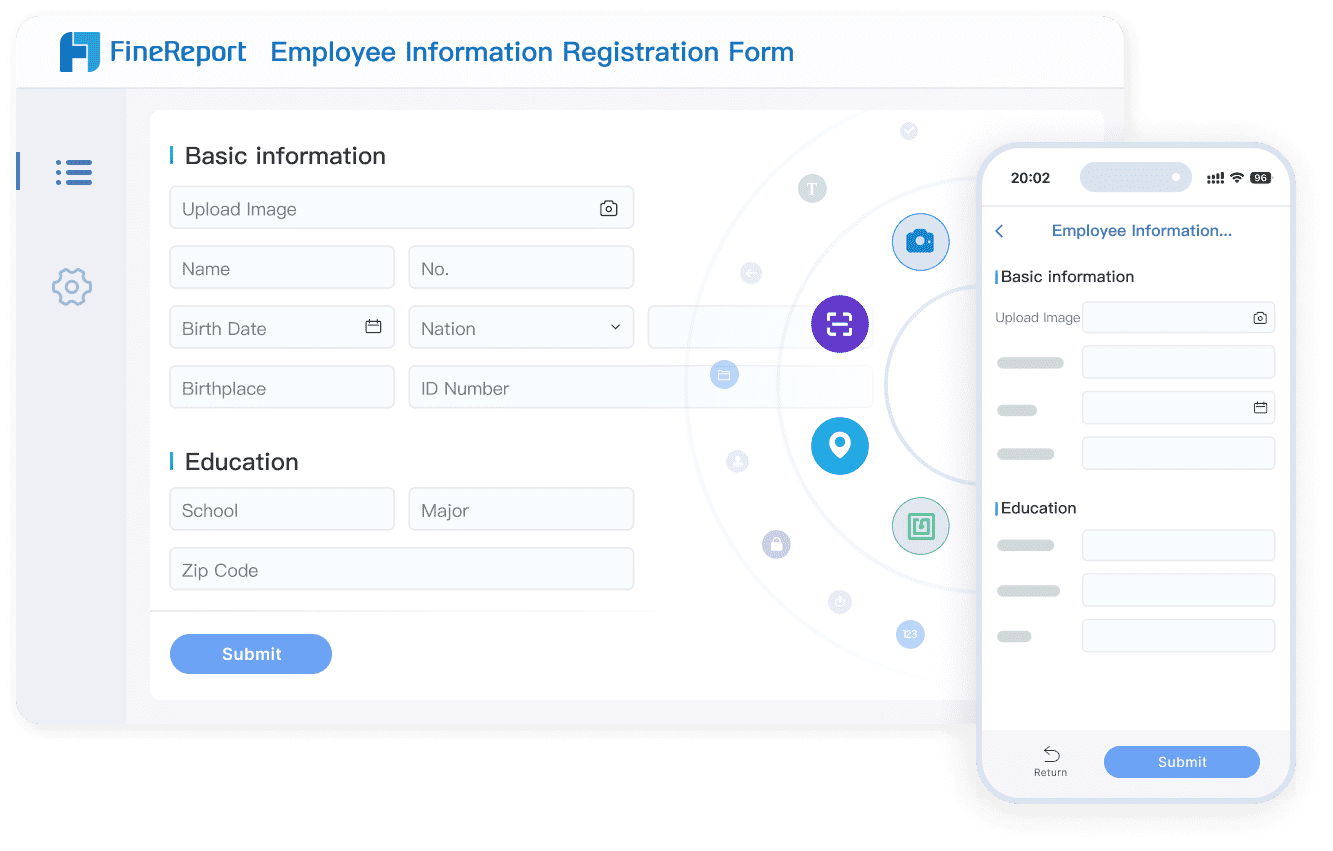
FineReport by FanRuan is not an open-source reporting tool, but rather a powerful enterprise-grade solution widely adopted across industries. Unlike many open-source tools, FineReport is designed to meet the complex needs of businesses, offering pixel-perfect reports, interactive dashboards, and robust enterprise-level features. Its intuitive, drag-and-drop interface makes report design easy even for non-technical users, while its ability to integrate with multiple data sources ensures flexibility and scalability. For organizations that require reliability, security, and enterprise support, FineReport is often a better choice than open-source alternatives.
FineReport excels in handling large datasets, making it ideal for government agencies and large enterprises. It supports real-time data analysis capabilities, enabling you to monitor performance and make informed decisions quickly. The tool also offers robust collaboration features, such as advanced data permissions, which ensure secure teamwork across departments. Additionally, its mobile access and data entry validation checks make it a comprehensive solution for modern businesses.
Mobile access and validation checks for accurate data input.
FineReport’s ability to integrate with other tools, such as FineBI, further enhances its value. This integration allows you to combine self-service analytics with detailed reporting, creating a powerful ecosystem for data exploration and report automation.
Tip: FineReport is particularly effective for organizations that require automated reporting tools to streamline operations and improve decision-making.
Tool #2: KNIME
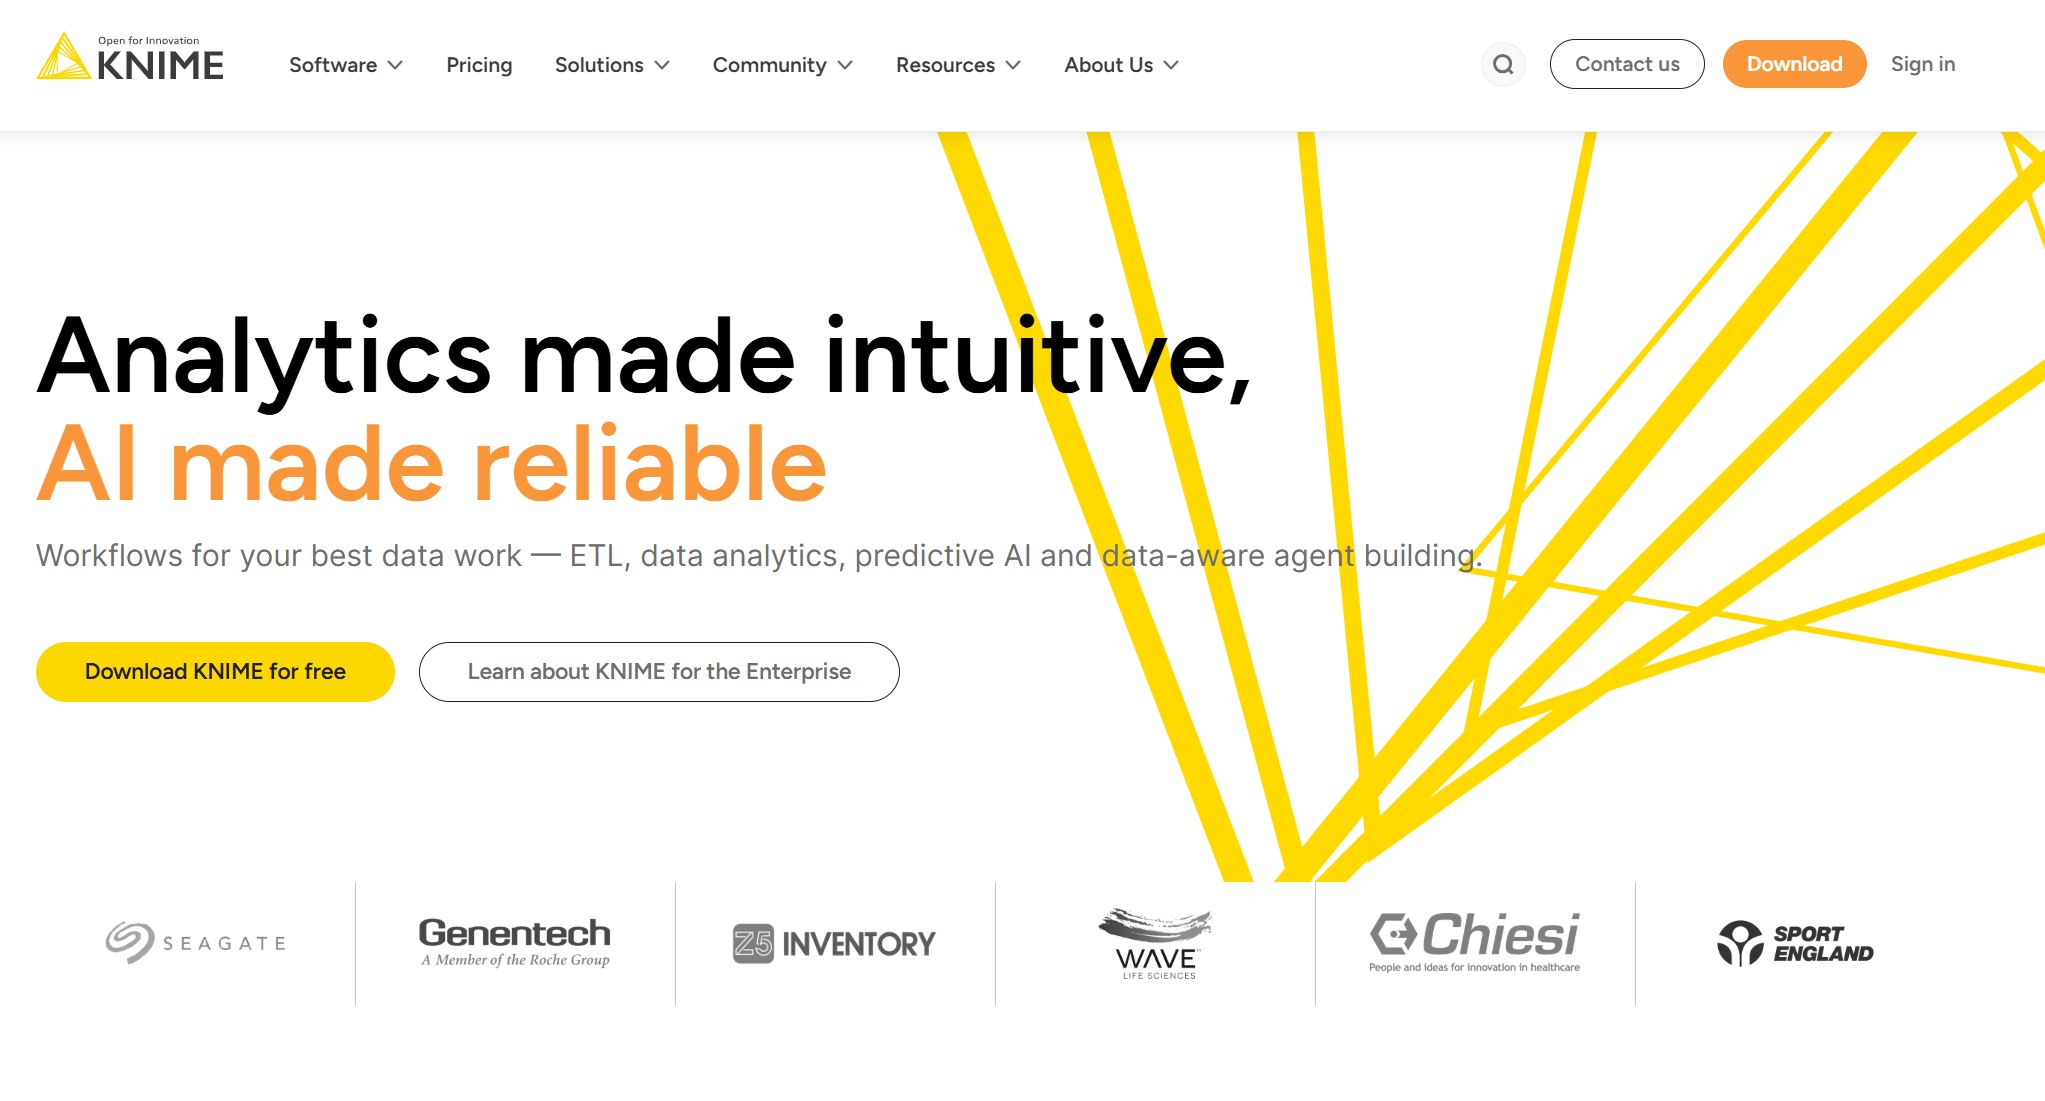
KNIME is a powerful open source BI tool that excels in data integration and analysis. It provides a comprehensive platform for connecting various data sources, cleaning and preprocessing data, and building predictive models. Its intuitive interface and drag-and-drop functionality make it accessible to users of all skill levels.
KNIME’s data analysis capabilities include machine learning algorithms for both supervised and unsupervised learning. These features allow you to uncover actionable insights and create interactive visualizations that simplify complex data. The tool also supports workflow automation, saving you time and improving productivity.
Feature
Description
Data Integration
Connects to databases, APIs, and other data sources seamlessly.
Data Cleaning and Preprocessing
Handles missing data and normalizes variables for accurate analysis.
Machine Learning
Offers algorithms for predictive modeling and clustering.
Creates scatter plots, dashboards, and other visualizations for better insights.
Workflow Automation
Automates complex workflows to enhance efficiency.
Reporting and Presentation
Generates customizable reports for effective communication of findings.
KNIME’s versatility makes it suitable for various industries. For example, in the public sector, it automates processes and provides a single point of truth for data access. In marketing, it combines data from multiple sources to improve customer targeting and campaign performance. These capabilities make KNIME a reliable choice for businesses seeking a robust open source reporting tool.
Note: KNIME’s ability to automate workflows and integrate with diverse data sources makes it a valuable asset for businesses aiming to enhance their reporting processes.
Tool #3: OpenReports
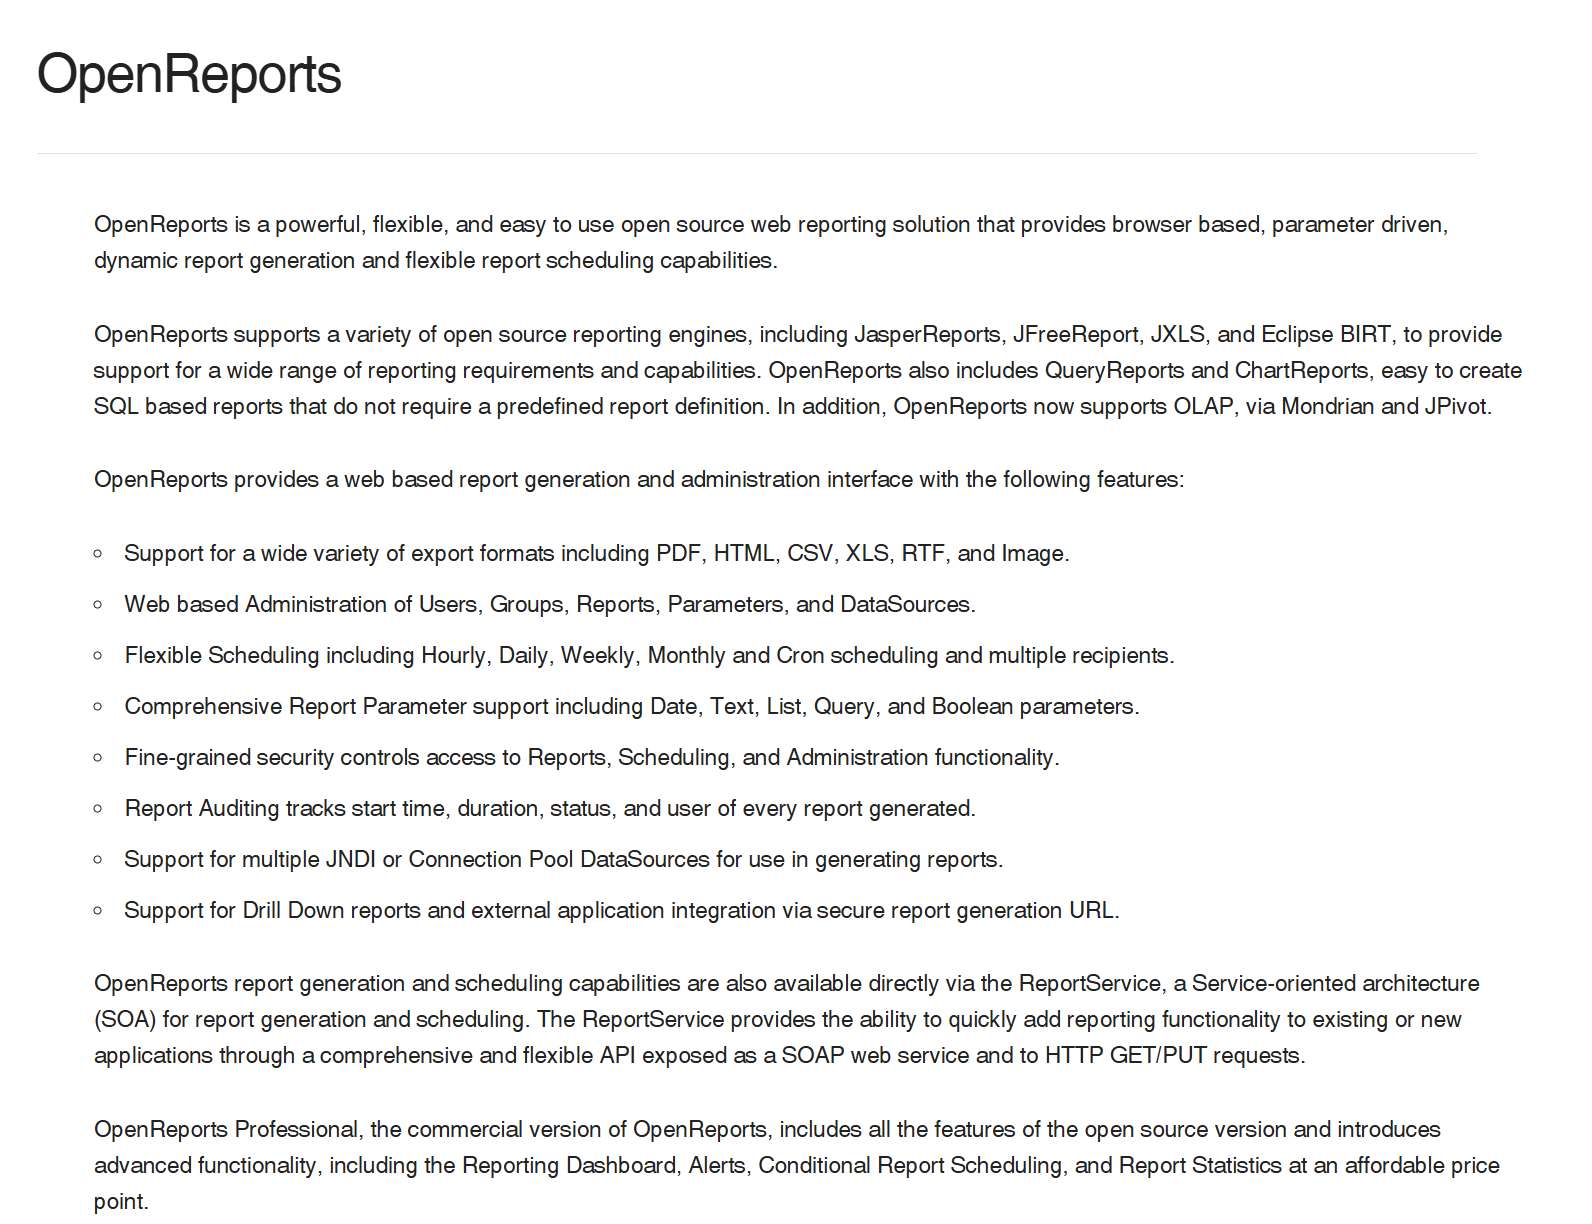
OpenReports is a lightweight yet powerful open source reporting tool designed for businesses that need a straightforward solution for report generation. It supports multiple reporting engines, including JasperReports and Eclipse BIRT, allowing you to choose the best fit for your needs. OpenReports provides a web-based interface for scheduling and delivering reports, making it easy to share insights with stakeholders.
One of OpenReports’ key strengths is its flexibility. It integrates seamlessly with various data sources, enabling you to create detailed reports without extensive technical knowledge. The tool also supports role-based access control, ensuring that sensitive data remains secure.
Feature
Description
Reporting Engines
Supports JasperReports, Eclipse BIRT, and other engines.
Web-Based Interface
Simplifies report scheduling and delivery.
Data Integration
Connects to multiple data sources for comprehensive reporting.
Role-Based Access
Ensures data security with advanced permission controls.
OpenReports is ideal for small to medium-sized businesses that require a cost-effective solution for report automation. Its straightforward design and robust features make it a practical choice for organizations looking to streamline their reporting processes.
Tip: OpenReports is a great option if you’re seeking a lightweight tool that balances simplicity with functionality.
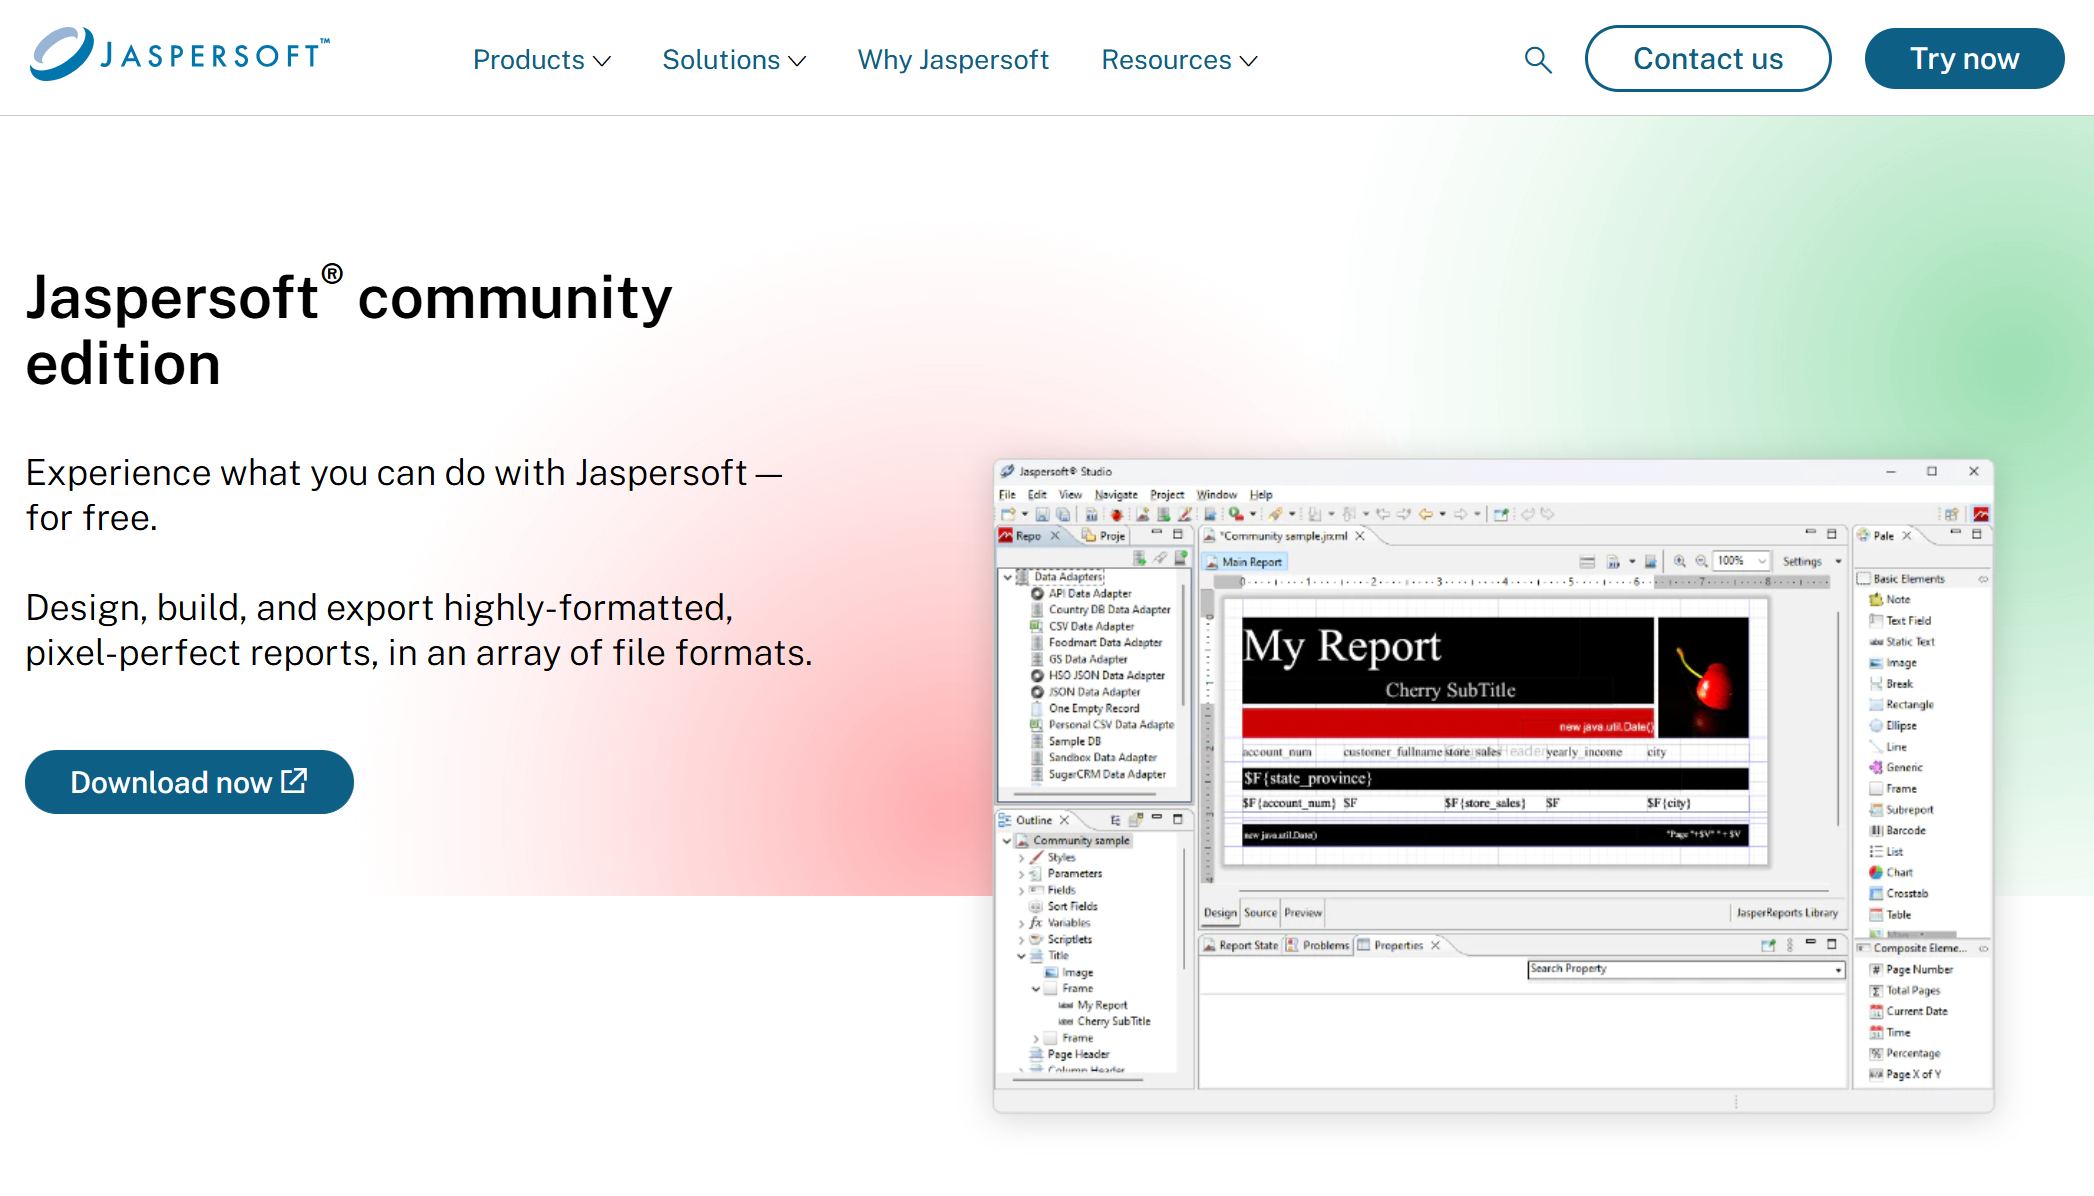
Tool #4: JasperReports
JasperReports is a robust open source reporting tool designed to meet the needs of businesses seeking professional-grade reporting solutions. Its flexibility and scalability make it a popular choice for enterprises handling complex data requirements. With JasperReports, you can create highly customized reports that cater to your unique business needs.
This tool offers a range of advanced features that enhance its usability and effectiveness:
Non-technical users can easily schedule and manage reports, making it accessible to a broader audience.
Its scalable architecture supports enterprise-level reporting, ensuring it can handle large datasets without compromising performance.
The intuitive user interface includes reusable Angular components, streamlining the report creation process.
JasperReports excels in producing pixel-perfect layouts, ensuring your reports maintain a professional appearance.
You can generate Excel-friendly outputs with embedded formulas, enabling advanced data manipulation directly within spreadsheets.
The tool supports custom visualizations, including charts, graphs, and cross-tabs, allowing you to present data in a visually compelling way.
Multi-format export options let you share reports in PDF, HTML, or Excel formats, ensuring compatibility with various platforms.
Sub-reports integration allows you to create nested reports, ideal for presenting hierarchical data.
Conditional formatting dynamically highlights key data points, making it easier to identify trends and anomalies.
Parameterization enables you to filter and personalize reports based on specific criteria.
JasperReports stands out for its ability to adapt to evolving business needs. Its flexible architecture ensures you can customize it to align with your organization's goals. Whether you need to create detailed financial reports or visualize sales performance, JasperReports provides the tools to do so effectively.
Tip: JasperReports is an excellent choice if you require a reporting tool that combines advanced features with user-friendly functionality. Its ability to produce pixel-perfect layouts and support multi-format exports makes it a versatile solution for businesses of all sizes.
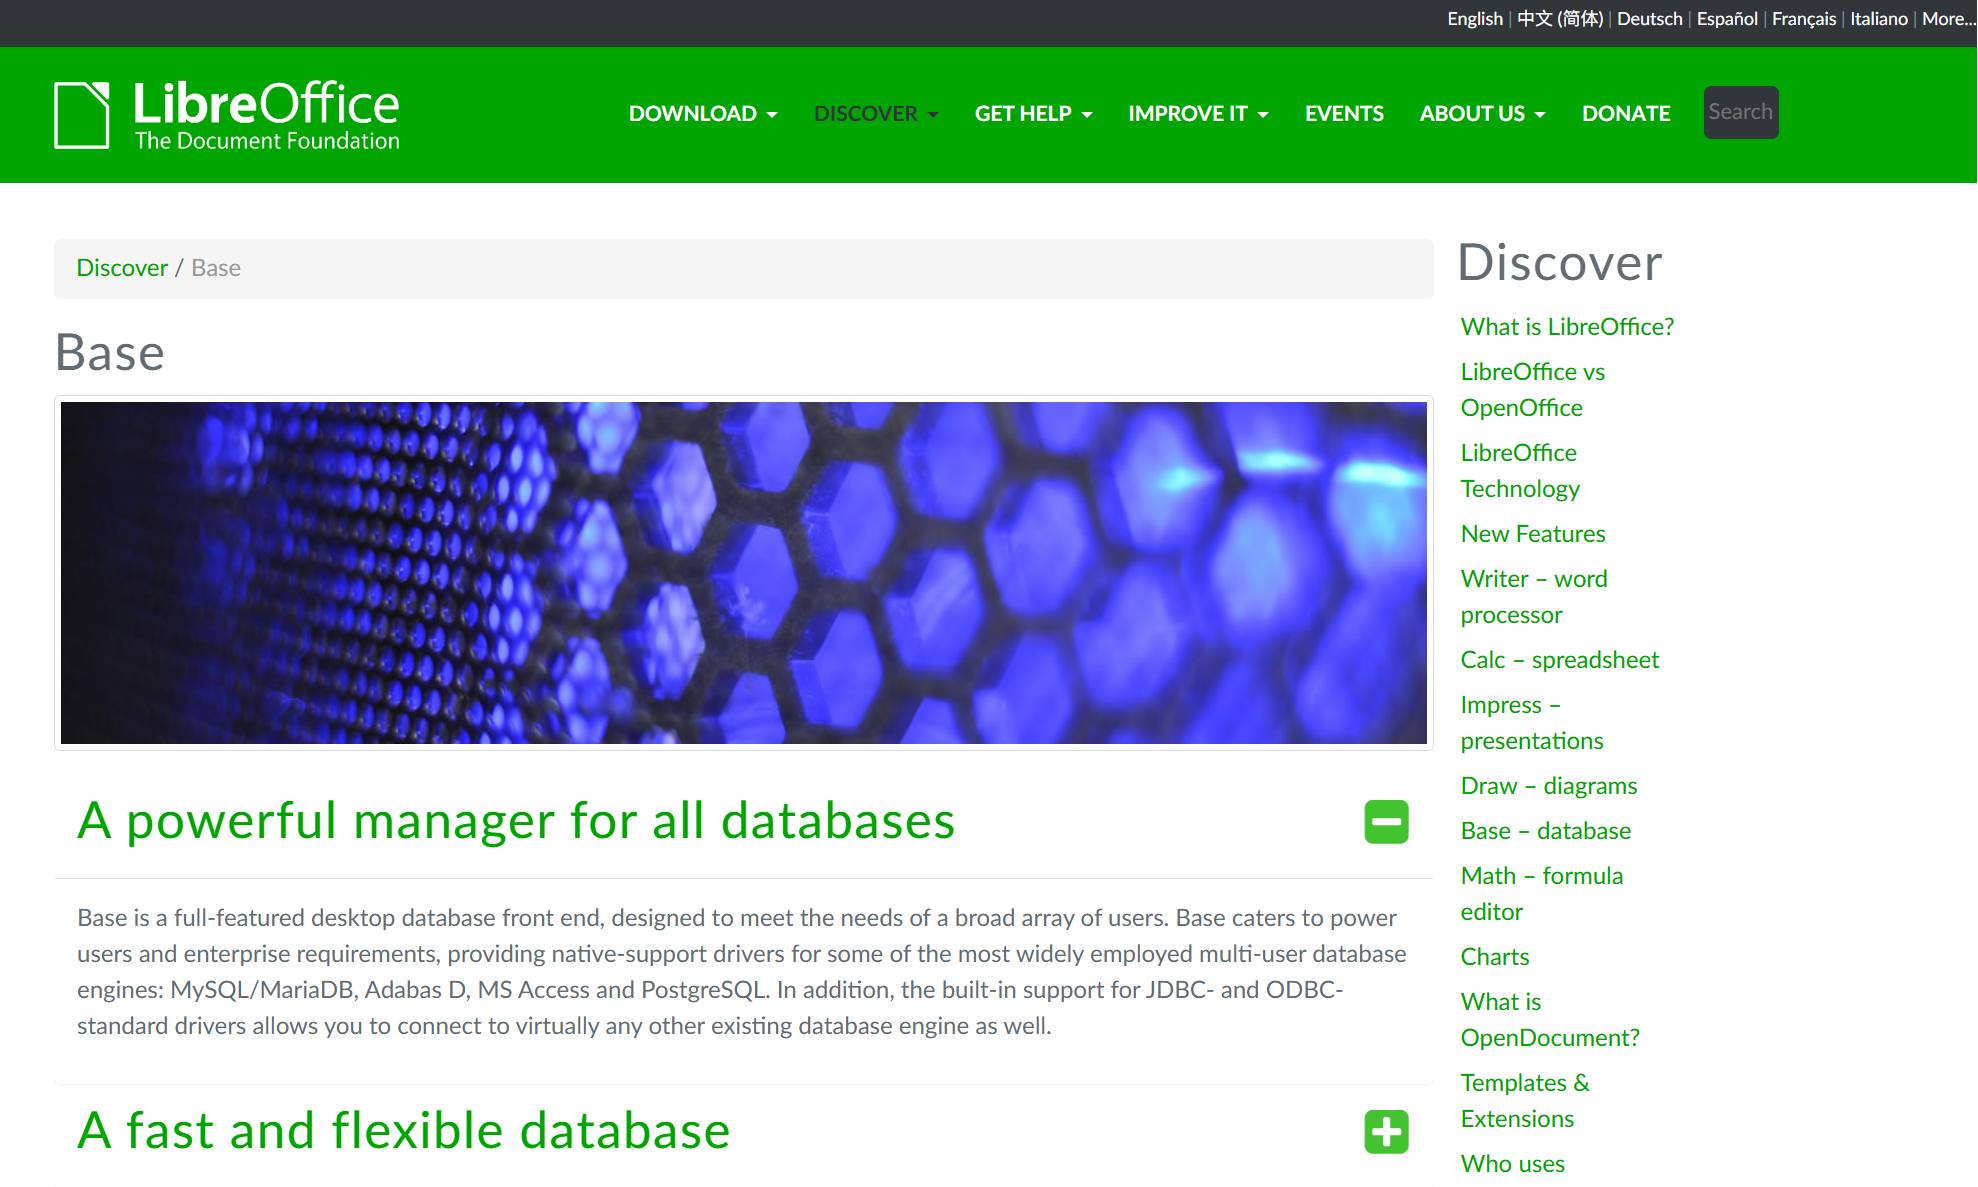
Tool #5: LibreOffice Base
LibreOffice Base is a powerful open source database management tool that doubles as a reporting solution. It is part of the LibreOffice suite, which is widely recognized for its free and open source productivity tools. Base allows you to create and manage databases while generating reports tailored to your business needs.
This tool is particularly suitable for small to medium-sized businesses. Its straightforward interface simplifies database management, making it accessible even to users with limited technical expertise. With Base, you can connect to a variety of data sources, including MySQL, PostgreSQL, and Microsoft Access, ensuring seamless integration with your existing systems.
Key features of LibreOffice Base include:
A user-friendly interface that simplifies database creation and management.
Support for multiple data sources, enabling you to consolidate information from various platforms.
Built-in wizards that guide you through tasks like table creation and report generation.
Customizable reports that allow you to present data in a format that suits your audience.
Integration with other LibreOffice tools, such as Calc and Writer, for enhanced productivity.
LibreOffice Base is ideal for businesses that need a cost-effective solution for managing data and generating reports. Its open source nature ensures you have the flexibility to adapt it to your specific requirements. By leveraging Base, you can streamline your data management processes and create reports that provide valuable insights.
Note: LibreOffice Base is a great option for businesses looking for a free and open source alternative to proprietary database management tools. Its integration with other LibreOffice applications enhances its versatility and usability.
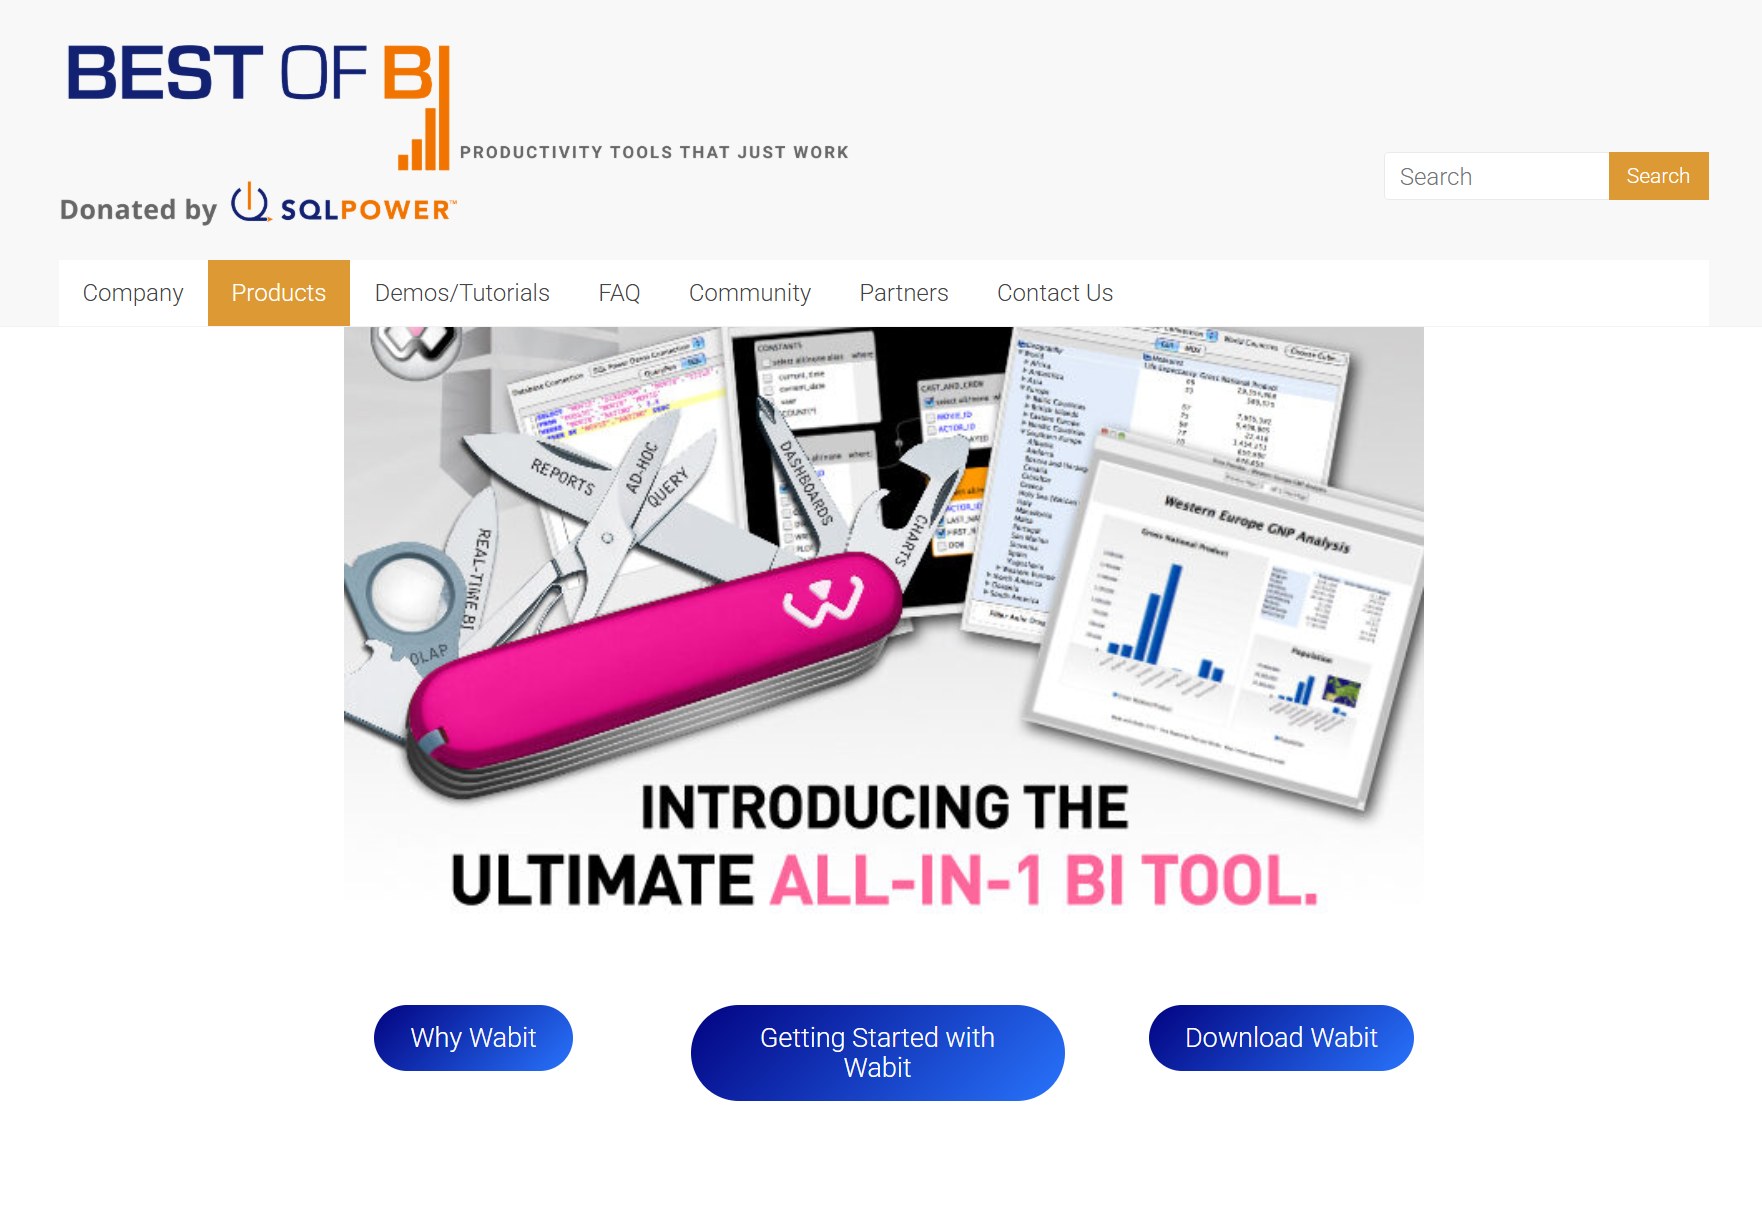
Tool #6: SQL Power Wabit
SQL Power Wabit is a straightforward yet powerful open source BI tool designed for ad-hoc reporting and data analysis. It is particularly well-suited for users who need quick access to insights without navigating complex interfaces. Wabit’s simplicity makes it an excellent choice for small businesses and individual users.
With SQL Power Wabit, you can create reports and dashboards effortlessly. Its drag-and-drop interface eliminates the need for advanced technical skills, allowing you to focus on analyzing data rather than managing software. The tool also supports SQL queries, giving advanced users the flexibility to perform more complex analyses.
Notable features of SQL Power Wabit include:
A drag-and-drop interface that simplifies report creation.
Support for SQL queries, enabling advanced data analysis.
Real-time data access, ensuring your reports reflect the latest information.
Customizable dashboards that provide a clear overview of key metrics.
Export options for sharing reports in various formats.
SQL Power Wabit’s lightweight design ensures it runs efficiently, even on systems with limited resources. This makes it an ideal choice for users who need a reliable reporting tool without the overhead of more complex solutions. Whether you’re tracking sales performance or monitoring operational metrics, Wabit provides the tools to do so effectively.
Tip: SQL Power Wabit is perfect for users who value simplicity and efficiency. Its drag-and-drop interface and real-time data access make it a practical choice for quick and accurate reporting.
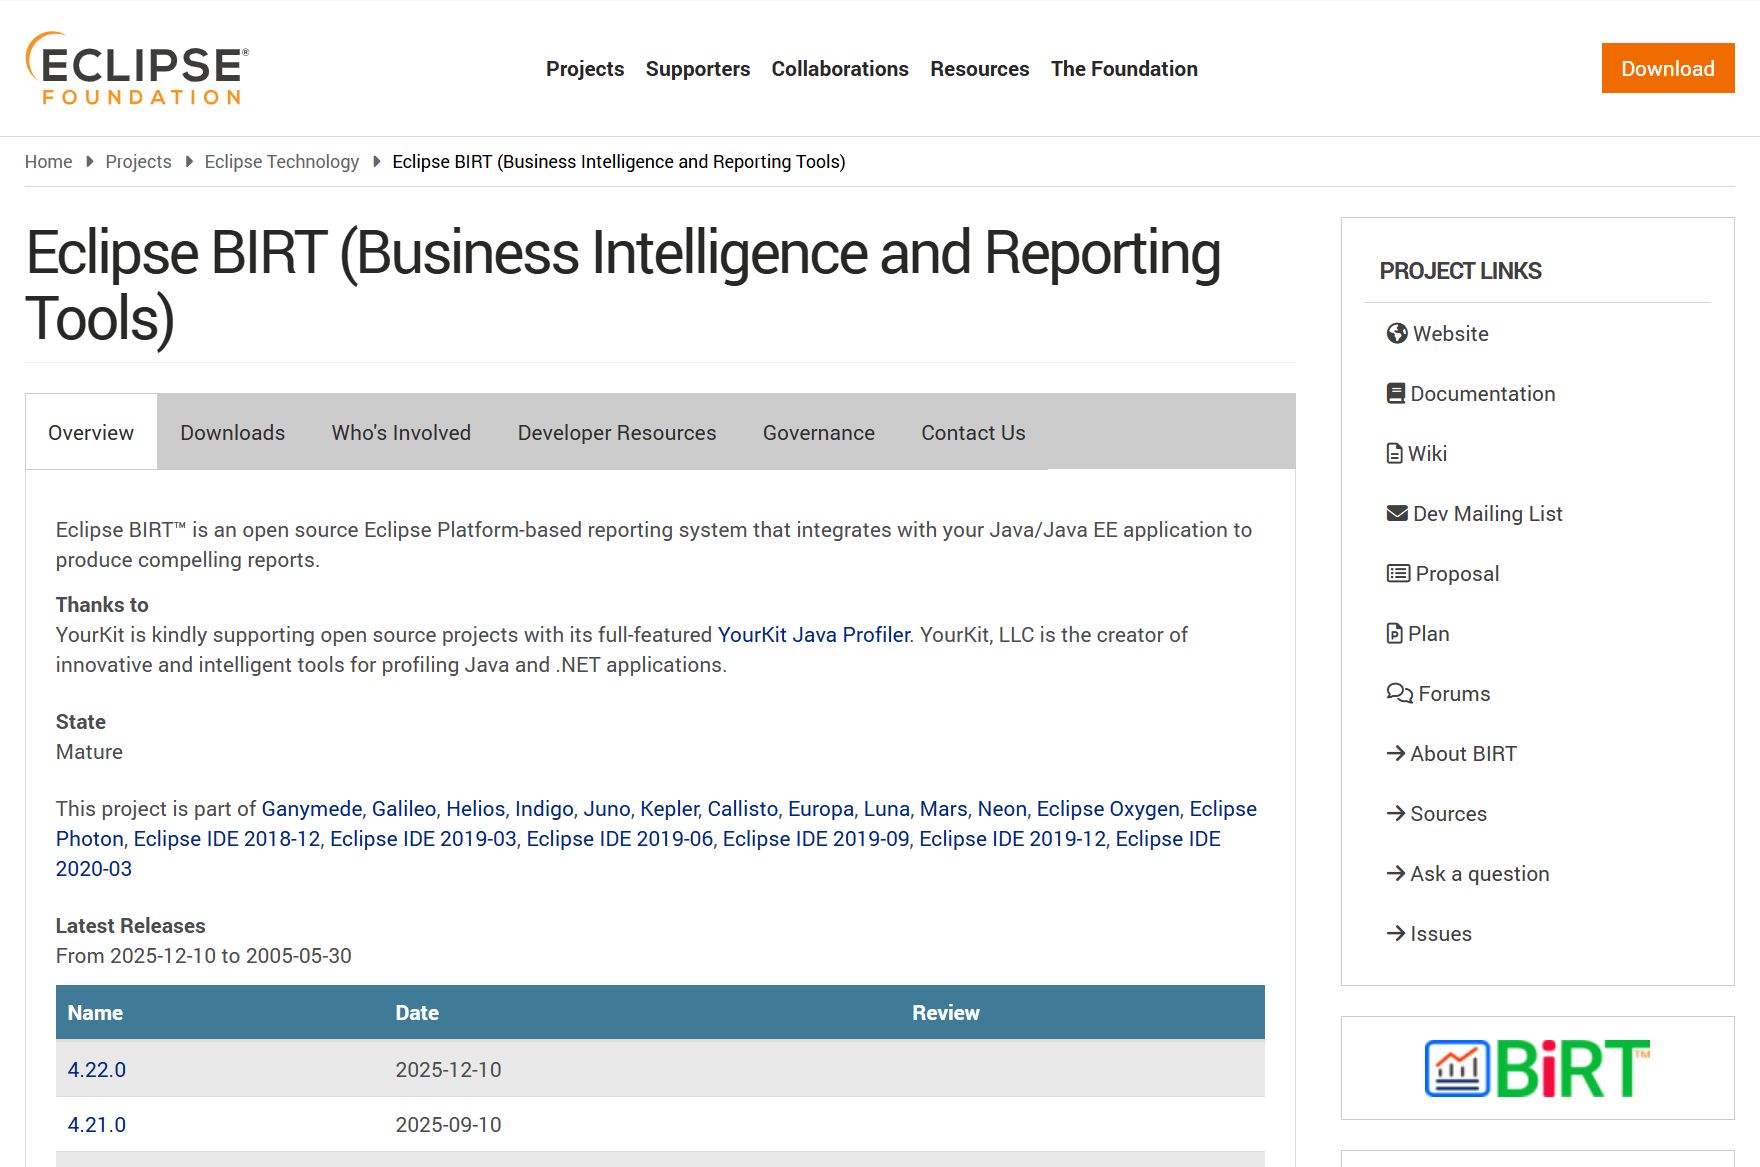
Tool #7: Eclipse BIRT
Eclipse BIRT (Business Intelligence and Reporting Tools) is a robust open-source platform designed for creating data-driven reports and visualizations. It is part of the Eclipse Foundation and is widely used by developers and businesses for its flexibility and integration capabilities. BIRT simplifies the process of generating detailed reports, making it a valuable tool for organizations of all sizes.
Utilizes WTP technology for deploying the Web Viewer.
BIRT tag library
Allows for customized parameter pages and viewer attributes modifications.
Integration capabilities
Enhances integration with the Eclipse platform.
Ease of use
User-friendly interface and functionalities.
Reporting functionalities
Improvements in reporting features and output formats.
BIRT’s user-friendly interface allows you to create reports with minimal effort. Its integration with the Eclipse platform ensures seamless workflows for developers. The tool also supports advanced customization through its tag library, enabling you to tailor parameter pages and viewer attributes to your specific needs.
Community Support:
Community events like EclipseCon encourage user participation and feedback.
Feedback mechanisms such as the Eclipse BIRT Awareness survey gather user insights.
Engagement through Bugzilla allows users to report issues and suggest improvements.
Eclipse BIRT is ideal for businesses that need a reliable and customizable reporting solution. Its active community ensures continuous updates and support, making it a dependable choice for your reporting needs.
Tip: Use Eclipse BIRT if you need a tool that combines powerful reporting functionalities with a supportive user community.
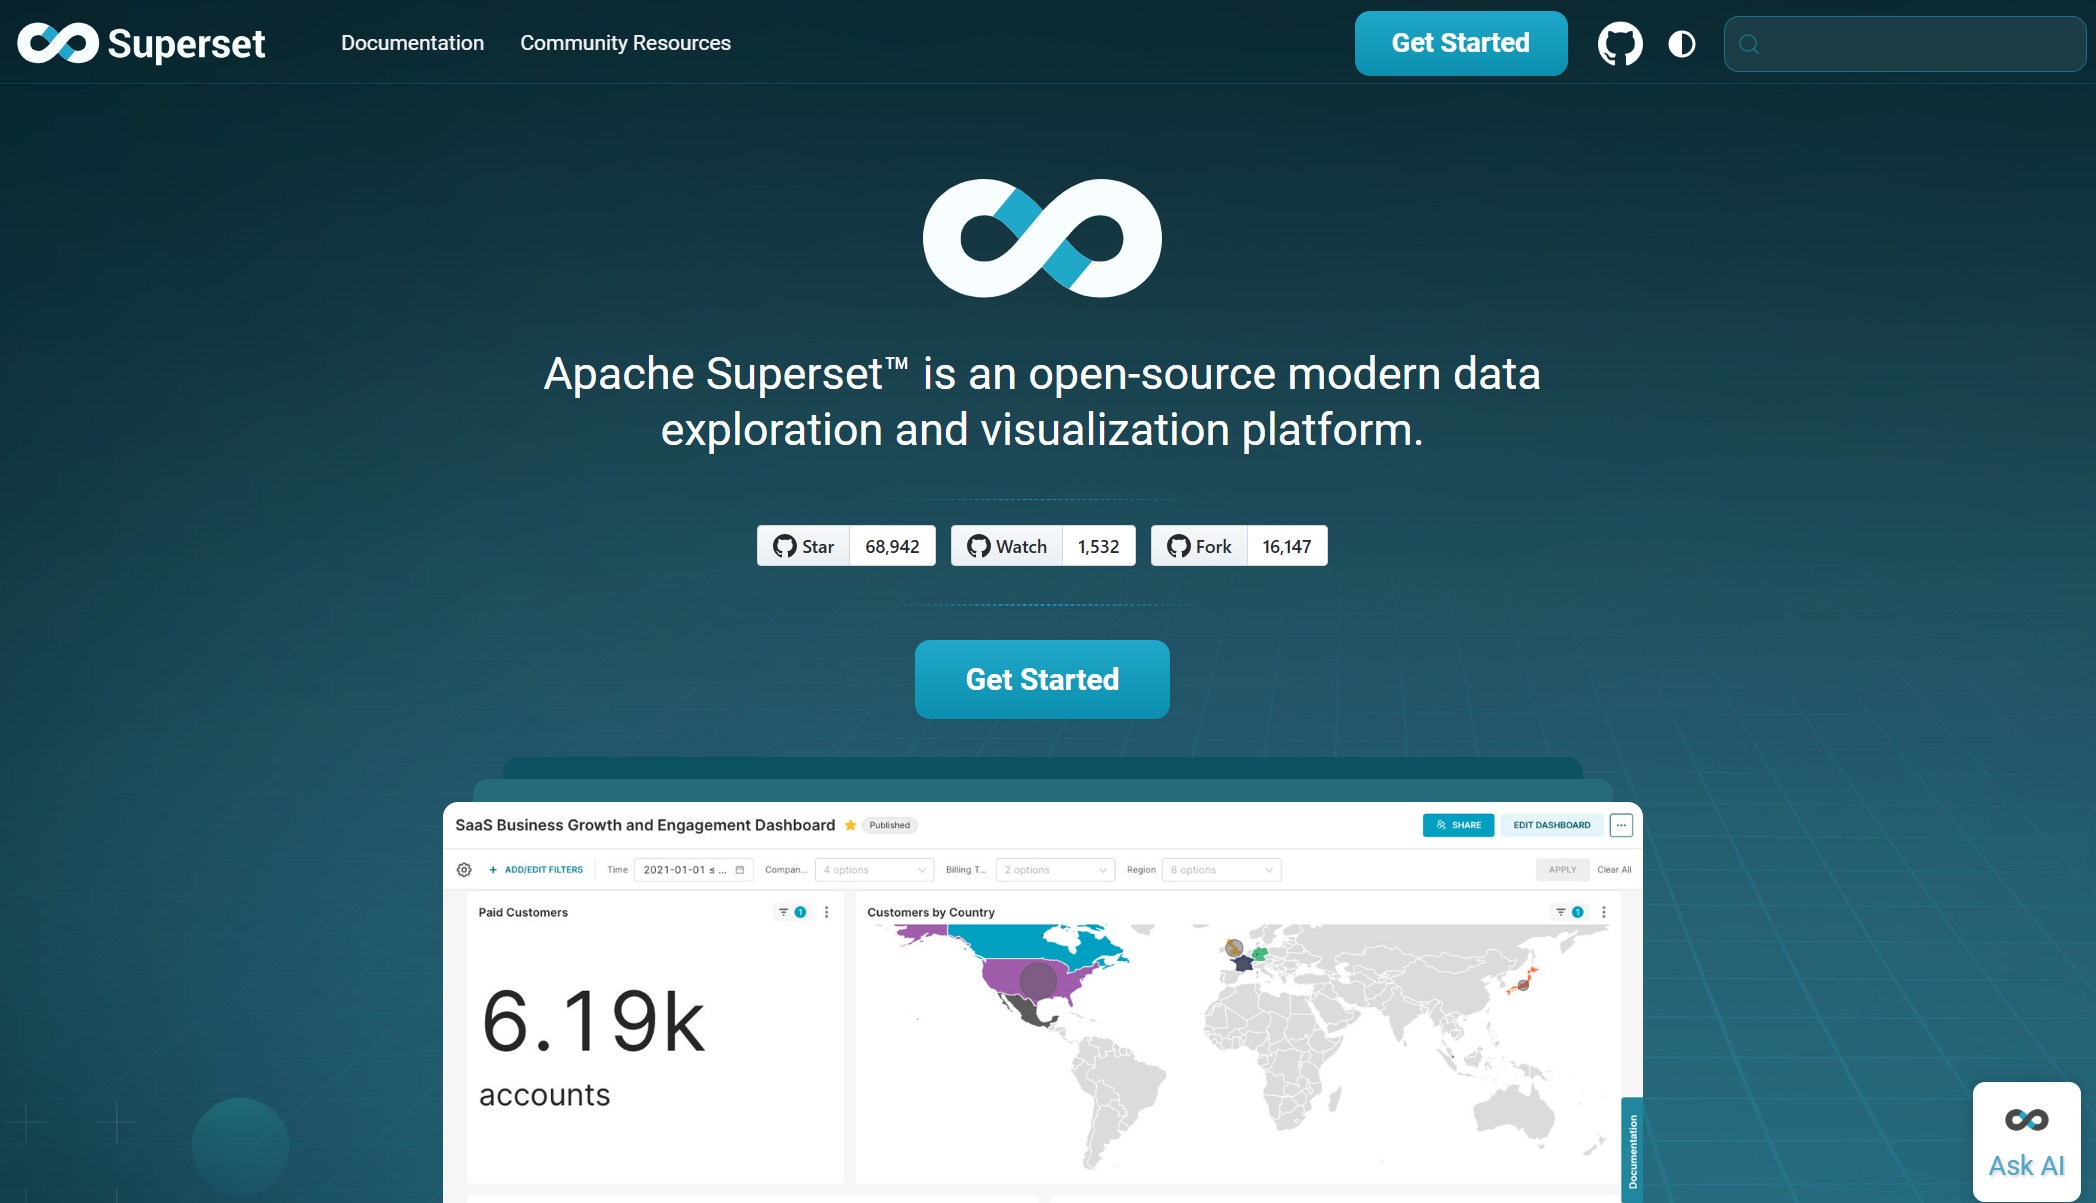
Tool #8: Apache Superset
Apache Superset is a modern, open-source data visualization and exploration platform. It is designed to handle large datasets and offers a lightweight yet powerful interface for creating interactive dashboards and reports. Superset’s intuitive design makes it accessible to users of all skill levels, from beginners to advanced analysts.
Useful for comparing quantities across categories.
Pie Charts
Shows proportions of a whole.
Geospatial Charts
Visualizes data across geographical locations.
Custom Visualizations
Built using a plug-in architecture for flexibility.
Superset supports multiple data sources, including SQL databases and big data platforms. Its plug-in architecture allows you to create custom visualizations, ensuring flexibility in presenting your data. The tool’s fast and lightweight interface enhances user experience, enabling you to explore data efficiently.
Intuitive design suitable for users with varying technical expertise.
Seamless integration with diverse data sources.
Apache Superset is perfect for businesses that require a versatile tool for data visualization and reporting. Its ability to handle complex datasets while maintaining ease of use makes it a standout choice.
Note: Apache Superset’s geospatial charts are particularly useful for businesses that need to analyze data across different locations.
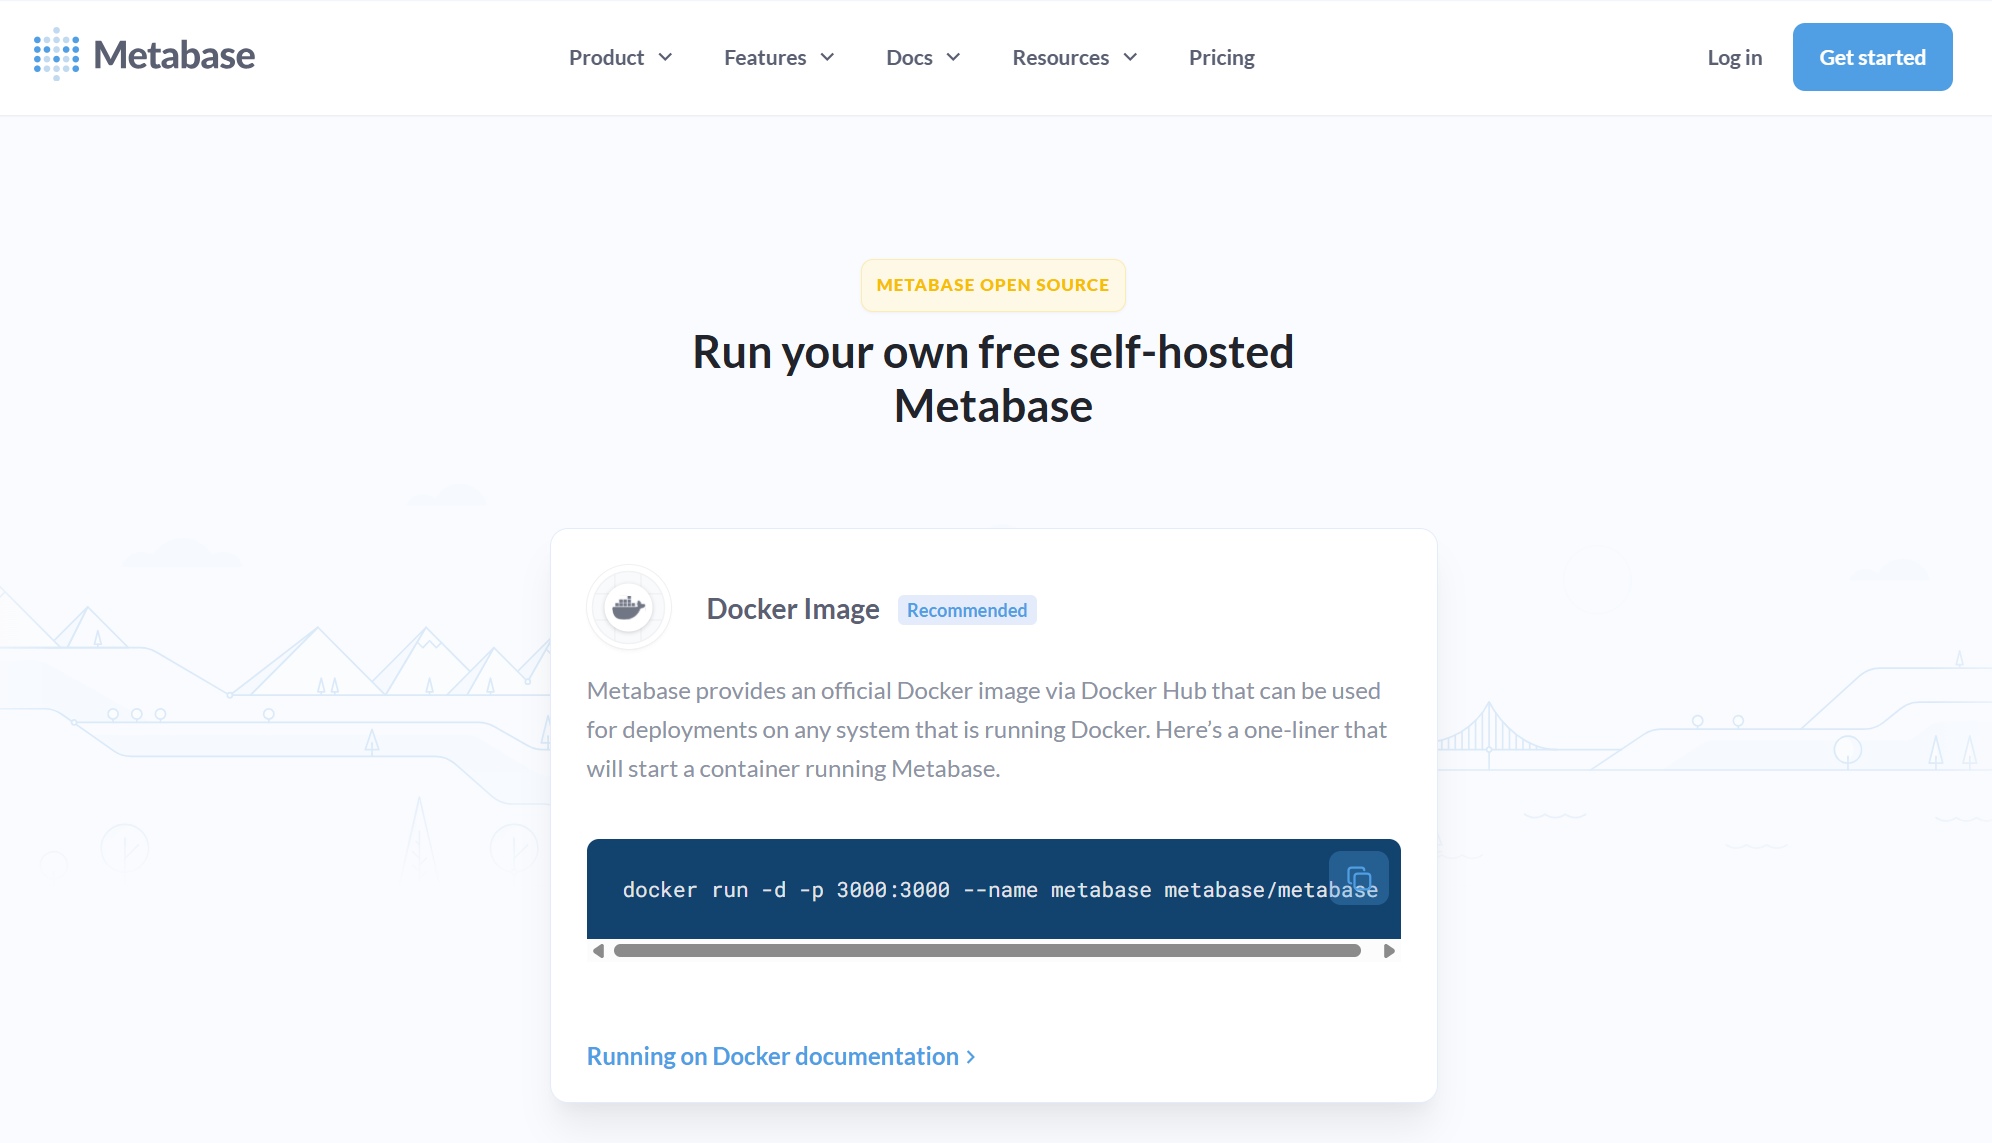
Tool #9: Metabase Open Source Edition
Metabase Open Source Edition is a user-friendly BI tool that simplifies data analysis and reporting. It is designed for non-technical users, allowing them to create dashboards and answer questions about their data without writing SQL queries. Metabase’s intuitive interface makes it an excellent choice for teams that need quick access to insights.
Number of users who logged in and interacted with Metabase.
Question Views Last Week
Count of how many times questions have been viewed.
Dashboards Created Last Week
Number of new dashboards created.
Most Viewed Dashboards
Dashboards with the highest number of views.
Most Viewed Questions
Questions that are most frequently accessed by users.
Question Performance
Metrics related to the execution time and efficiency of questions.
Dashboard Performance
Insights into dashboard load times and interactions.
Metabase allows you to track user activity and performance metrics, providing valuable insights into how your team interacts with data. Its ability to create dashboards quickly ensures that you can monitor key metrics in real time.
Why Metabase Stands Out:
No SQL knowledge required for basic data exploration.
Quick dashboard creation for real-time monitoring.
Performance metrics help optimize data usage.
Metabase Open Source Edition is ideal for small to medium-sized businesses that need an easy-to-use reporting tool. Its focus on simplicity and efficiency makes it a practical choice for teams looking to enhance their data-driven decision-making.
Tip: Metabase is a great option if you want a tool that combines simplicity with powerful reporting capabilities.
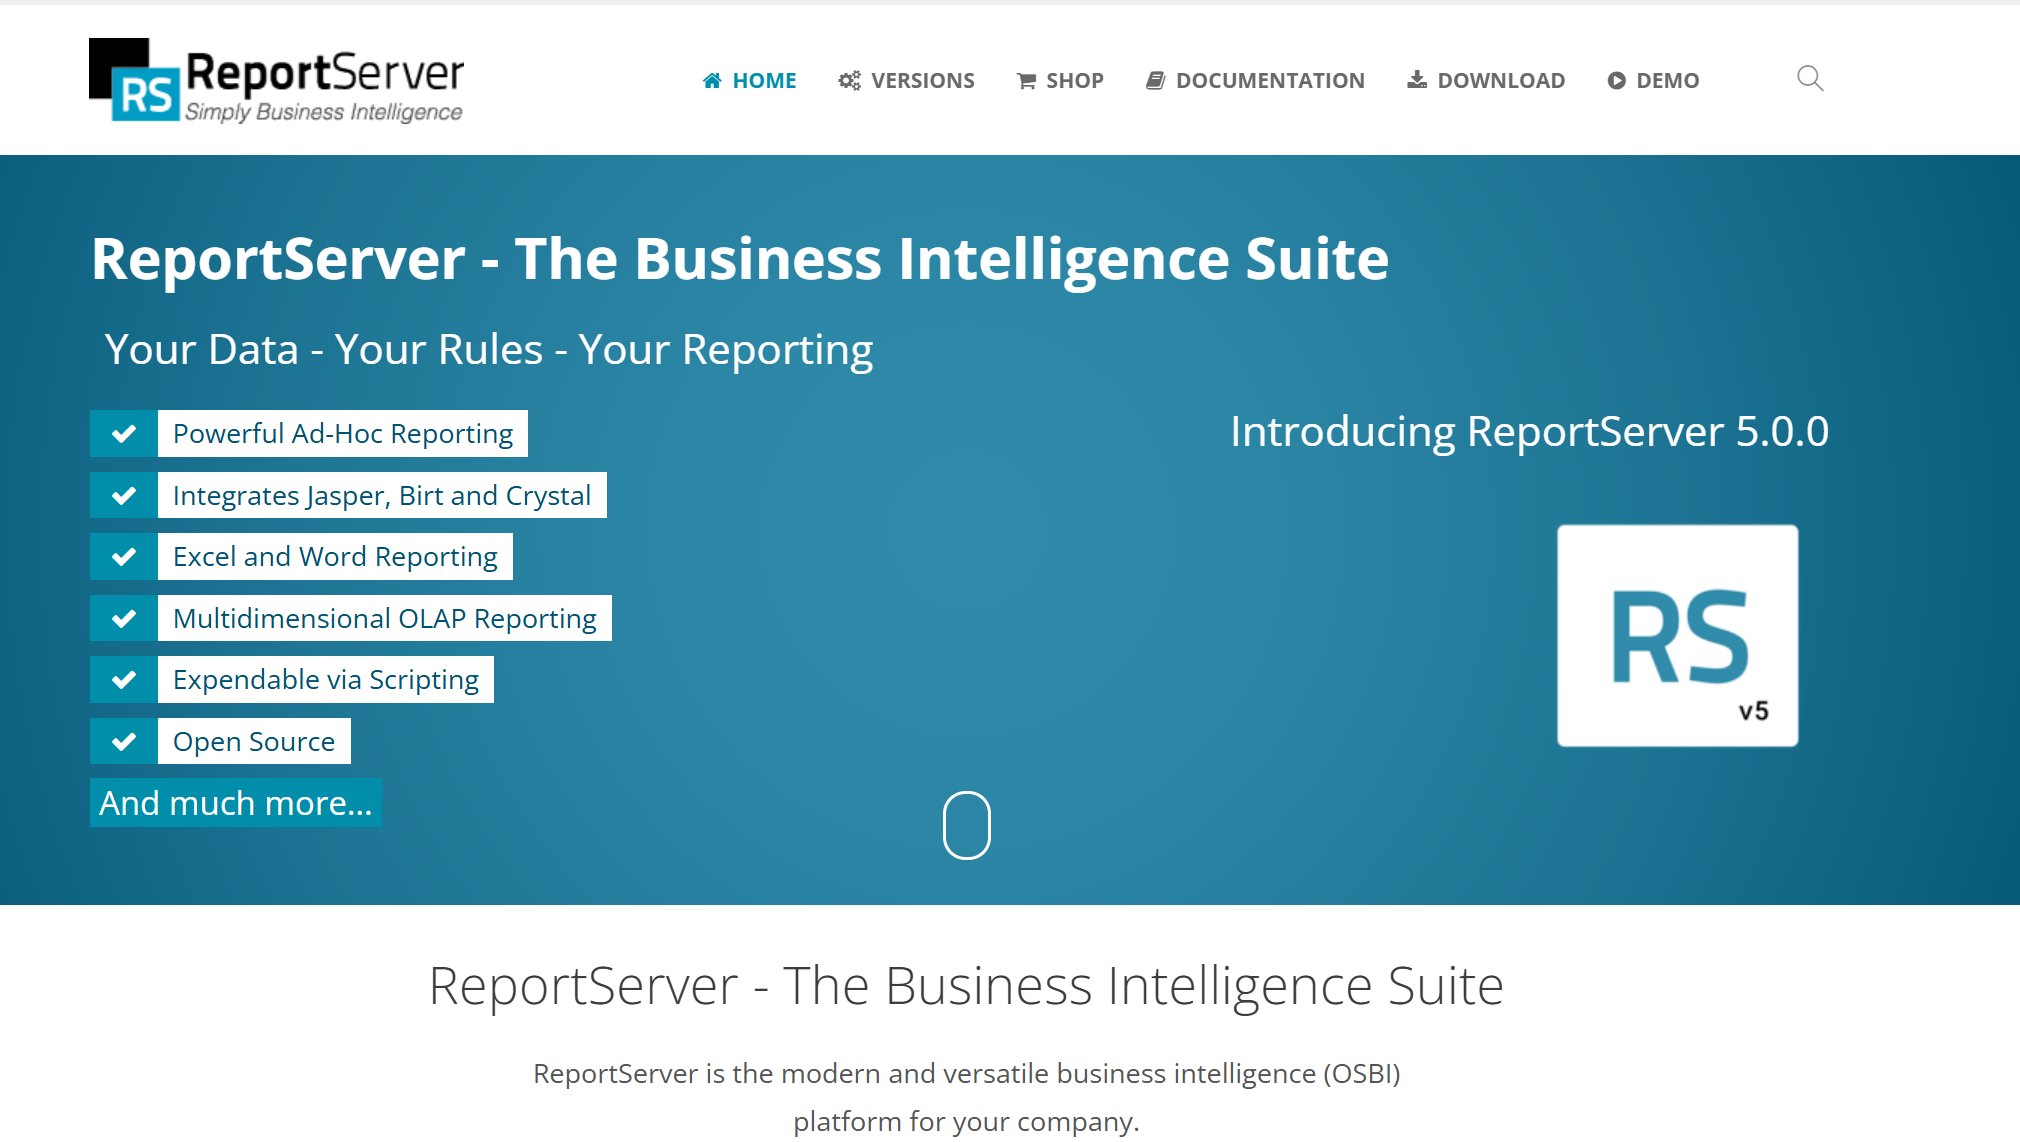
Tool #10: ReportServer Community
ReportServer Community is a versatile open-source reporting tool designed to meet the needs of businesses seeking a centralized platform for managing their reports. It offers a wide range of features that make it a valuable addition to your reporting toolkit. Whether you need to create detailed reports or manage existing ones, this tool provides the flexibility and functionality to streamline your processes.
Centralized Report Management: You can manage all your reports in one place, ensuring easy access and organization.
Multi-Engine Support: It integrates with popular reporting engines like JasperReports, Eclipse BIRT, and Crystal Reports, giving you the freedom to choose the best engine for your needs.
Dynamic Dashboards: The tool allows you to create interactive dashboards that provide real-time insights into your data.
Permission Control: Advanced permission settings ensure that only authorized users can access specific reports, enhancing data security.
Script-Based Customization: With scripting capabilities, you can customize reports to meet unique business requirements.
One of the standout features of ReportServer Community is its ability to support multiple reporting engines. This flexibility allows you to leverage the strengths of different engines without being tied to a single solution. For example, you can use JasperReports for pixel-perfect layouts and Eclipse BIRT for dynamic visualizations, all within the same platform.
Why Choose ReportServer Community?
You should consider ReportServer Community if you need a tool that combines power and flexibility. Its centralized management system simplifies the organization of your reports, saving you time and effort. The tool’s dynamic dashboards enable you to visualize data in real-time, helping you make informed decisions quickly. Additionally, its robust permission controls ensure that sensitive information remains secure.
Another advantage of ReportServer Community is its active user community. You can find extensive documentation, tutorials, and forums to help you get started and troubleshoot issues. This support network makes it easier to maximize the tool’s potential, even if you’re new to open-source reporting solutions.
Use Cases:
ReportServer Community is ideal for businesses of all sizes. Small businesses can use it to manage their reporting needs without incurring high costs, while larger organizations can benefit from its scalability and multi-engine support. For instance:
Retail: Track sales performance and inventory levels with real-time dashboards.
Finance: Generate detailed financial reports to monitor budgets and expenses.
Healthcare: Analyze patient data and operational metrics to improve efficiency.
By using ReportServer Community, you can centralize your reporting processes, enhance collaboration, and gain deeper insights into your data.
Tip: If you’re looking for a cost-effective way to manage multiple reports across different engines, ReportServer Community is an excellent choice.
Comparing Open Source Reporting Tools: Which One Is Right for You?
Feature Comparison
When comparing open source BI tools, understanding their features is crucial. Each tool offers unique capabilities tailored to different business needs. For instance,FineReport excels in creating pixel-perfect reports and supports real-time data analysis. Its drag-and-drop interface simplifies report creation, making it accessible to users with varying technical expertise. On the other hand, KNIME stands out for its data integration and machine learning capabilities, which are ideal for businesses focused on predictive analytics.
Apache Superset and Metabase prioritize reporting and visualization. Superset’s geospatial charts and plug-in architecture make it a strong choice for businesses requiring location-based insights. Metabase, with its no-SQL-required interface, caters to teams seeking simplicity in dashboard creation. Tools like JasperReports and Eclipse BIRT shine in producing highly customized, professional-grade reports, while ReportServer Community offers centralized report management with multi-engine support.
Each tool serves specific use cases, making it essential to match their strengths to your business needs. Here are some real-world scenarios:
A manufacturing company uses FineReport to monitor production efficiency and generate automated reports for lean management. Its real-time data capabilities ensure quick responses to operational changes.
A marketing team leverages KNIME to integrate data from multiple sources and build predictive models for customer targeting.
A retail business employs Metabase to create self-service dashboards, enabling store managers to track sales performance without technical assistance.
A financial institution relies on JasperReports to produce detailed financial reports with embedded formulas, ensuring accuracy and professionalism.
A healthcare organization uses ReportServer Community to centralize reporting across departments, improving collaboration and data security.
These examples highlight how businesses across industries use these tools to gain actionable insights and streamline operations.
Note: Tools like FineReport and Metabase are particularly effective for businesses seeking automated reporting tools that simplify workflows and enhance decision-making.
Open-source reporting tools empower you to transform raw data into actionable insights, making them indispensable for businesses in 2025. These tools offer cost-effective, scalable, and customizable solutions that adapt to your unique needs. When selecting the right tool, focus on essential criteria like cost, features, and scalability. Enterprise-grade solutions like FineReport provide robust reporting capabilities, helping you streamline operations and make informed decisions. Explore these options to find the perfect fit for your business and unlock the full potential of your data. Click the banner below to try FineReport for free and empower your enterprise to transform data into productivity!
Continue Reading about Open Source Reporting Tools
Real-time insights to optimize production, logistics, and decisions.
FAQ
What are the key advantages of using open source reporting tools?
Open source reporting tools offer cost savings, flexibility, and scalability. You can customize them to fit your business needs. They also integrate with various data sources and provide community support for troubleshooting and enhancements.
Can open source reporting tools handle large datasets?
Yes, many open source tools, such as FineReport and Apache Superset, are optimized for handling large datasets. They provide features like real-time data processing and advanced visualization, ensuring smooth performance even with high data volumes.
Are open source reporting tools secure for business use?
Open source tools are secure when implemented correctly. You can control access with advanced permission settings. Tools like FineReport offer robust security features, ensuring sensitive data remains protected.
How do I choose the right open source reporting tool for my business?
Evaluate your needs based on cost, features, scalability, and ease of use. Tools like FineReport excel in creating pixel-perfect reports, while Metabase is ideal for simple dashboards. Match the tool’s strengths to your business goals.
Do open source reporting tools require technical expertise?
Some tools, like Metabase, are user-friendly and require no coding. Others, such as KNIME, may need technical skills for advanced features. FineReport balances both, offering drag-and-drop functionality for beginners and advanced options for IT professionals.