Effective data reports drive business success by transforming raw numbers into actionable insights. You need business reports that are clear, actionable, and tailored to your audience. Studies show that companies using advanced data reporting see real gains in decision-making, cost reduction, and revenue growth. FineReport by FanRuan streamlines business reporting, making it simple to create a high-quality data report from multiple sources. With the importance of creating business reports growing, you can support informed decision-making and data-driven decisions. A well-built business report delivers actionable steps and supports business decisions with data-driven insights.
Every report here was built with FineReport—enterprise-grade reporting made simple.
Start your free trial and see how effortless data reporting can be.
You need to start every business report by setting clear objectives. This step guides your entire data reporting process. When you know what you want to achieve, you can collect the right data and focus your data analysis on what matters most. Setting objectives early helps you align your business report with your company’s goals. This alignment ensures that your report supports business decisions and drives business success.
Tip: Objectives tailored to your audience’s needs make your business report more focused and relevant.
Here are some reasons why defining objectives is crucial in business reporting:
If you want to know how to write a business report that truly makes an impact, always begin with clear objectives.
Understanding your audience is just as important as setting objectives. You must know who will read your business report. Different readers, such as executives, managers, or technical teams, need different information. When you tailor your business report to your audience, you make it more useful and actionable.
Market research shows that businesses use surveys and product tests to learn about their customers. By sampling target populations, companies gain insights into what their audience wants. This knowledge helps you create business reports that support strategic decisions and meet real needs.
Effective business reports start by identifying the report’s purpose and the specific audience. Adjusting the language, tone, and content ensures your business report is clear and relevant. This approach improves the quality and impact of your business reporting.
Note: The importance of creating business reports that match your audience’s needs cannot be overstated. Creating business reports with your audience in mind leads to better decisions and stronger results.
You need to collect accurate and relevant data to build strong business reports. Start by choosing the right methods for your goals. Many organizations use a mix of techniques to gather information from different sources. Here are some of the most effective ways:
You should also focus on collaboration between your data engineers and analysts. Automate data ingestion and schedule regular syncs to keep your data fresh. Standardize your data formats and set up style guides to maintain consistency. Always monitor data quality and set access controls to protect sensitive information. These steps help you achieve reliable data collection and analysis.
Tip: Regularly review your data pipelines and add tests to catch errors early. This practice improves efficiency and keeps your reporting tools accurate.
Once you have collected your data, you need to bring it together for analysis. FineReport by FanRuan makes this process simple and seamless. You can connect to many data sources, including databases, cloud storage, and external providers. FineReport’s drag-and-drop designer lets you build complex reports and dashboards without coding. You can automate data entry, approval workflows, and permission management to control who sees sensitive data.

FineReport works with FineDataLink to synchronize and harmonize data from different systems in real time. This ensures your reports always show the latest information. You can create interactive dashboards that combine data from sales, HR, finance, and more. FineReport supports mobile access, so you can view your reports on any device. This flexibility helps you make fast, data-driven decisions and improves efficiency across your organization.

Note: FineReport’s integration features support accurate data reporting and help you respond quickly to business changes.

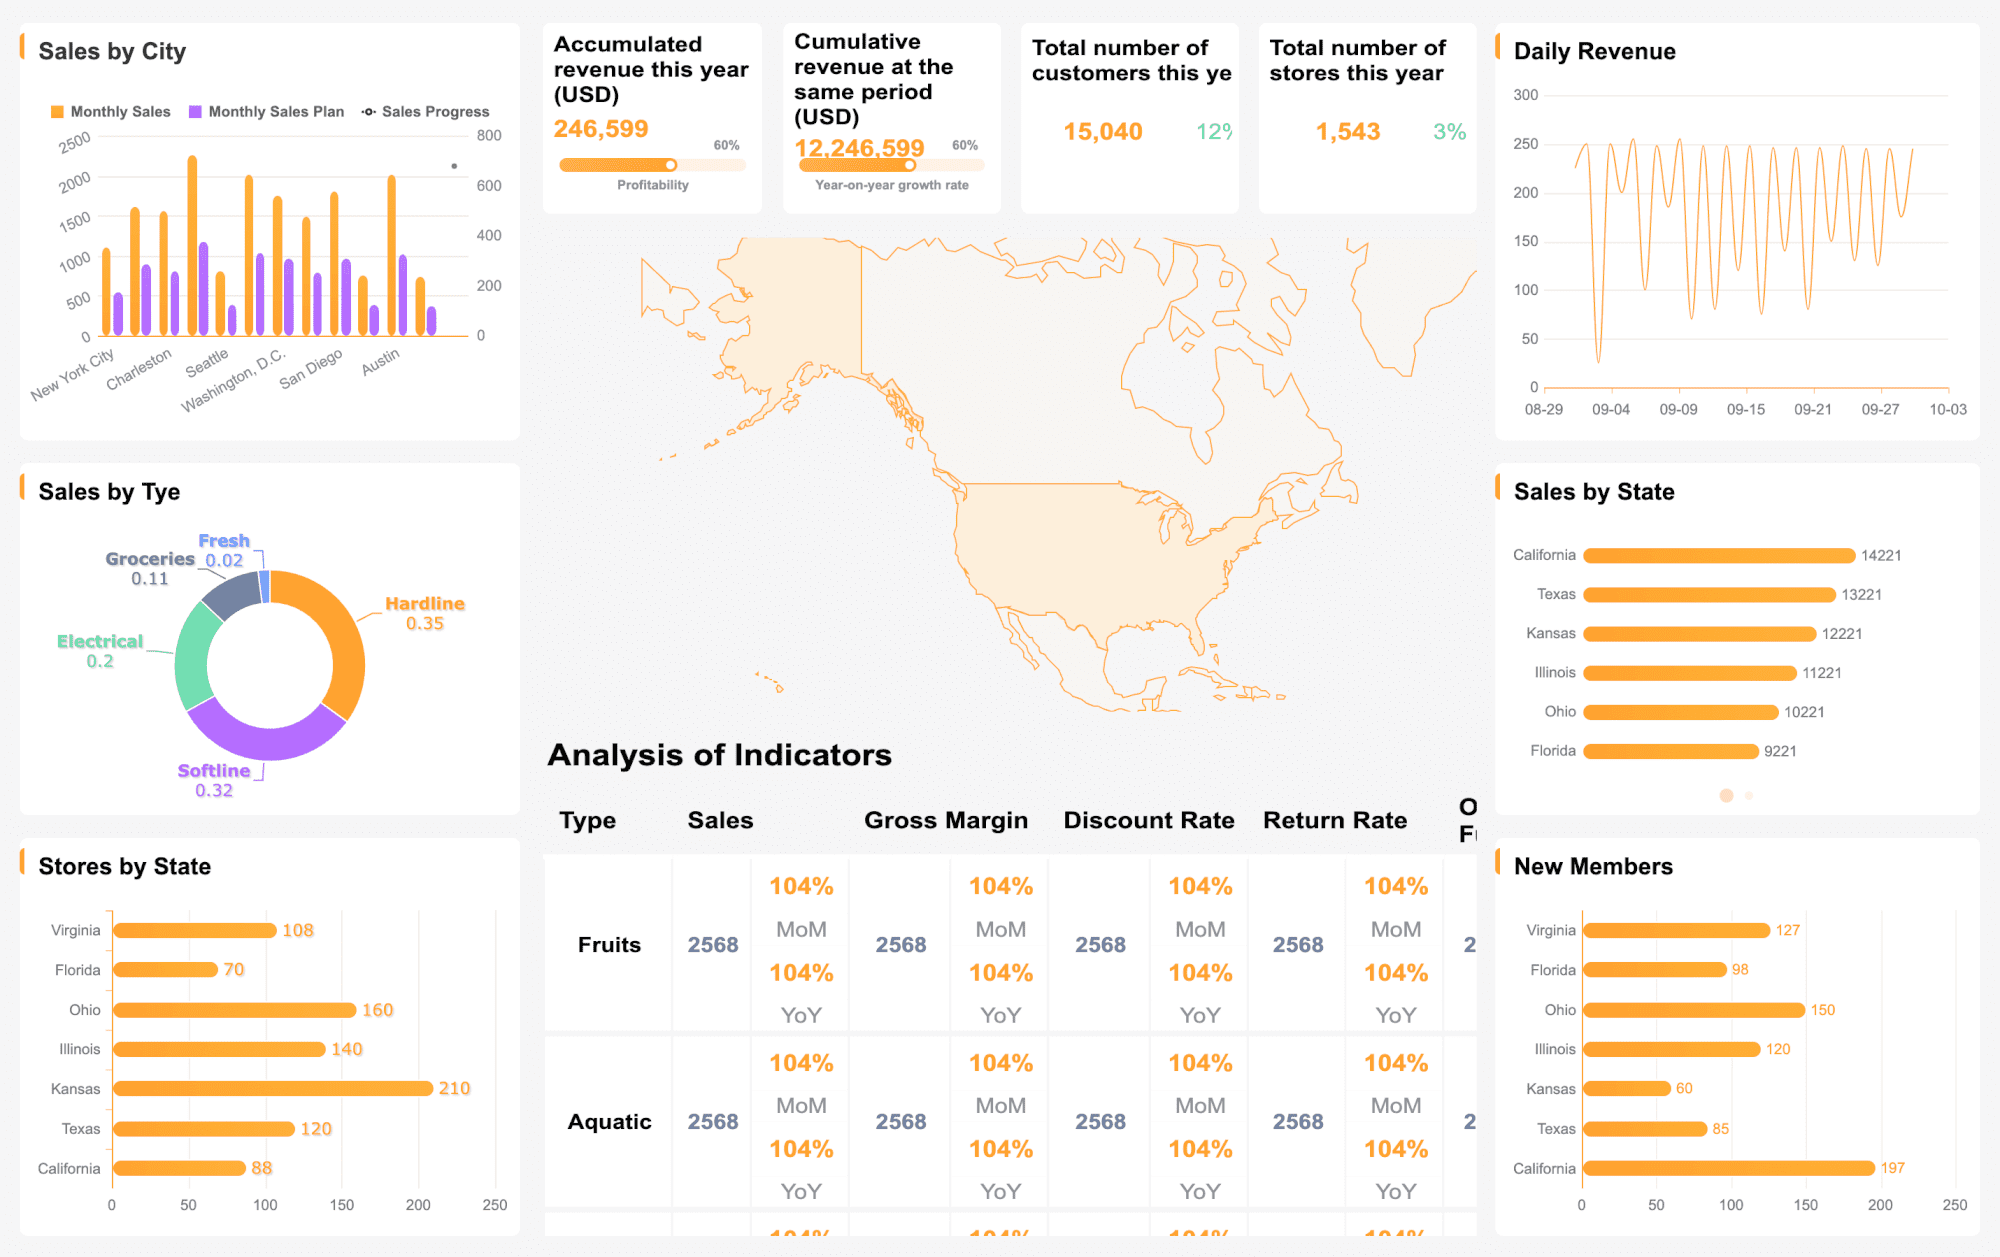
You need a strong structure to create effective data reports. FineReport gives you powerful tools to build business reports quickly and with high quality. You can use ready-made report templates to save time and keep your reports consistent. These templates help you follow best practices in report writing and make sure every business report looks professional.
FineReport offers several layout options. You can choose a normal report layout for simple tables or a multi-report layout to show many tables in one view. The dashboard layout lets you display charts, graphs, and key insights on one screen. You can also use mobile layouts to make your business reports easy to read on any device. These options help you present your data clearly and improve efficiency in your reporting process.
Tip: Try different layouts to see which one fits your business report best. A good layout makes your data easy to understand and helps your audience find important information fast.
Here is a table to help you choose the right layout for your business report:
| Layout Type | Best For | Example Use Case |
|---|---|---|
| Normal Report | Simple tables and lists | Sales summary |
| Multi-Report | Complex data with many tables | Financial and production reports |
| Dashboard | Visualizing key metrics and trends | Executive overview |
| Mobile Layout | Reports on phones and tablets | Field staff updates |
Using these templates and layouts, you can create effective business reports that support better decision-making and boost efficiency.
When you want to know how to write a business report, you need to include certain key sections. These sections help you organize your information and guide your readers through your findings. Every high-quality data report should have the following parts:
Note: When creating business reports, always check that each section is clear and easy to follow. This structure makes your report more effective and helps your audience act on your recommendations.
If you follow this structure, you will create effective business reports that drive results. FineReport makes it easy to build each section with its drag-and-drop tools and flexible templates. You can focus on your analysis and recommendations, not on formatting. This approach improves efficiency and helps you deliver business reports that support smart decisions.
Remember: Effective data reports are not just about numbers. They tell a story, highlight key insights, and offer clear recommendations that help your business grow. If you want to master how to write a business report, start with a strong structure and use the right tools.
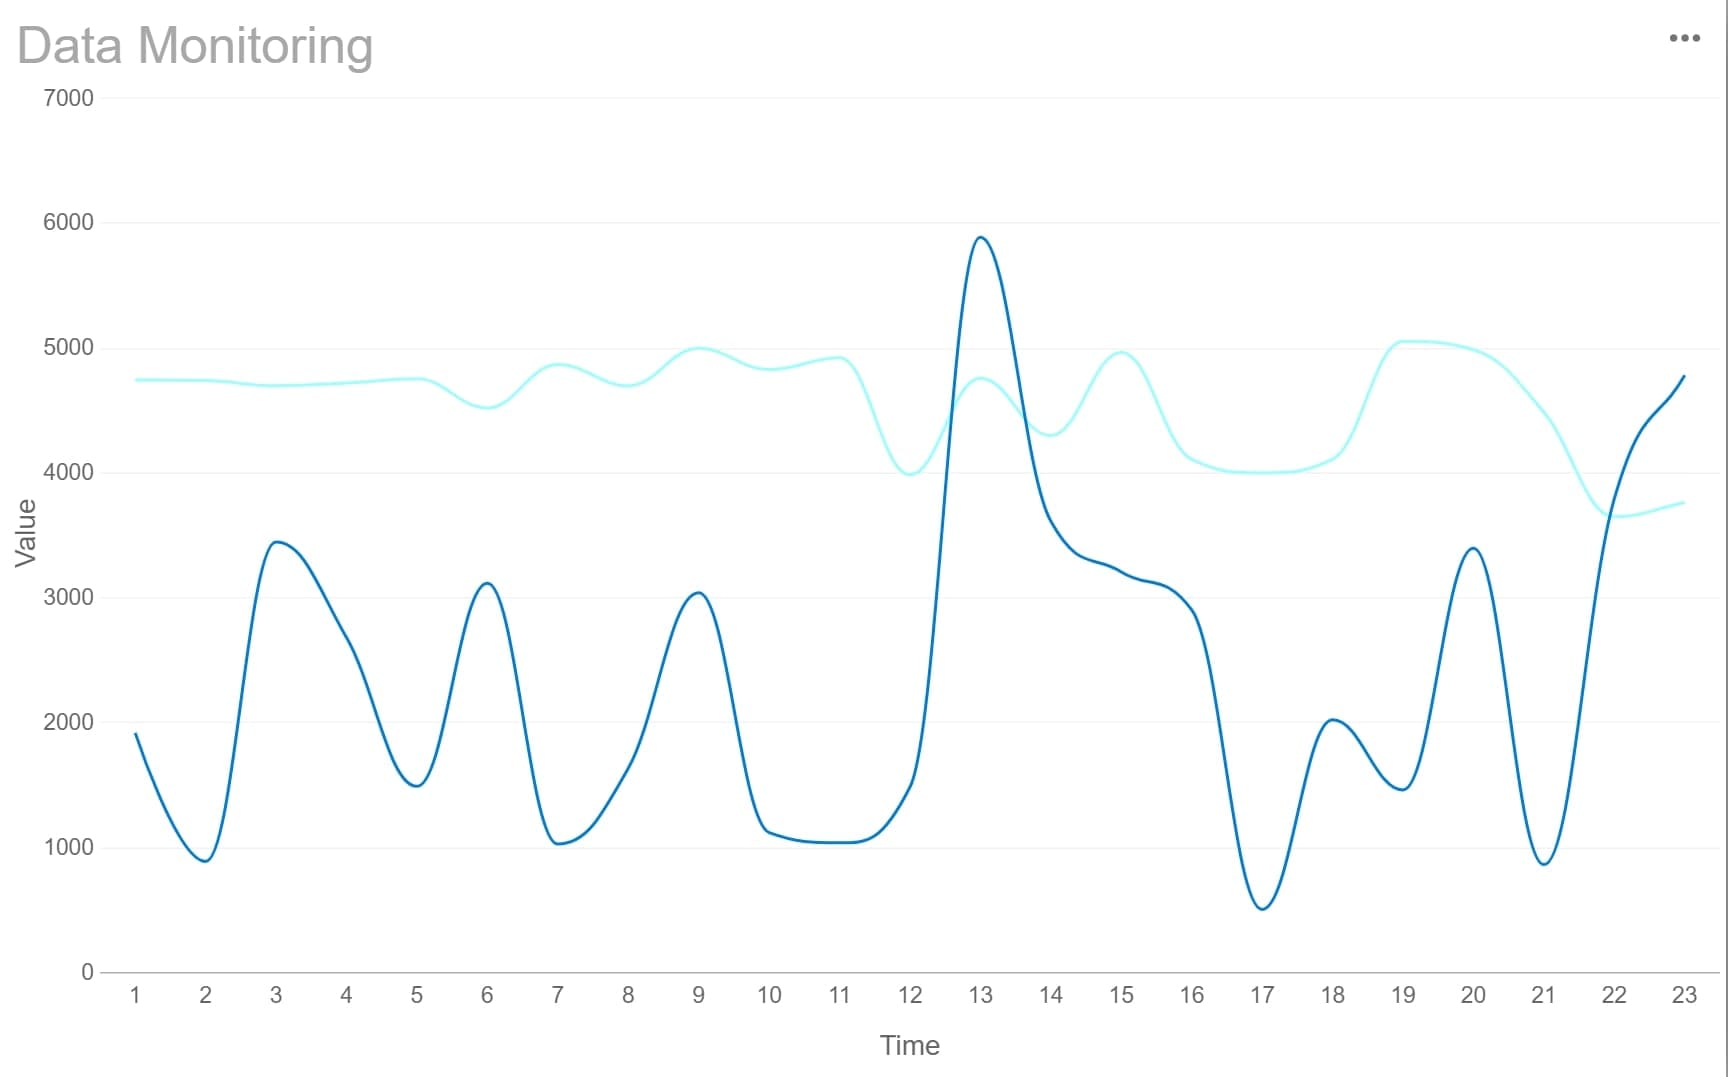
You need clear visuals to make your data easy to understand. Data visualisation tools help you turn complex numbers into charts, graphs, and dashboards. These visuals reveal patterns and trends that you might miss in raw data. When you use data visualisation, you can spot problems and opportunities faster.
Recent studies show that advanced data visualisation tools offer many benefits:
FineReport gives you a wide range of data visualisation options. You can create interactive reports with drag-and-drop tools. These interactive reports let users explore data by clicking, filtering, and drilling down into details. You can build dashboards that show key metrics at a glance. FineReport also supports 3D charts and animated visuals, making your reports even more engaging.
Tip: Use interactive reports to let your team dig deeper into the data and find answers fast.
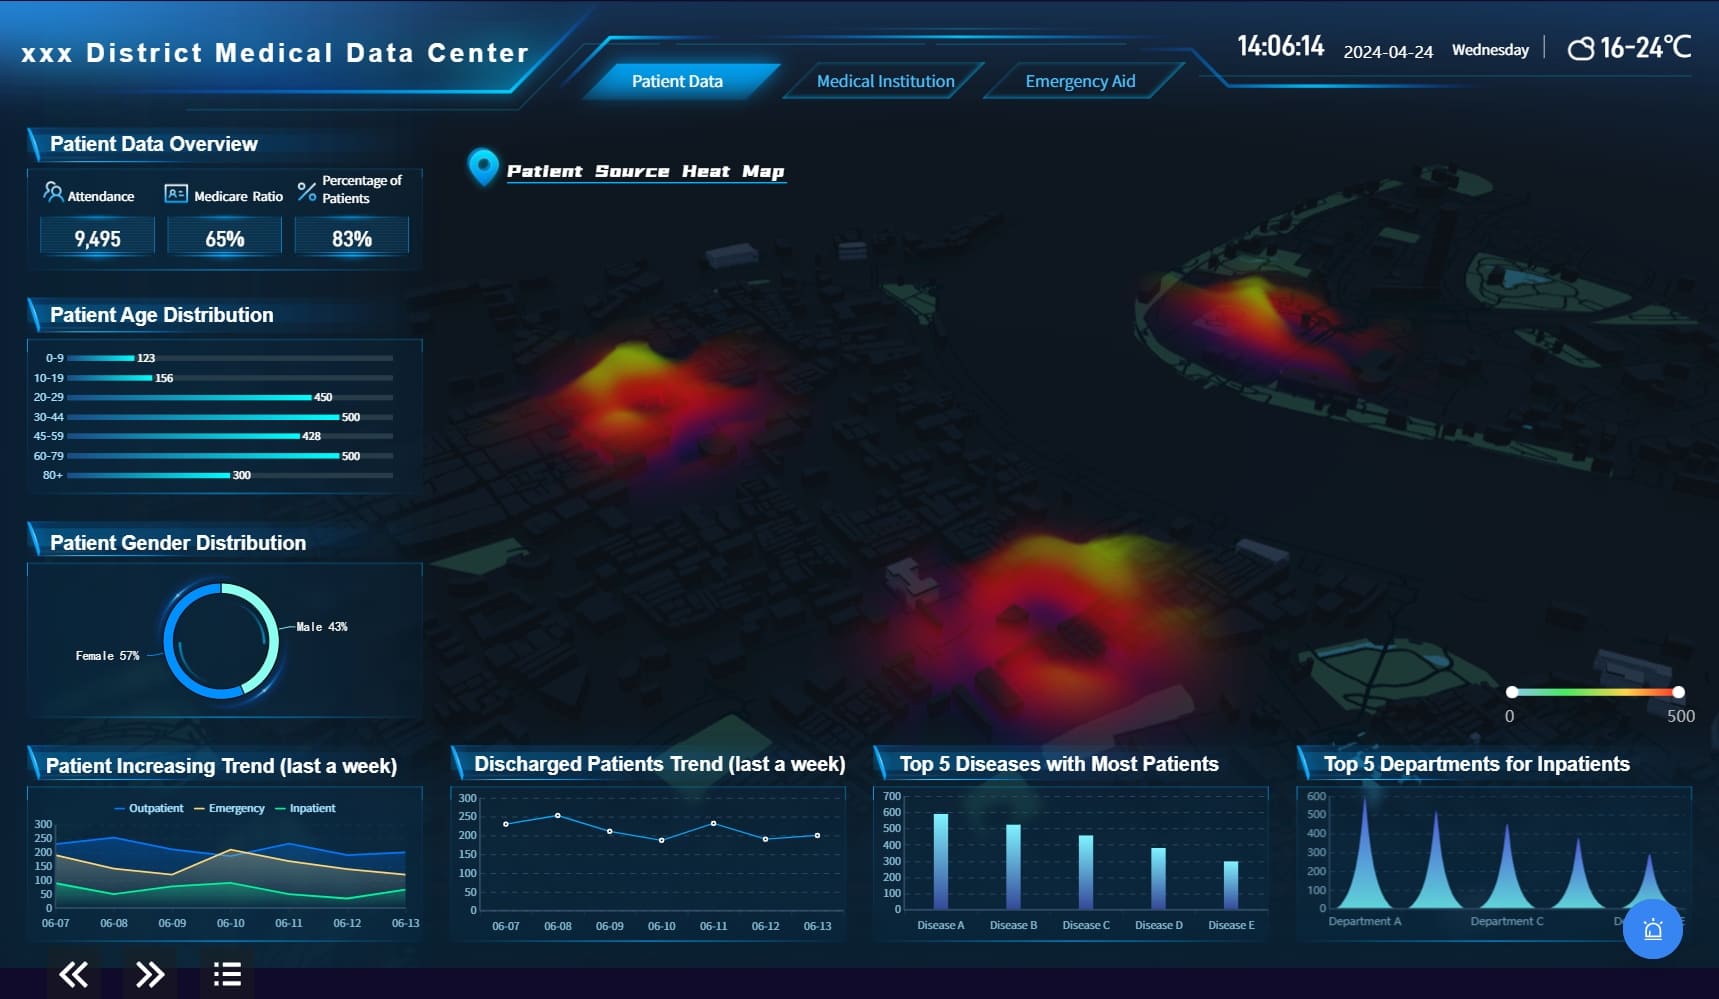
You need access to your data wherever you go. Mobile and dashboard reporting make this possible. With FineReport, you can view interactive reports and dashboards on your phone, tablet, or computer. The responsive design ensures your data visualisation looks great on any device.
Mobile dashboards help you monitor business performance in real time. You can set up alerts and notifications, so you never miss important changes. Many organizations now use mobile and AI-driven dashboards to boost productivity and decision-making speed. For example, companies that use mobile dashboards report faster insight generation and improved operational agility.
FineReport’s mobile features let you create interactive reports that update in real time. You can customize dashboards for different roles, so each user sees the most relevant data. This flexibility supports effective business reports and helps your team stay informed and ready to act.
You need to make sure your business report is accurate and clear before you share it. Careful proofreading and feedback help you avoid mistakes and improve the quality of your business reports. Start by checking your data sources. Use only reliable and up-to-date information. Always document where your data comes from. Next, review your assumptions and estimates. Make sure they are realistic and based on expert advice. Explain how these choices affect your business report.
Use simple language and clear visuals. Avoid jargon so everyone can understand your findings. Go through your business report step by step. Check for errors in numbers, charts, and written content. Cross-reference your data with the original sources. Use checklists and data validation tools to catch mistakes. Ask colleagues or experts to review your business report. Their feedback can help you spot issues you missed. Test your business report with different scenarios to see if your conclusions hold up. These steps make your business reports more trustworthy and useful for decision-making.
Once your business report is ready, you need to share it with the right people. FineReport makes this easy with powerful automation features. You can schedule business reports to go out daily, weekly, or monthly. This ensures everyone gets the latest information on time. FineReport lets you control who can see each business report. You can set permissions so only the right users access sensitive data.
With FineReport, you can distribute business reports by email, mobile app, or web portal. The system tracks who receives and opens each business report. This helps you make sure your team stays informed. Automation saves you time and reduces errors in business reporting. You can focus on analyzing results instead of sending out reports manually. By using these tools, you keep your business reporting process efficient and secure.
You can drive business success by following clear steps for data reporting. Define objectives, know your audience, gather accurate data, and use structured layouts. FineReport by FanRuan helps you create reports that support informed decision-making and deliver key insights. Many companies, from retail to airlines, use structured reports to improve decision-making and make better business decisions. When you apply these best practices, you gain recommendations that lead to informed decision-making and data-driven decisions. Start building smarter reports today.
What is an Analysis Report and Why Does It Matter

The Author
Lewis
Senior Data Analyst at FanRuan
Related Articles

10 Custom Reporting Dashboard Tools Compared: Features, Limits, and Best-Fit Use Cases
Compare 10 custom reporting dashboard tools on features, limits, and best-fit use cases.
Lewis Chou
May 03, 2026

10 Best Dashboard Reporting Tools for 2026 Compared: Power BI, Tableau, Looker Studio, and More
Dashboard reporting tools are software platforms that turn business data into interactive dashboards, scheduled reports, and decision ready insights.
Lewis Chou
Apr 27, 2026

How to create an HTML report from scratch in 2026
Build an html report from scratch in 2026 with easy steps, tools, and tips for customization, sharing, and making your data clear and interactive.
Lewis Chou
Mar 23, 2026


