A research report gives you a clear summary of findings from a research project. You use a research report to share results, explain methods, and present evidence. In school, business, or daily life, you often rely on research to make choices. This type of report helps you turn raw research into useful knowledge. When you understand how to read or create a research report, you gain the power to use knowledge for real-world decisions. Professionals and students both benefit from strong research and reporting skills.
A research report is a structured document that presents the results of an investigation, study, or analysis on a specific topic. It includes clear objectives, methodology, data findings, and conclusions. The purpose of a research report is to communicate insights and support informed decision-making based on evidence. You use a research report to present the results of a research project in a clear and concise manner. This document gives you a structured way to share objectives, methods, findings, and recommendations. When you create a research report, you organize complex information so others can understand and use it.
A research report helps you turn raw data into useful knowledge. You can use it to communicate your research process, explain your analysis, and support your conclusions.
The table below shows the most widely accepted definitions and features of a research report:
| Aspect | Description |
|---|---|
| Definition | A research report is a written document presenting a comprehensive overview of a specific research project or topic, structured to communicate objectives, methodology, findings, analysis, conclusions, and recommendations. |
| Typical Structure | Abstract, Introduction, Methodology, Results/Findings, Analysis, Conclusions, Recommendations. |
| Purpose | To present findings and analyses from scientific or academic research clearly and logically, supporting decision-making or advancing knowledge. |
| Distinction | Different from business, technical, progress, academic, feasibility, analytical, compliance, and recommendation reports by its focus on research outcomes. |
| Key Characteristics | Clarity, transparency, logical organization, and evidence-based conclusions. |
When you work in business or industry, you often need to create research reports that handle large datasets and integrate information from many sources. FanRuan and FineReport make this process easier for you. FineReport gives you a user-friendly, Excel-like interface. You can design custom reports, connect to multiple data sources, and build interactive dashboards. These tools help you analyze data, track key performance indicators, and review performance efficiently. You do not need advanced programming skills to use FineReport, so you can focus on sharing your research and knowledge.

When you create a research report, you need to include certain key components. These features of a research report help you organize your work and make your research easy to understand. Most academic research reports and business reports follow a similar structure. Here are the main sections you should include:
Tip: Use clear headings and a logical order. This helps your readers follow your research from start to finish.
FineReport by FanRuan makes it easy for you to design and organize these key components of a research report. You can use its drag-and-drop interface to build each section. FineReport lets you connect to many data sources, so you can gather and present information in one place. You can also create dashboards and visual reports that help you communicate complex data to different audiences. If you need to share your research with your team or stakeholders, FineReport allows you to customize and distribute your reports quickly.

The best research reports do more than just list facts. They help you communicate complex data and turn it into useful insights. Here are the features of a research report that make it effective:
FineReport helps you achieve these qualities. You can visualize your data, automate report creation, and tailor your reports for different readers. This makes communicating research findings faster and more reliable. With FineReport, you can focus on your research while the platform handles the design and presentation.
When you work with research, you will find that not all reports look the same. Different situations call for different types of research reports. Each type has its own structure and purpose. Let’s look at the main categories and see how you can use FineReport to make your work easier.
You often use business and industry research reports to support decisions in your company. These reports help you understand markets, track performance, and plan strategies. For example, marketing teams use research to study customer buying habits before launching a new product. You might also analyze competitors or look at industry trends to find new opportunities.
Here is a table showing common types of research reports in business and their typical uses:
| Report Type | Typical Use Cases |
|---|---|
| Informational Reports | Track monthly or yearly performance without deep analysis. |
| Analytical Reports | Combine data and insights to solve problems and make recommendations. |
| Product Reports | Monitor sales, inventory, and customer feedback for product improvement. |
| Department Reports | Measure team performance and guide training or resource planning. |
| Progress Reports | Update project status and track milestones or KPIs. |
| Internal Reports | Share important data within your organization. |
| External Reports | Communicate with clients, investors, or regulators for accountability. |
| Industry Reports | Focus on industry-wide trends and help optimize business processes. |
You can use FineReport to create all these types of research reports. FineReport lets you collect data from many sources, design dashboards, and build reports that fit your needs. You can display your research on desktops, mobile devices, or large screens. This flexibility helps you share research analysis with both employees and leaders.

Tip: Use dashboards in FineReport to visualize key metrics and trends for quick decision-making.
Technical and scientific research reports follow a strict format. You use them to present detailed findings from experiments, feasibility studies, or technical projects. These reports include sections like introduction, methodology, results, and appendices. For example, you might write a technical report on renewable energy, showing your methods and results step by step.
Key features of technical and scientific research reports:
You can use FineReport to connect to Excel files, databases, and other sources. FineReport lets you write SQL queries, visualize complex data, and even connect with other BI tools. This makes it easy for you to create technical research reports with advanced charts and tables. You can also use FineReport to build interactive dashboards for scientific data.
Sometimes, you need research that is unique to your business. Custom research reports help you collect and analyze data for special projects, new products, or specific market segments. You might use surveys, interviews, or focus groups to gather new information. These reports give you both numbers and opinions, helping you make real-time decisions.
FineReport gives you powerful tools to create custom research reports:

You can automate report delivery, control access, and scale your research as your business grows. FineReport helps you turn unique research into clear, actionable insights.
Note: Custom research reports are perfect when you need answers that standard reports cannot provide.
By understanding the types of research reports and using FineReport, you can handle any research challenge. You will be ready to present your findings, support decisions, and drive your organization forward.
When you look at the importance of a research report, you see how it shapes the way people make decisions and stay accountable. In every field—business, academia, or industry—research reports help you turn information into action. They give you a way to organize facts, share findings, and build trust with others. You use research to solve problems, improve systems, and contribute to knowledge in your area.
You rely on research reports to guide your choices. When you face a tough decision, you want clear facts and strong evidence. A research report gives you this support. It takes raw data and turns it into useful knowledge. This process helps you see patterns, compare options, and choose the best path forward.
A research report does more than just give you facts. It connects evidence to real problems. You use an "evidence plus context" approach, which means you match the right research to your situation. You look at your goals, find the best evidence, and think about what matters most in your setting. Organizations that use research well have a clear, honest way to gather and apply findings. This helps you make choices that are smart and fair.
FanRuan’s solutions show how impactful research reports can be in real life. For example, in manufacturing, you can use FineReport for intelligent inspection. This tool lets you collect and analyze quality data in real time. You spot problems early, fix them fast, and keep your products safe. In lean production, you use research reports to track costs, improve efficiency, and make sure every step adds value. FineReport helps you see where you can save time or resources. In EHS management, you use research to monitor safety, health, and the environment. You keep your workplace safe and meet all rules by using clear, up-to-date reports.
Tip: When you use research reports that are tailored to your needs, you make decisions that are faster, smarter, and more reliable.
You also use research reports to stay accountable. Accountability means you set clear goals, track your progress, and show results. A research report helps you do this by recording what you did, what you found, and what you plan to do next. You build trust with your team, your leaders, and your community when you share your research openly.
Case studies from different places show that research reports help organizations see the big picture. You can link your daily work to larger goals, like serving your community or protecting the environment. For example, in FanRuan’s EHS management solution, you use research reports to track safety incidents and health checks. You see where you need to improve and show your progress to everyone involved. In lean production, you use reports to monitor every step and make sure you meet high standards. This kind of reporting helps you learn from mistakes, celebrate wins, and keep getting better.
Note: When you use research reports for accountability, you create a culture of honesty, learning, and trust.
The importance of a research report goes beyond just sharing facts. You use it to make decisions, stay accountable, and keep improving. By using tools like FineReport from FanRuan, you turn research into real results. You help your organization grow, build trust, and keep contributing to knowledge in your field.
When you start writing a research report, you need a clear plan. Good planning helps you stay organized and focused. If you want to know how to write a research paper, begin by choosing a topic that interests you. Make sure your topic is not too broad or too narrow. Once you have your topic, gather background information. This step helps you understand what others have already discovered.
Follow these steps to plan your research:
These steps will help you build a strong foundation for writing a research report. If you follow them, you will find the process much easier.
Tip: Always keep your notes and sources organized. This will save you time when you start writing research reports.
Clear organization makes your research easy to read. When you organize your information, you help your reader follow your ideas. Most research reports use a structure called IMRD/C: Introduction, Methods, Results, and Discussion/Conclusion. Each section has a purpose. The introduction explains your research question. The methods section tells how you did your research. The results section shows what you found. The discussion or conclusion explains what your findings mean.
Here are some tips for writing research reports that are clear and well-organized:
If you want to know how to write a research paper that stands out, focus on structure and clarity. Present your themes early and use matching headers. Keep related information close together. Label your tables and figures clearly. This approach will make your research report easy to follow.
Drafting is when you put your ideas into sentences and paragraphs. Do not worry about making everything perfect at first. Just get your thoughts down on paper. After you finish your draft, take time to revise. Editing is a key part of writing a research report. You should check for spelling, grammar, and punctuation errors. Remove extra words and use active voice. Vary your sentence structure to keep your reader interested.
Follow these steps for effective drafting and revising:
Remember, writing research reports is a process. You may need to go through several drafts before your report is ready. Careful editing shows that you pay attention to detail and care about your work.
Note: Good revision can turn an average report into an excellent one. Always review your work before you submit it.
When you start writing a research report, you want a tool that makes your job easier. FineReport gives you everything you need to create clear, organized, and professional reports. You do not need to be a tech expert to use it. The platform has an Excel-like interface, so you can get started quickly.
FineReport helps you at every stage of writing a research report. You can connect to many data sources, such as Excel files, databases, or cloud storage. This means you can gather all your research data in one place. You do not have to switch between different programs. FineReport lets you drag and drop data fields into your report. You can build tables, charts, and dashboards with just a few clicks.
Tip: Use the drag-and-drop designer to arrange your report sections. This keeps your information organized and easy to follow.
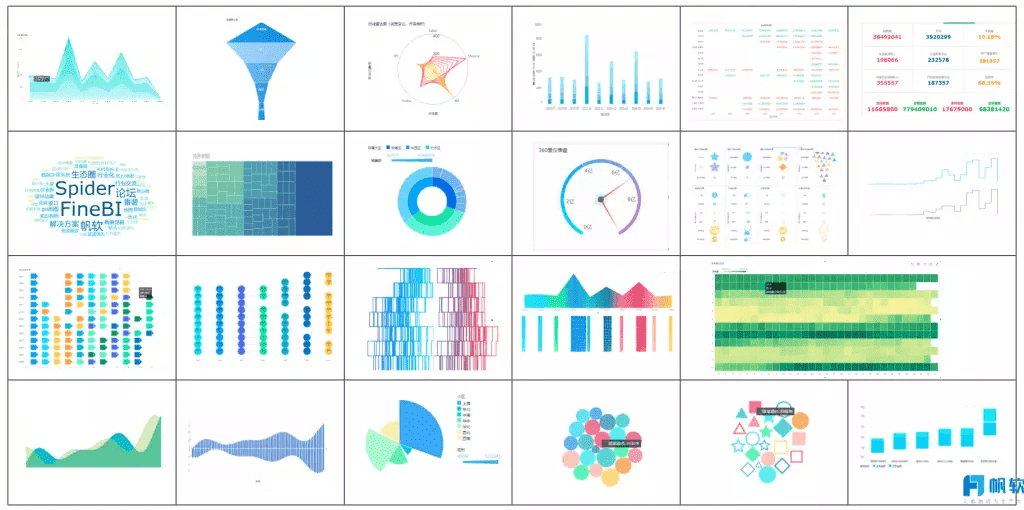
You can also use FineReport to add visuals. Charts and graphs help your readers understand your findings. You can choose from over 70 chart styles. If you want to show trends or compare results, use line graphs or bar charts. For detailed analysis, try pie charts or scatter plots. FineReport makes it simple to add these visuals to your report.
When you need to share your research, FineReport offers many options. You can export your report as a PDF, Excel file, or Word document. You can also schedule automatic report delivery. This means your team or audience always gets the latest version on time.
FineReport helps you target the right audience. You can customize your report layout for different readers. For example, you can create a summary for managers and a detailed report for analysts. You can also set permissions, so only the right people see sensitive data.
If you want to save time while writing research reports, use FineReport’s automation features. You can set up templates for common report types. You can also use parameter queries to filter data and focus on what matters most.
Note: FineReport supports mobile access. You can view and share your research reports on your phone or tablet, making it easy to stay connected anywhere.
With FineReport, you turn complex data into clear, useful insights. You make writing a research report faster, more accurate, and more effective.
You see the power of research in manufacturing every day. When you use research reports, you can spot problems early and improve your processes. For example, companies like Toyota have used AI-powered inspection to reduce defect rates by 91%. This shows how research and technology work together to boost quality. John Deere uses automated quality control to find defects faster and increase production speed. These improvements come from turning research into real actions.
FineReport helps you bring this knowledge to your own factory. You can connect data from machines, inspections, and production lines. The platform lets you build dashboards that show real-time performance. You can track trends, spot bottlenecks, and make quick decisions. With FineReport, you use research to cut waste, improve safety, and keep your products at a high standard.
When you use research reports with FineReport, you turn raw data into knowledge that drives better results.
In finance, research reports help you manage risk and follow rules. Banks and financial companies use research to understand market changes and avoid losses. For example, studies show that fintech adoption lowers the risk of stock price crashes by easing financial pressure. Other research proves that digital tools help companies price credit risk better and improve compliance.
FineReport gives you the tools to create clear, accurate research reports for finance. You can track trends, compare revenue over time, and predict future risks. The drag-and-drop design makes it easy to build reports and dashboards. You can combine data from different sources, check for errors, and share insights with your team. FineReport helps you use research to make smarter choices and stay ahead of problems.

Use research reports to turn complex financial data into knowledge you can trust.
Business intelligence (BI) uses research to help you make better business decisions. Companies use BI to find patterns, predict sales, and improve operations. For example, a retailer used BI to match sales data with weather reports. This helped them stock more gloves before snowstorms, which increased sales. Universities use BI to give staff fast access to data, making it easier to plan and budget.
FineReport supports your BI needs by letting you create interactive dashboards and reports. You can monitor key performance indicators, track sales, and spot trends. The platform helps you automate reporting, saving you time and reducing mistakes. With FineReport, you use research to turn information into knowledge that guides your business forward.

With FineReport, you unlock the full value of your research and turn knowledge into action.
You now know that a research report turns complex data into clear, useful knowledge. Mastering research report creation helps you succeed in your career and supports your organization’s growth.
Click the banner below to try FineReport for free and empower your enterprise to transform data into productivity!


The Author
Lewis
Senior Data Analyst at FanRuan
Related Articles

10 Custom Reporting Dashboard Tools Compared: Features, Limits, and Best-Fit Use Cases
Compare 10 custom reporting dashboard tools on features, limits, and best-fit use cases.
Lewis Chou
May 03, 2026

10 Best Dashboard Reporting Tools for 2026 Compared: Power BI, Tableau, Looker Studio, and More
Dashboard reporting tools are software platforms that turn business data into interactive dashboards, scheduled reports, and decision ready insights.
Lewis Chou
Apr 27, 2026
How to create an HTML report from scratch in 2026
Build an html report from scratch in 2026 with easy steps, tools, and tips for customization, sharing, and making your data clear and interactive.
Lewis Chou
Mar 23, 2026


