A project management dashboard serves as your command center, offering a clear view of project progress, resource allocation, and team performance. In Malaysia, these dashboards have become indispensable. Businesses in Malaysia face challenges like real-time tracking, efficient collaboration, and minimizing manual work.
These challenges highlight why real-time insights, automation, and integration are now critical for an effective project management dashboard in Malaysia.
The data panel and system construction of the cases in this article are implemented by FanRuan's products. Click the button below to use the functions of the latest version of FanRuan's products for free, come and try it!
A project management dashboard simplifies project tracking by consolidating all essential metrics into one centralized platform. This eliminates the need to switch between multiple tools, saving time and reducing confusion. For example, a centralized project dashboard gathers project status updates, KPIs, and deadlines in one place, enabling you to make informed decisions quickly.
Dashboards also providereal-time updates, ensuring you stay informed about project performance in Malaysia. This allows you to identify risks early and address them before they escalate. A study showed that using dashboards reduced report generation time by 80%, enabling faster decision-making.
Effective Decision-making Platform Created by FineReport (click to engage)
Automation is a game-changer for project management. Dashboards automate repetitive tasks like report generation and data updates, freeing up time for more strategic activities in Malaysia. For example, FineReportautomates scheduled reporting, ensuring stakeholders receive updates without manual intervention.
Real-time updates keep you informed about project status in Malaysia, allowing you to adapt quickly to changes. This adaptability improves efficiency and reduces delays. A recent analysis revealed that dashboards increased project success rates in Malaysia by 60% due to better tracking and timely adjustments.
By integrating automation and real-time updates, dashboards not only save time but also enhance productivity, ensuring your projects in Malaysia stay on track.
Adapting to the fast-paced, tech-driven work environment in Malaysia
The workplace in Malaysia demands agility and adaptability. Rapid technological advancements and the need for real-time decision-making have transformed how you manage projects in Malaysia. A project management dashboard becomes your essential tool to thrive in this dynamic environment in Malaysia.
Modern dashboards empower you to analyze data instantly. They provide insights into production performance, quality metrics, and resource utilization. This real-time analysis ensures you can respond quickly to challenges and opportunities. For example, when production delays occur, dashboards help you identify the root cause and take corrective action immediately.
In Malaysia, staying competitive means embracing technology that simplifies complexity. A project management dashboard equips you with the tools to adapt, innovate, and excel in a fast-paced world.
Key Features of an Effective Project Management Dashboard
Real-time data visualization
An effective project management dashboard thrives on real-time data visualization. This feature ensures you always have the latest updates at your fingertips in Malaysia. Imagine tracking project progress, resource allocation, and task completion without delays. Real-time dataempowers you to make informed decisions instantly, reducing risks and improving outcomes in Malaysia.
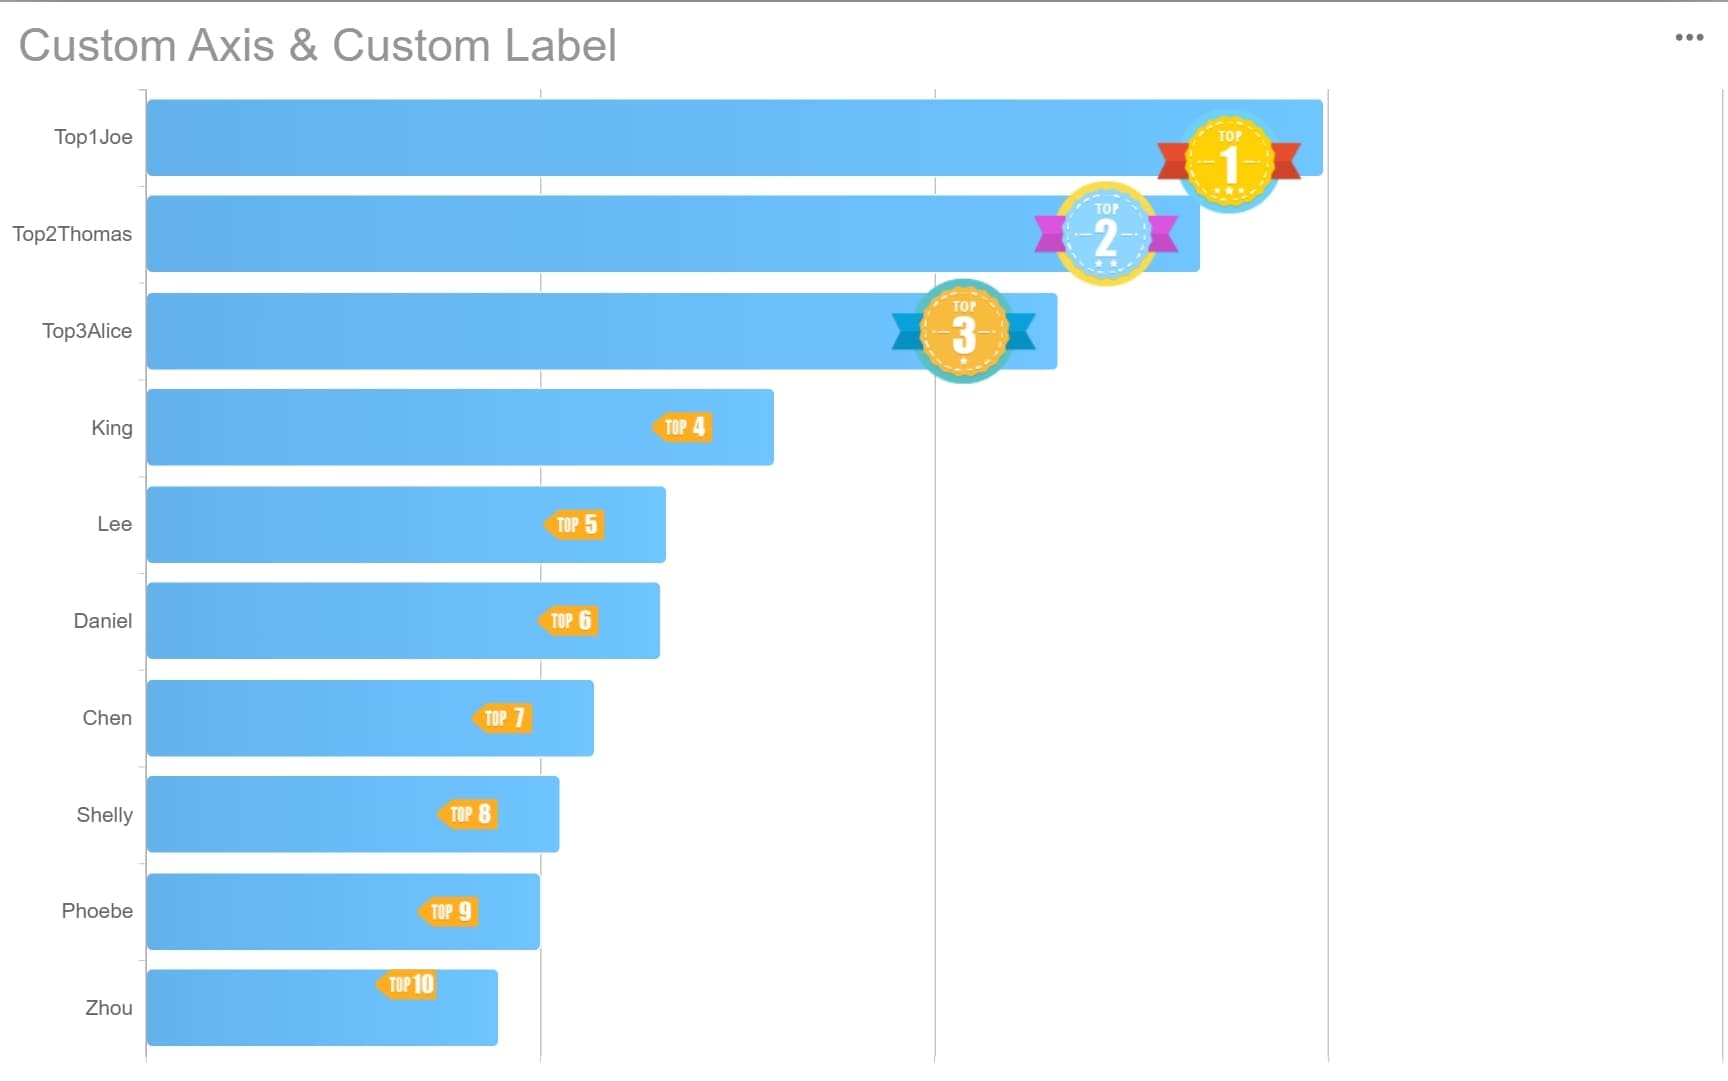
Real-time Data Visualization Created by FineReport
Visual indicators like charts, graphs, and heatmaps simplify complex data. They allow you to grasp trends and project health at a glance. For example, a bar chartcan show task completion rates, while a line graph can highlight budget trends over time. These visual tools make it easier to identify bottlenecks and opportunities.
Real-time project data also enhances communication with stakeholders in Malaysia. When everyone sees the same up-to-date information, misunderstandings decrease, and collaboration improves. A project performance dashboard with real-time updates ensures your team in Malaysia stays aligned and focused on shared goals.
Integration with tools like FineReport and FineBI
Integration is the backbone of an effective project management dashboard. Tools like Finereport and FineBI enable you to integrate real-time data sources seamlessly. This ensures your dashboard pulls accurate and up-to-date information from various systems, eliminating the need for manualdata entry.
FineReport excels in creating pixel-perfect reports and dashboards. Its drag-and-dropinterface simplifies the process, allowing you to design visually appealing layouts. It also supports automated reporting, ensuring stakeholders receive updates on time.
FineBI, on the other hand, focuses onself-service analytics. It empowers you to explore data independently, uncover insights, and share findings with your team in Malaysia. Its robust data integrationcapabilities allow you to consolidate information from multiple sources, providing a unified view of your project.
In Malaysia, both FineReport and FineBI are supported by a dedicated local team, providing localized project implementation and technical support to ensure seamless deployment and optimized performance tailored to Malaysian enterprises.
By integrating these tools, you enhance your dashboard's functionality and efficiency. You can automate data updates, visualize complex metrics, and collaborate more effectively. This not only saves time but also ensures your projects in Malaysia stay on track and within budget.
Automated reporting and alerts
Automated reportingand alerts save you time and keep your projects in Malaysia on track. Instead of manually compiling reports, your dashboard can generate them automatically based on predefined schedules. This feature ensures stakeholders receive updates consistently, freeing you to focus on strategic tasks.
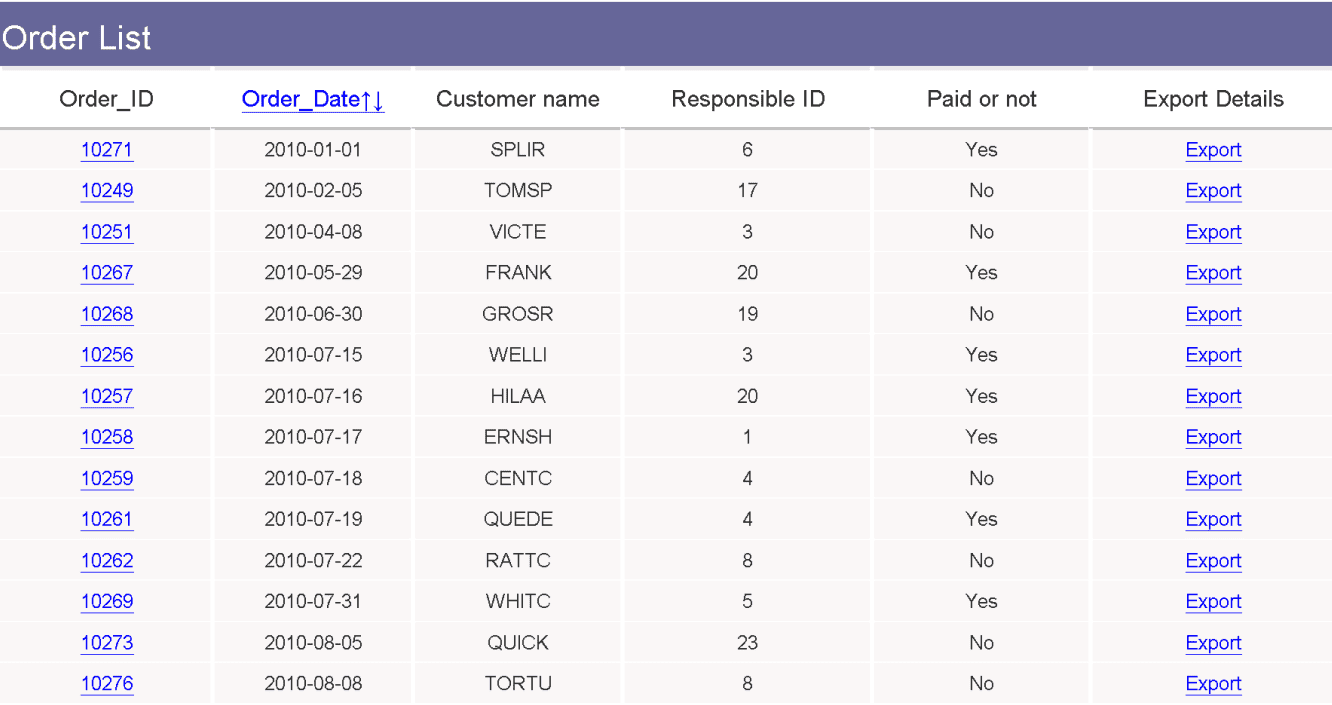
Automated Reporting
For example, tools likeFineReport excel in automating report generation. You can schedule daily, weekly, or monthly updates, ensuring timely delivery to your team. These reports can include key metrics like budget utilization, task completion rates, and project risks.
Alerts enhance your dashboard by notifying you of critical changes. Set up triggers for specific conditions, such as missed deadlines or budget overruns. When these conditions occur, the dashboard sends notifications via email or mobile apps. This proactive approach helps you address issues before they escalate.
Automation also improves accuracy. By eliminating manual data entry, you reduce the risk of errors. Real-time data integration ensures that reports and alerts reflect the latest project status. This keeps your team informed and aligned with project goals in Malaysia.
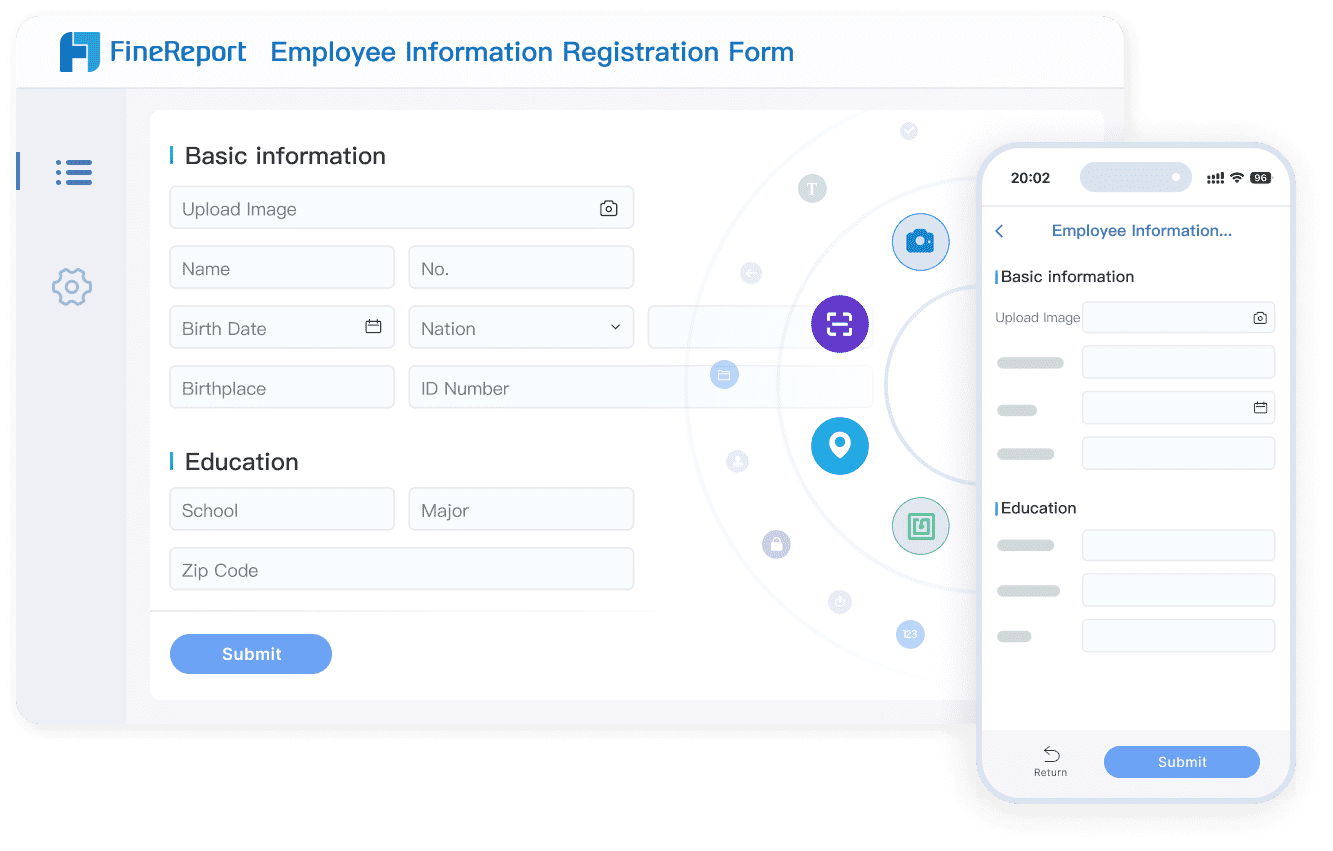
Data Entry
Callout: Automated reporting and alerts not only save time but also enhance accountability. Stakeholders stay informed, and teams can act quickly on critical updates.
Incorporating automation into your dashboard streamlines workflows and boosts efficiency. It ensures your projects in Malaysia stay on schedule and within budget.
Step-by-Step Guide to Building a Custom Project Management Dashboard
Define your project goals and key metrics
Start by identifying what you want to achieve with your dashboard. Think about the specific objectives your team in Malaysia needs to accomplish. These could include improving task completion rates, monitoring budgets, or enhancing team collaboration. Clear project goals and metrics will guide the design and functionality of your custom project management dashboard.
Ask yourself questions like:
What are the most critical aspects of the project to monitor?
Which metrics will help you track progress effectively?
How will the dashboard support decision-making?
For example, if your goal is to improve resource allocation, focus on metrics like resource utilization and task assignments. If you aim to meet deadlines, prioritize tracking task completion rates and milestone achievements. Defining these elements ensures your dashboard aligns with your project’s needs and helps you stay on track.
Tip: Write down your goals and metrics before starting the design process. This will serve as a blueprint for building a dashboard that delivers value.
Choose the right tools
Selecting the right tools is crucial for creating an effective dashboard. Tools like FineReport and FineBI offer robust features that simplify the process. FineReport specializes in creating pixel-perfect dashboards and reports. Its drag-and-drop interface makes it easy to design layouts that match your project goals and metrics. It also supports automated reporting, saving you time and effort.
FineBI, on the other hand, focuses on self-service analytics. It allows you to explore data independently and uncover insights without relying on IT support. Its integration capabilities enable you to consolidate data from multiple sources, ensuring your dashboard provides a comprehensive view of your project.
When choosing tools, consider factors like ease of use, integration options, and scalability. Ensure the tool you select can handle your project’s complexity and adapt as your needs evolve. FineReport and FineBI excel in these areas, making them ideal choices for building a custom project management dashboard.
Callout: The right tools not only simplify dashboard creation but also enhance its functionality, ensuring you can track progress and make informed decisions.
Design a layout that prioritizes clarity and usability
A well-designed layout is essential for an effective dashboard. Start by organizing data logically. Group related metrics together and use clear labels to make navigation intuitive. For instance, place task progress indicators near deadlines to provide a quick overview of project status.
Use visual elements like charts, graphs, and heatmaps to present data. These tools make complex information easier to understand. For example, a Gantt chart can help you visualize timelines, while a pie chartcan show budget distribution. Avoid clutter by limiting the number of widgets on each screen.
Accessibility is another key factor. Ensure your dashboard works seamlessly across devices, including desktops, tablets, and smartphones. This flexibility allows you to monitor projects in Malaysia from anywhere, enhancing productivity.
Tip: Test your dashboard with a small group of users before full deployment. Their feedback can help you refine the layout and improve usability.
A clear and user-friendly layout ensures your dashboard becomes a valuable tool for your team. It simplifies data interpretation, enhances collaboration, and keeps everyone aligned with project goals.
Automating data collection and updates is a critical step in building an effective project management dashboard. Manual data entry often leads to errors, delays, and inefficiencies. By automating these processes, you ensure your dashboard remains accurate, up-to-date, and reliable.
Start by identifying the data sources your project relies on. These could include databases, spreadsheets, or third-party tools. Use integration-friendly software like FineReportand FineBIto connect these sources to your dashboard. For example, FineReport allows you to link multiple data sources seamlessly, ensuring real-time synchronization.
Tip: Choose tools that support real-time data synchronization. This ensures your dashboard reflects the latest project updates without manual intervention.
Automation also simplifies repetitive tasks. For instance, you can schedule daily updates for task progress or weekly reports for budget tracking. Tools like FineReport excel in automating these workflows, saving you hours of manual effort.
Here’s how automation enhances your dashboard:
Accuracy: Automated data collection eliminates human errors.
Efficiency: Scheduled updates free up time for strategic tasks.
Consistency: Regular updates ensure stakeholders always have the latest information.
To implement automation effectively, test the integration of your data sources. Ensure the connections are stable and the updates occur as scheduled. This step guarantees your dashboard operates smoothly and delivers value to your team.
Project Management Dashboard Examples and Tools to Get Started
Examples of dashboards created with FineReport and FineBI
FineReport and FineBI offer powerful solutions for creating project dashboards tailored to your needs. FineReport excels in generating pixel-perfect dashboards with advanced visualizations. For example, you can design a dashboard that tracks task completion rates, budget utilization, and resource allocation. Its drag-and-drop interface simplifies the process, allowing you to focus on presenting data clearly.
Click the interactive demo of the project dashboard created by FineReport to experience it!
FineBI specializes in self-service analytics. It enables you to build dashboards that uncover trends and insights. For instance, you can create a dashboard that monitors team performance and identifies bottlenecks in workflows. FineBI’s OLAP analysis tools make it easy to drill down into data for deeper understanding. These examples demonstrate how these tools transform raw data into actionable insights.
Below is an interactive demo created by FineBI. Click to explore and experience the dynamic options firsthand.
Customizing templates ensures your dashboard reflects your project’s priorities. Start by identifying the metrics that matter most. For example, if you need to monitor deadlines, include widgets that track task progress and milestone achievements.
Use color coding to highlight critical data. Green can indicate completed tasks, while red flags overdue items. Rearrange widgets to group related metrics together. This improves navigation and makes the dashboard more intuitive.
Tip: Test your customized dashboard with your team. Their feedback will help you refine the layout and ensure it meets everyone’s needs.
By tailoring templates, you create a dashboard that enhances decision-making and keeps your projects in Malaysia on track.
Monitor performance and make iterative improvements
Monitoring your dashboard’s performance is essential for ensuring its effectiveness. Regularly evaluate how well it meets your project’s needs. Start by tracking key metrics such as task completion rates, budget utilization, and team productivity. These metrics reveal whether your dashboard provides actionable insights or requires adjustments.
Use feedback from your team in Malaysia to identify areas for improvement. Ask them if the dashboard displays relevant data or if certain features feel redundant. For example, if team members in Malaysia struggle to locate critical updates, consider reorganizing the layout. Their input helps you refine the dashboard to better align with your project goals in Malaysia.
Iterative improvements keep your dashboard dynamic and responsive. Begin by testing small changes, like adding a new widget or adjusting visualizations. Measure the impact of these updates on usability and decision-making. If the changes prove effective, implement them across the entire dashboard.
Automation can also enhance performance. Tools like FineReport and FineBI allow you to automate data updates and reporting. This ensures your dashboard always reflects the latest information, reducing manual effort and improving accuracy.
Tip: Schedule regular reviews of your dashboard. Monthly or quarterly evaluations help you stay ahead of evolving project requirements.
By monitoring performance and making iterative improvements, you ensure your dashboard remains a powerful tool for project management. It adapts to your team’s needs, enhances productivity, and drives better outcomes.
An effective project management dashboard is essential for success in 2025. It simplifies tracking, enhances collaboration, and ensures real-time insights for better decisions. Tools like FineReport and FineBI empower you to automate updates and visualize data effortlessly. These features save time and improve accuracy, keeping your projects in Malaysia on track. Start small by defining goals and metrics, then refine your dashboard as your needs evolve. This iterative approach ensures your dashboard remains a valuable tool for achieving project success.
Click the banner below to experience FineReport and FineBI for free and empower your enterprise to convert data into productivity!
Continue Reading about Project Management Dashboard
Access a wealth of case studies, industry insights, and solution guides to accelerate digital transformation.
FAQ
What is the primary purpose of a project management dashboard?
A project management dashboard provides a centralized view of key metrics like task progress, resource allocation, and deadlines. It helps you track performance, identify risks, and make informed decisions in real time.
How do tools like FineReport and FineBI enhance dashboards?
FineReport automates reporting and creates pixel-perfect dashboards. FineBI enables self-service analytics and integrates data from multiple sources. Together, they simplify data visualization and improve decision-making.
Can I customize my dashboard for different projects?
Yes, you can tailor dashboards to fit specific project goals. Use drag-and-drop tools to adjust layouts, add widgets, and highlight key metrics. Customization ensures your dashboard aligns with your unique needs.
How does automation improve dashboard efficiency?
Automation eliminates manual tasks like data entry and report generation. Tools like FineReport schedule updates and send alerts, ensuring your dashboard stays accurate and up-to-date. This saves time and reduces errors.
Are project management dashboards mobile-friendly?
Many modern dashboards, including those built with FineReport and FineBI, support mobile access. You can monitor projects on smartphones or tablets, ensuring flexibility and real-time updates wherever you are.