You can use the sbti dashboard to see how organizations set and track science-based targets for climate action. This dashboard shows progress and helps you understand how companies respond to climate change. If you care about sustainability, learning about this tool will give you real insight into how businesses work to meet their goals. Many people in manufacturing use dashboards like this to improve their ESG strategies and make better decisions.
What Is the SBTi Dashboard

Purpose of the SBTi Dashboard
You can use the SBTi dashboard to see how companies set and track their climate goals. The science-based targets initiative created this tool to help you understand which organizations are taking action on climate change. The main goal is to show you clear and up-to-date information about science-based targets. This helps you see which companies are working toward net zero and how they plan to get there.
The SBTi dashboard gives you a detailed view of each company’s journey. You can find information such as:
- Company name and sector
- How closely their targets align with global temperature goals
- The time frame for each target
- The type and value of each target
- Which scopes (like direct or indirect emissions) the targets cover
- How much progress the company has made
- How much time has passed since the target was set
You can check the SBTi target dashboard every week because it updates regularly. This means you always get the latest data on science-based targets. The dashboard also helps you compare companies and see who leads in setting net zero goals. You can use this tool to track SBTi progress dashboard results and see how organizations move closer to net zero.
Tip: If you want to understand how businesses respond to climate change, start by exploring the science-based targets initiative dashboard. It makes complex data easy to read and helps you follow real progress.
Who Uses the SBTi Dashboard
You might wonder who benefits from the science-based targets initiative dashboard. Many different groups use it to make smart decisions about climate action and net zero strategies.
- Business leaders use the dashboard to set and review their own science-based targets.
- Investors and financial analysts check the dashboard to see which companies are serious about net zero and climate change.
- Civil society groups and non-profits use the dashboard to hold companies accountable for their science-based targets.
- Students, researchers, and journalists use the dashboard to study trends and report on progress toward net zero.
The SBTi dashboard serves as a key resource for anyone who wants to track science-based targets and see real action on climate change. You can use it to compare companies, monitor their net zero commitments, and understand how the science-based targets initiative drives change across industries.
By using the SBTi progress dashboard, you get a clear picture of how organizations move toward net zero. This helps you stay informed and make better choices, whether you work in business, finance, or education.
Key Information in the SBTi Dashboard
Science-Based Targets Initiative Data
When you explore the science-based targets initiative dashboard, you see a wide range of data that helps you understand how companies work toward net zero. The dashboard collects information from several sources and organizes it so you can easily compare progress. You find details about company commitments, target validation, industry classification, and market value. This data gives you a clear picture of how organizations set and achieve science based targets.
Here is a table that shows the main types of data you can access:
| Data Source | Description |
|---|---|
| SBTi target dashboard | Information on companies with validated targets and commitments as of December 31, 2023 and 2022 for growth comparison. |
| Year-on-year analysis | Snapshots of SBTi target dashboard (legacy version) extracted at the end of each year since 2015. |
| Industry classification | Companies categorized by sector as reported to the science-based targets initiative under CDP’s Activity Classification System. |
| Market capitalization data | Retrieved using LSEG Datastream for all publicly available companies with commitments or validated targets as of December 2023 and December 2022. |
| G7 equity indexes | Composition retrieved from public sources as of December 2023. |
You get updated information every year. The science-based targets initiative reviews self-disclosed data and publishes results through the sbti dashboard. This annual update helps you track changes and see which companies make real progress toward net zero.
Note: The dashboard uses data from the science-based targets initiative, so you always see the latest results from companies working on science-based targets.

SBTi Aligned Sustainability Metrics
The science-based targets initiative dashboard also shows you how companies measure their sustainability efforts. These metrics focus on science-based targets and net zero goals. You can compare them with traditional sustainability metrics to see the difference in approach and credibility.
Here is a table that highlights the main differences:
| Aspect | SBTi Aligned Metrics | Traditional Sustainability Metrics |
|---|---|---|
| Focus | Science-aligned climate action and risk mitigation | General sustainability performance |
| Credibility | Enhanced through measurable targets | Varies, often less rigorous |
| Risk Management | Proactive approach to climate-related risks | Often reactive, less structured |
| Integration with Reporting | Streamlined with ESRS requirements | May require separate reporting frameworks |
You notice that science-based targets initiative metrics give you a more reliable way to measure net zero progress. These metrics use clear targets and help you understand how companies manage climate risks. When you use the sbti dashboard, you see which organizations lead in science based targets and which ones need to improve their science-based targets.
Tip: If you want to track net zero progress, focus on science-based targets initiative metrics. They help you see real action and compare companies more effectively.
How the SBTi Dashboard Works
Accessing the SBTi Dashboard
You can access the sbti dashboard online from any device with an internet connection. The science-based targets initiative makes this tool available to everyone, so you do not need special software or a paid account. When you visit the dashboard, you see a simple and modern interface. This design helps you find information quickly, even if you are new to sustainability reporting.
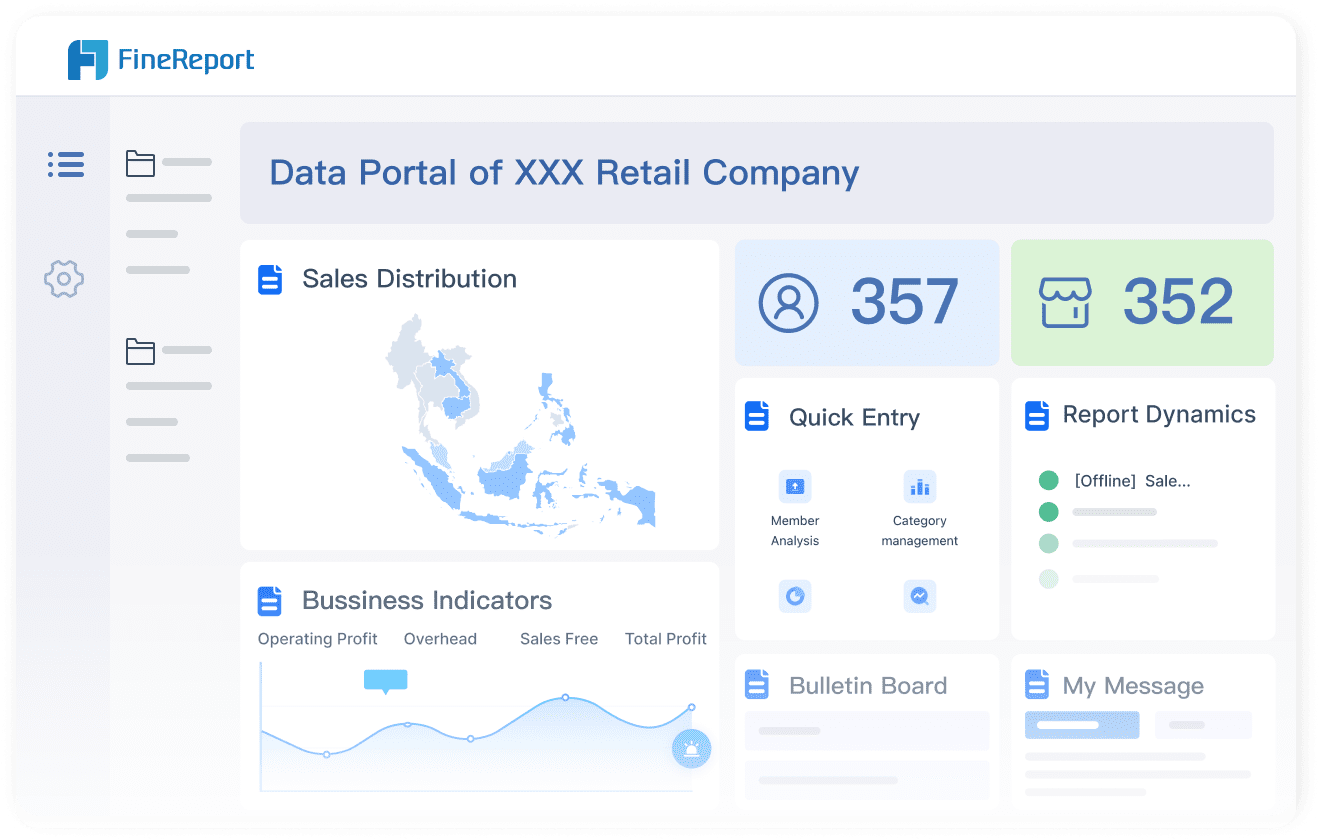
Many companies use dashboards like this to track their progress toward net zero. For example, FanRuan’s FineReport platform gives you a similar experience. You can connect to different data sources, view real-time updates, and share reports with your team. These features help you stay on top of your sustainability goals and make better decisions.

Navigating Dashboard Features
When you open the science-based targets initiative dashboard, you see several features that make it easy to explore data. The dashboard uses a simplified layout, so you do not feel overwhelmed. You can search for companies, filter by industry, or focus on specific regions. Each company entry links to more details about their net zero targets and progress.
Here is a table that shows the main features you will find on the dashboard:
| Feature Description | Details |
|---|---|
| Updated Dashboard | The Beta Dashboard is the single source of truth for SBTi target and commitment data. |
| Data Download Options | You can download data by company or by target. |
| Unique Identifiers | SBTi IDs and entry IDs help you track data more easily. |
| Aligned Field Names | Field names are standardized for better comparison. |
You can also customize your view. The dashboard lets you create a tailored display for your emissions data. You can drill down into details about regions, products, or business units. This helps you focus on the most important factors for your company or research.
Tip: Use the data download option to analyze company targets in your own tools, like Excel or FineReport. This makes it easier to create custom reports or dashboards for your team.
Interpreting SBTi Metrics
The science-based targets initiative dashboard gives you clear metrics to help you understand company progress. You see targets for net zero, deadlines, and how much each company needs to reduce emissions. The dashboard shows both absolute reduction goals and intensity-based targets. Absolute goals cover direct operations and electricity use. Intensity targets help manage indirect emissions, which often make up the largest share of a company’s carbon footprint.
Here is a table that explains some common target types:
| Target Type | Emission Reduction Requirement | Deadline |
|---|---|---|
| Net-Zero | At least 90% reduction | 2050 |
| Power Sector | At least 90% reduction | 2040 |
You also see why companies set these targets. Many respond to investor expectations, regulatory pressures, and the chance to save costs or innovate. The dashboard helps you compare companies and see who leads in net zero action.
Manufacturers use these metrics to guide their sustainability strategies. For example, Danfoss, a global leader in energy efficiency, used FineReport to track real-time data in its factories. The company improved operational efficiency, reduced energy use, and cut carbon emissions. By using dashboards, Danfoss made faster decisions and reached its net zero goals more effectively.
You can follow a similar approach. Use the science-based targets initiative dashboard to monitor your progress, identify gaps, and share results with your team. Tools like FineReport help you integrate data from different sources and visualize your journey toward net zero.
Note: Dashboards make complex data easy to understand. They help you stay focused on your sustainability goals and show real progress to your stakeholders.
Using the SBTi Dashboard for ESG Goals
Tracking Company Progress
You can use the sbti dashboard to track how companies move toward their sustainability goals. The science-based targets initiative helps you measure progress by breaking the process into clear steps. First, you measure impacts on nature. Next, you decide which locations to prioritize. You collect baseline data and disclose it when you set targets. You act on science-based targets for nature. Finally, you track and report on progress. The dashboard makes these steps easy to follow, so you can see which companies are making real changes.
| Step | Description |
|---|---|
| 1 | Measuring impacts on nature |
| 2 | Deciding which locations to prioritize |
| 3 | Collecting baseline data and disclosing when targets are set |
| 4 | Acting on SBTs for nature |
| 5 | Tracking and reporting on progress |
Many companies face challenges when using the dashboard for ESG goal tracking. You may notice that Scope 3 emissions, which include supply chain and product use, are hard to measure. These emissions often become a blind spot. Some companies find it difficult to meet the science-based targets initiative’s strict requirements, especially for supply chain emissions.
Comparing SBTi Targets
The science-based targets initiative dashboard lets you compare targets across companies and industries. You see quantifiable goals that organizations aim for, which helps you measure progress. The dashboard encourages innovation and competition. Industries try to meet or exceed benchmarks, which raises the standard for everyone. Benchmarks also improve accountability and transparency among stakeholders.
- The dashboard provides quantifiable targets for measurement.
- It fosters innovation and competition across sectors.
- Benchmarks serve as standards for progress, enhancing accountability.
You also see how the dashboard supports compliance with international ESG standards. It automates disclosure alignment with ESG frameworks and regulations. You can collect data directly, which reduces manual work. The dashboard centralizes information and improves reporting.
FanRuan and FineReport in SBTi Aligned Sustainability
If you work in manufacturing, you need real-time data integration for effective sustainability management. FanRuan’s FineReport supports ESG and sustainability reporting by integrating with sbti dashboard data. You can connect to different databases and consolidate scattered information for comprehensive reporting. FineReport keeps ESG metrics current in real time, which ensures accurate tracking.
| Benefit | Description |
|---|---|
| Efficient Data Entry and Validation | Keeps ESG metrics current in real-time, ensuring accurate sustainability tracking. |
| Flexible Data Integration | Connects to various databases, consolidating scattered information for comprehensive reporting. |
| Engaging Visualizations | Provides a variety of charts, including dynamic 3D options, to enhance data presentation. |
| Open APIs and Customization | Allows customization to fit existing business systems, facilitating seamless integration. |
| Centralized Data Management | Automates reporting processes, reducing compliance headaches and supporting informed decision-making. |
FineReport also provides engaging visualizations, including dynamic 3D charts, which help you present data clearly. You can customize the platform to fit your business systems. Automated reporting reduces compliance headaches and supports better decision-making. By using FineReport, you align your sustainability efforts with sbti aligned sustainability standards and improve your ESG performance.

Tip: Use FineReport to integrate sbti aligned sustainability data and create dashboards that help you track, compare, and report on your company’s progress.
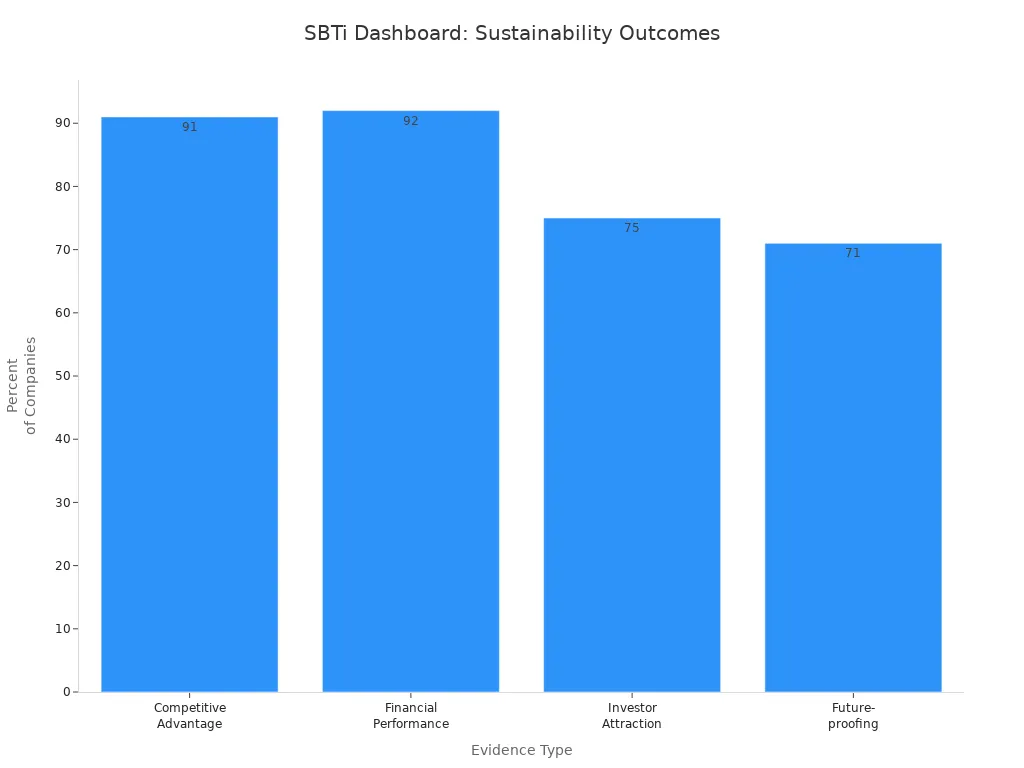
You gain real advantages by using the SBTi dashboard. Many companies report stronger market positions and better financial results after setting science-based targets. The table below shows how organizations benefit:
| Benefit | Result |
|---|---|
| Competitive Advantage | 91% see a positive impact on their business |
| Financial Performance | 92% report neutral or positive long-term financial results |
| Investor Attraction | 75% say targets boost investor confidence |
| Future-proofing | 71% feel more resilient to regulatory changes |
Dashboards like FineReport help you centralize ESG data, visualize progress, and make smarter decisions. You see real-time insights and track sustainability goals with ease. Companies such as Dell and Danfoss show how dashboards guide manufacturing toward lower emissions and higher efficiency. By using these tools, you build transparency and accountability for your ESG journey.
Continue Reading About dashboard
What is a Dashboard and How Does It Work
Dashboard Meaning Explained Across Different Industries
What Are Performance Dashboards and Their Benefits in 2025


FAQ

The Author
Lewis
Senior Data Analyst at FanRuan
Related Articles

How to Build an Investment Portfolio Reporting Dashboard for Executives: KPIs, Benchmarks, and Drill-Down Views
Investment portfolio reporting for executives is not about showing every holding, transaction, and chart your investment team can produce. It is about giving CEOs, CFOs, CIOs, boards, and investment committees a fast, re
Yida YIn
Jun 25, 2026

12 KPI Reporting Examples for Executive Dashboards: What to Show in Weekly, Monthly, and Quarterly Reviews
Executive leaders do not need more data. They need decision ready $1 examples that match how often they review the business and what actions they are expected to take. A weekly $1 should surface fast moving risks and per
Yida YIn
Jun 25, 2026

How to Build a Digital Marketing Reports Dashboard: Executive Examples, KPIs, and Templates
A $1 is the control layer that helps executives and marketing leaders turn scattered channel data into fast, confident decisions. If you are a CEO, CMO, operations director, or marketing analytics lead, the real problem
Yida Yin
May 07, 2026