Proper report formatting plays a crucial role in achieving academic and professional excellence. A well-structured report not only organizes your ideas but also demonstrates your attention to detail and commitment to quality. Educators often emphasize the value of formatting, with over 75% stating that well-formatted papers are easier to read, leading to better evaluations.
In one case, a research report with clear formatting allowed peers to quickly grasp complex findings, showcasing how structure enhances credibility. Similarly, in the corporate world, a structured evidence report uncovered trends that shaped strategic decisions.
Adopting a clear report format reflects professionalism and builds trust with your audience in Malaysia.
The title page is the first impression of your report. It acts as the cover, providing essential details that set the tone for the rest of the document. A well-designed title page ensures clarity and professionalism. Here’s what you should include:
For example, if you’re preparing a financial analysis report, the title page might read:
"Quarterly Financial Performance Analysis"
Author: Jane Doe
Date: October 2023
Organization: XYZ Corporation
By including these elements, you create a polished and professional introduction to your work. Remember, the title page is not just a formality; it’s a critical part of the basic structure of a report.
The executive summary is a vital section that provides a concise overview of your report. It allows readers to grasp the main ideas quickly without diving into the details. This section is especially important for busy professionals who need to make decisions efficiently.
A well-crafted executive summary achieves the following:
For instance, in financial reports, the executive summary might include metrics like revenue growth, profit margins, and return on investment. These insights help executives make informed choices without wading through dozens of pages.
When writing your executive summary, focus on clarity and brevity. Use simple language to summarize the report's objectives, findings, and conclusions. Avoid jargon or overly technical terms that might confuse your audience in Malaysia.
The body of the report is where you present your findings, analysis, and supporting details. Structuring your report effectively ensures that readers can follow your arguments and understand your conclusions.
Here’s how to organize the main body of the report:
For example, if you’re writing a report on sales performance, your findings might include a table showing quarterly sales figures, followed by a discussion of trends and recommendations for improvement.
By structuring your report in this way, you guide your readers through your analysis, making it easier for them to understand and act on your conclusions.
Tip: Use headings and subheadings to break up the text and improve readability. A clear structure not only enhances comprehension but also reflects your professionalism.
References and citations are essential for establishing the credibility of your report. They demonstrate that your work is grounded in reliable sources and allow readers to verify the information you present. Properly citing your sources also ensures you avoid plagiarism, which is critical in both academic and professional settings.
When including references and citations in your report, follow these best practices:
Tip: Use citation management tools like Zotero or EndNote to organize your references efficiently. These tools help you maintain consistency and save time.
To enhance the credibility of your report, evaluate the quality of your sources. Reliable references share these characteristics:
For example:
A structured reference section not only strengthens your arguments but also reflects your attention to detail. Readers will appreciate the effort you put into ensuring the reliability of your work.
Appendices and supporting materials play a crucial role in enhancing the depth and transparency of your report. These sections allow you to include additional information without disrupting the flow of the main text. By organizing supplementary content in appendices, you ensure that your report remains concise while still providing comprehensive insights.
Here are some common types of content you can include in appendices:
Note: Appendices should only contain non-essential content that supports your report. Avoid placing critical information here, as readers may overlook it.
The following table illustrates how different types of appendices serve specific purposes:
| Example Type | Purpose |
|---|---|
| Non-essential content | Supports research without being critical for understanding, e.g., extended proofs or context. |
| Detailed data | Presents large datasets or complex outputs without disrupting the main argument. |
| Supporting materials | Includes technical documents or images that enhance understanding but are too extensive. |
| Step-by-step guides | Offers further explanation of complex ideas or methodologies. |
| Additional insights | Provides extended datasets or visualizations that complement the main text. |
| Raw data | Ensures transparency and allows validation of findings through detailed statistical analyses. |
| Interview transcripts | Offers depth and transparency to qualitative research analysis. |
| Survey instruments | Provides clarity on the tools used to collect data. |
For instance, if your report involves a financial analysis, you might include raw data tables in the appendices. This allows readers to validate your findings without cluttering the main sections of your report. Similarly, technical documents or step-by-step guides can clarify complex methodologies for readers who wish to delve deeper.
By thoughtfully organizing your appendices, you enhance the usability of your report. Readers can access additional details as needed, ensuring a seamless reading experience.
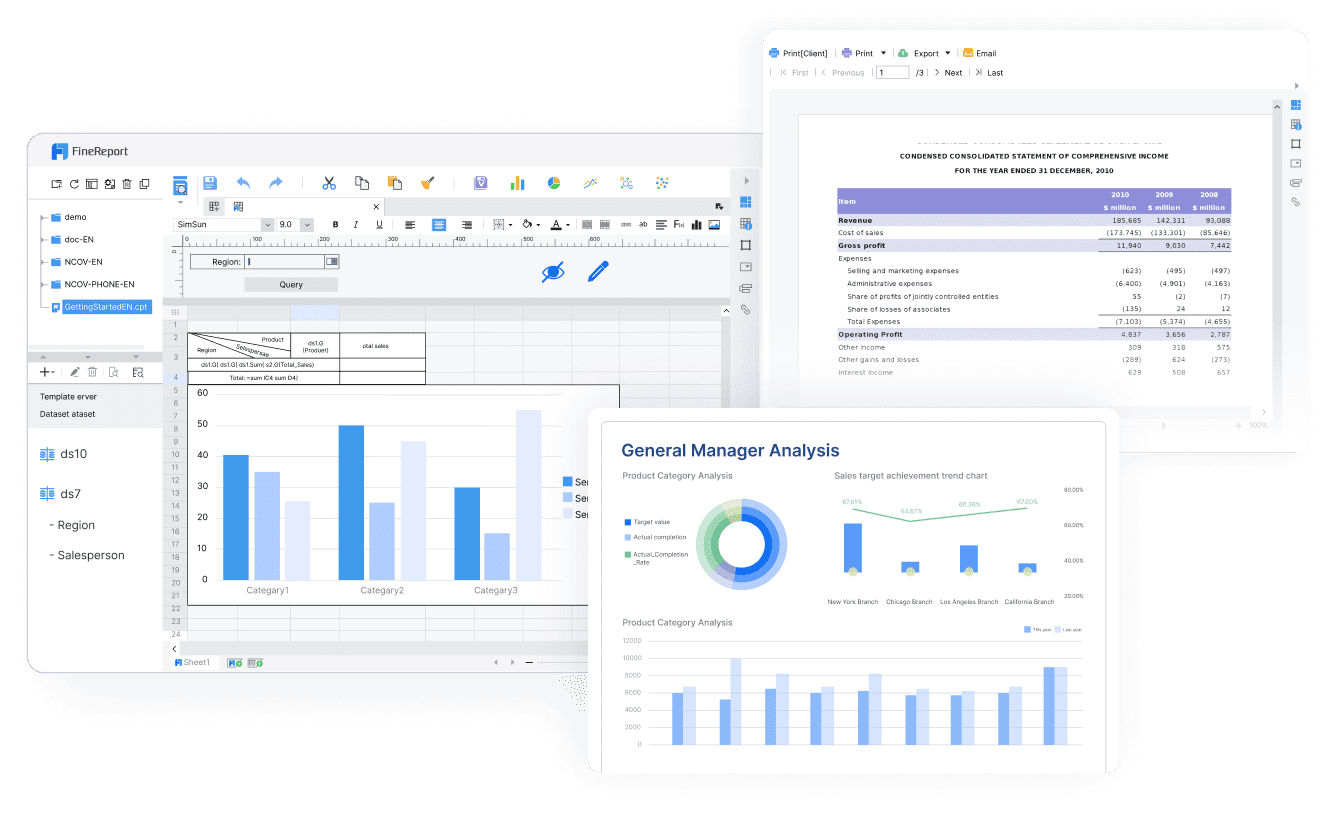
FineReport offers a variety of report format to meet diverse business and academic needs in Malaysia. Each format serves a specific purpose, ensuring that your data is presented effectively and professionally. Here are the main types of report format you can create using FineReport:

Each of these formats can be customized to include elements like an executive summary, appendices, and references. FineReport’s intuitive interface makes it easy to design reports that align with your objectives.
Tip: Choose the report format that best suits your audience in Malaysia and purpose. For example, use dashboard reports for quick decision-making and Word reports for detailed documentation.
Choosing the right font and typography is essential for creating a professional and readable report. Fonts influence how your audience in Malaysia perceives your work and can impact the clarity of your message. Following established standards ensures consistency and enhances the overall presentation.
Here are some widely accepted best practices in report writing:
Historical Insight: Structured reporting has led to impactful discoveries, such as James Parkinson's 1819 report identifying Parkinson's disease and the 1981 report contributing to the discovery of HIV. These examples highlight the importance of clear formatting in achieving meaningful results.
The table below summarizes major formatting elements for typography:
| Formatting Element | Common Practice |
|---|---|
| Font | Times New Roman, 12-point font |
| Line Spacing | Double-space (alternative: Single-space) |
| Margins | One-inch margins all around |
| Paragraph Format | Indent paragraphs one-half inch |
| Page Numbers | Arabic numerals in upper right corner |
| Section Headings | Use section headings with appropriate levels |
By adhering to these guidelines, you ensure your report format meets professional standards and remains accessible to your audience in Malaysia.
Spacing and margins play a critical role in improving the readability and visual appeal of your report. Proper spacing prevents your content from appearing cramped, while well-defined margins create a clean and organized layout.
Follow these best practices to optimize spacing and margins:
Tip: Generous margins around text and charts help readers focus on key information without feeling overwhelmed. A 2-column layout with an optimal line length of 60-70 characters per line improves organization and prevents visual clutter.
Spacing and margins are major formatting elements that directly impact how your audience in Malaysia engages with your report. By following these best practices, you create a document that is both visually appealing and easy to navigate.
Organized headings and subheadings are vital for structuring your report effectively. They break up large blocks of text, making it easier for readers to skim and locate specific information. A clear hierarchy of headings also enhances the logical flow of your content.
Here’s how to organize headings and subheadings:
Quote: "Headings and subheadings provide a clearly visible organization and structure that allows readers to read selectively and preview information."
Organized headings improve readability and ensure your report format aligns with professional standards. For example, in a financial report, you might use headings like "Revenue Analysis" and subheadings like "Quarterly Trends" to guide readers through your findings.
By implementing these best practices in report writing, you make your document more accessible and engaging for your audience in Malaysia.
Page numbers and headers/footers are essential elements that elevate the professionalism and readability of your report. They provide structure and ensure that readers can navigate your document effortlessly. By organizing these elements effectively, you create a polished and cohesive presentation.
Page numbers help readers locate specific sections quickly. They are especially useful in lengthy reports, where navigating through multiple pages can become challenging. Including page numbers ensures that your document remains organized and user-friendly.
Tip: Use Arabic numerals for page numbering, starting from the introduction or executive summary. Avoid numbering the title page to maintain a clean and professional look.
Headers and footers serve as anchors for your document, providing essential information that aids in navigation and organization. Headers typically appear at the top margin, while footers occupy the bottom margin. Together, they frame your content and ensure consistency across pages.
For example, a financial report might use headers to display the section title, such as "Revenue Analysis," while footers include the page number and the company name. This approach ensures that readers always know where they are in the document.
To maximize the impact of page numbers and headers/footers, follow these formatting guidelines:
| Element | Best Practice |
|---|---|
| Page Numbers | Place them in the footer, aligned to the right for easy visibility. |
| Headers | Include the report title or section name, aligned to the left or center. |
| Footers | Add essential details like author name or submission date, aligned to the left. |
| Font Style | Use the same font as the main text for consistency. |
| Consistency | Ensure headers and footers appear uniformly across all pages. |
Note: Avoid overcrowding headers and footers with too much information. Keep them simple and focused to maintain a clean layout.
Proper formatting of page numbers and headers/footers significantly improves the professionalism of your report. Organized content with clear headings and subheadings guides the reader and ensures a seamless reading experience. Headers and footers also provide vital information that enhances document clarity and navigation.
By implementing these elements thoughtfully, you create a report that is not only visually appealing but also easy to use. Readers will appreciate the effort you put into maintaining structure and consistency, making your work stand out in both academic and professional settings.
Clear and concise writing is essential for creating impactful reports. When you write with clarity, your ideas become easier to understand, and your audience in Malaysia can engage with your content effectively. Conciseness ensures that your report remains focused and avoids unnecessary details that might overwhelm readers.
| Key Points | Description |
|---|---|
| Importance of Clarity | Clear writing helps convey research findings effectively. |
| Influence on Readers | Concise articles are more likely to be influential due to busy schedules. |
| Avoiding Jargon | Simplifying language helps a broader audience understand the content. |
| Impact on Grades | Mastery of clarity and conciseness leads to better grades and engagement. |
| Readability | Good readability increases reader engagement and discoverability. |
To achieve clarity, use straightforward language and organize your ideas logically. Avoid jargon or overly technical terms unless necessary, and define them when used. Conciseness can be achieved by eliminating redundant phrases and focusing on the core message.
Tip: Busy professionals and academics appreciate concise reports that respect their time. Simplify your language to ensure understanding across diverse audiences in Malaysia.
Objectivity and formality are critical for maintaining credibility in your reports. When you write objectively, you present information without bias, allowing readers to trust your analysis. Formality ensures that your report aligns with professional standards and conveys respect for the subject matter.
For example, instead of writing "I believe this method works," you could write "This method demonstrates effectiveness based on the data." This approach shifts the focus to the evidence rather than personal opinion, reinforcing objectivity.
Note: Understanding the audience in Malaysia is key to striking the right balance between formality and accessibility. Tailor your tone to meet their expectations while maintaining professionalism.
Jargon and ambiguity can hinder communication and reduce the effectiveness of your report. Ambiguous terms often lead to misunderstandings, while excessive jargon alienates readers unfamiliar with technical language.
For instance, in pathology reports, ambiguous terminology can delay treatment decisions. By using straightforward language and clarifying uncertainties, you ensure that your report is accessible and actionable.
Tip: Replace technical jargon with simpler alternatives whenever possible. If jargon is unavoidable, provide definitions to aid comprehension.
Reviewing and finalizing your report requires careful attention to detail. Proofreading and editing are essential steps that ensure your work is polished and error-free. Start by revising the larger aspects of your report, such as structure and coherence, before focusing on technical details like grammar and spelling. Setting your report aside for a while can help you spot mistakes more easily. Reading your report aloud is another effective technique, as it allows you to catch errors that might go unnoticed when reading silently.
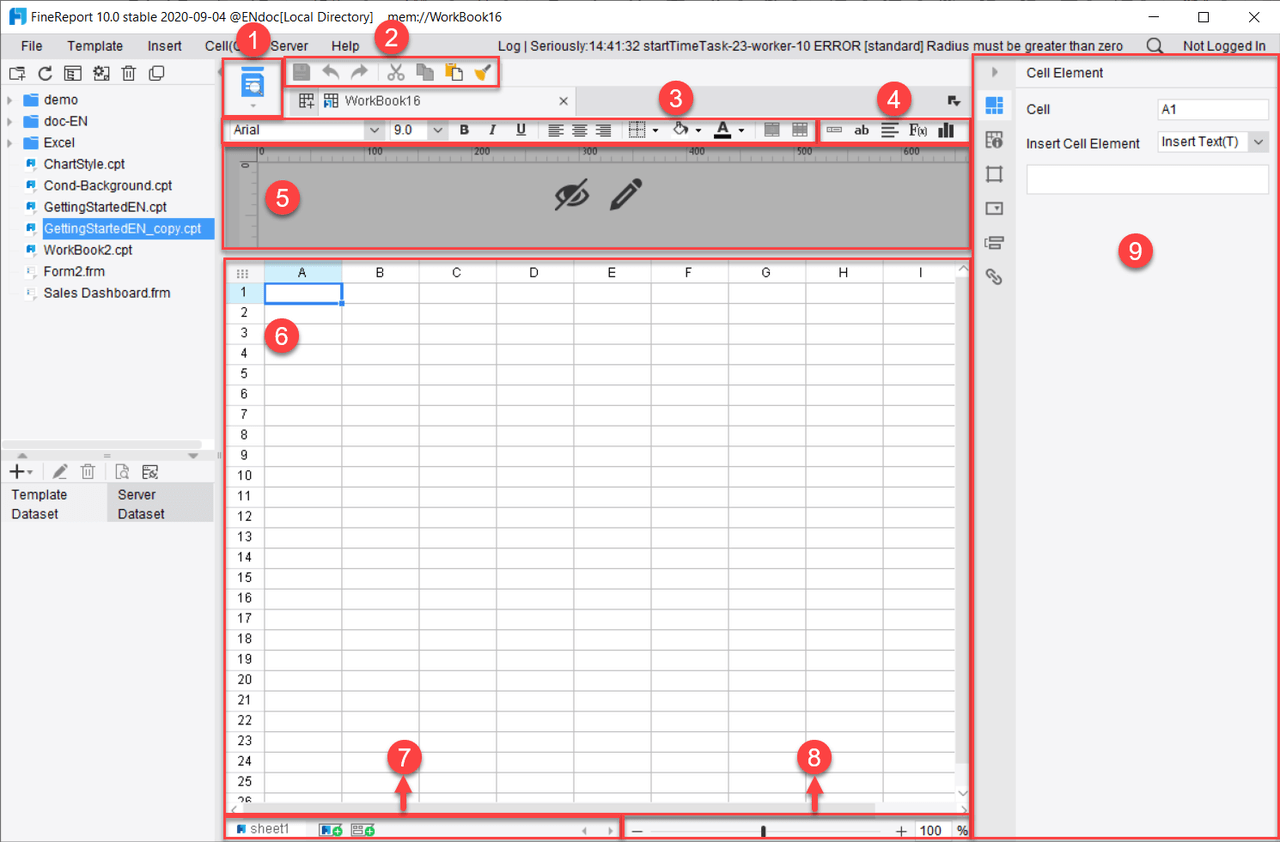
To simplify the process, eliminate unnecessary words and focus on clarity. Editing involves improving the flow and logic of your content, while proofreading addresses surface-level issues. For example, you might check for consistent formatting, correct citations, and accurate data representation. FineReport’s user-friendly tools, such as drag-and-drop report building and robust data entry features, make it easier to refine your content. These tools allow you to modify data seamlessly and ensure accuracy through validation checks.
Tip: Use a checklist of common errors to systematically proofread your work. This approach ensures no detail is overlooked.
Feedback is a powerful tool for improving the quality of your report. Sharing your draft with colleagues or mentors can provide fresh perspectives and uncover areas for enhancement. Structured feedback often leads to significant improvements in clarity, organization, and overall impact. For instance, studies show that teaching quality improves when educators focus on specific skills highlighted in student feedback.
FineReport enhances collaboration by offering advanced data permissions and secure teamwork features. These capabilities allow multiple users to review and refine reports simultaneously, ensuring a cohesive final product. Scheduling tools and alerts also keep your team in Malaysia updated, streamlining the feedback process.
Note: When seeking feedback, ask specific questions about the report’s readability, accuracy, and relevance. This targeted approach yields actionable insights.
Ethical reporting builds trust and credibility. Always ensure your data is accurate, transparent, and free from bias. Avoid manipulating information to fit a narrative, as this undermines the integrity of your work. Adopting an evidence-based approach to decision-making reduces reliance on gut feelings and makes your conclusions more reliable.
FineReport supports ethical practices by enabling real-time data integration and validation. These features ensure that your reports reflect accurate and up-to-date information. Additionally, creating management structures with accountability checks can help prevent errors and maintain ethical standards. Collaborative decision-making further strengthens the reliability of your report by challenging risky assumptions.
Tip: Before finalizing your report, evaluate alternative actions and test your conclusions. Reflect on the outcomes to ensure they align with ethical guidelines.
Mastering report format techniques is essential for achieving academic and professional excellence. A well-structured report format not only organizes your ideas but also enhances your credibility. By applying the strategies outlined in this blog, you can create reports that leave a lasting impression.
FineReport simplifies this process by offering tools that streamline report creation. Its features allow you to focus on presenting your conclusions effectively, saving time and effort. Start implementing these techniques today to elevate the quality of your work and achieve your goals.
Click the banner below to try FineReport for free and empower your enterprise to transform data into productivity!


The Author
Lewis
Senior Data Analyst at FanRuan
Related Articles

10 Custom Reporting Dashboard Tools Compared: Features, Limits, and Best-Fit Use Cases
Compare 10 custom reporting dashboard tools on features, limits, and best-fit use cases.
Lewis Chou
May 03, 2026

10 Best Dashboard Reporting Tools for 2026 Compared: Power BI, Tableau, Looker Studio, and More
Dashboard reporting tools are software platforms that turn business data into interactive dashboards, scheduled reports, and decision ready insights.
Lewis Chou
Apr 27, 2026

How to create an HTML report from scratch in 2026
Build an html report from scratch in 2026 with easy steps, tools, and tips for customization, sharing, and making your data clear and interactive.
Lewis Chou
Mar 23, 2026


