BI reporting gives you the ability to transform raw information into actionable insights. By using business intelligence reporting, you connect data from different sources and create reports that guide business decisions. In the past, businesses relied on traditional reporting, which often produced static results and required manual effort. Today, business intelligence tools offer real-time reporting and interactive dashboards, allowing you to respond quickly to changing conditions.
Many companies now choose self-service BI solutions to overcome bottlenecks and usability issues found in older systems. The adoption rate of self-service BI tools has grown, with 54% of organizations viewing them as essential in 2020 and 62% in 2022. This shift has made data-driven decision making more accessible across the business. Modern platforms, including FineBI, help you analyze data independently and foster a culture of intelligence throughout your organization.
| Year | Percentage of Organizations Viewing Self-Service BI as Essential |
|---|---|
| 2020 | 54% |
| 2022 | 62% |
What Is BI Reporting?

Business Intelligence Reporting Explained
BI reporting gives you a way to turn raw data into meaningful business intelligence. You use business intelligence reporting to collect, process, and present data from different sources. This process helps you create business intelligence reports that show trends, measure performance, and support your business goals. With business intelligence, you gain a clear view of your operations and can make decisions based on facts, not guesses.
The main functions of BI reporting focus on helping you understand your business better. Leading industry analysts highlight these core functions:
| Core Function | Description |
|---|---|
| Providing performance visibility | Centralized visibility of KPI performance and identification of business trends. |
| Promoting data-driven decision making | Tools for informed choices that drive growth and efficiency. |
| Highlighting cost and efficiency gains | Insights for improving processes and optimizing resource allocation. |
| Creating competitive advantage | Understanding market dynamics to develop proactive strategies against competitors. |
You use business intelligence reporting to monitor key metrics, spot opportunities, and address challenges quickly. This approach supports a culture of intelligence and continuous improvement in your business.
BI Reporting vs. Traditional Reporting
Traditional reporting often relies on static reports that take time to prepare and update. BI reporting changes this by offering real-time data, interactive dashboards, and faster analysis. You can see the main differences in the table below:
| Aspect | BI Reporting | Traditional Reporting |
|---|---|---|
| Data Processing Speed | Real-time updates enhance speed | Static, not updated in real-time |
| Accuracy | More accurate, timely insights | Can become outdated and less relevant |
| Interactivity | Highly interactive | Limited interactivity |
With BI reporting, you get up-to-date insights and can interact with your data. This means you respond faster to changes and make better decisions. Business intelligence reporting supports your business by making data analysis easier and more effective.
After understanding the value of BI reporting, you may want to explore modern tools that make this process even simpler. FineBI stands out as a business intelligence platform designed for business users who want to create reports, analyze data, and drive business intelligence without technical barriers.
Key Benefits of BI Reporting

Business intelligence reporting delivers a range of practical benefits that help you drive business success. By using BI reporting, you gain access to timely insights, improve operational efficiency, and create a foundation for data-driven decision-making. Let’s explore the key advantages you can expect when you implement business intelligence reporting in your organization.
Better Decision-Making
You need accurate information to make strong business decisions. Business intelligence reporting gives you access to real-time data and interactive dashboards. These tools help you move beyond guesswork and base your choices on facts. When you use BI, you can analyze trends, monitor key metrics, and identify opportunities or risks as they arise.
BI reporting enhances your ability to make informed decisions by providing strategic insights. You can see how your business performs across different areas and adjust your strategies quickly. For example, companies like Netflix and Amazon use business intelligence to personalize recommendations and optimize supply chains. This approach leads to better outcomes and supports a culture of data-driven decision making.
Note: Real-time analytics in BI reporting enables you to make decisions quickly based on live data. This agility helps you respond to market changes and customer needs without delay.
Performance Visibility
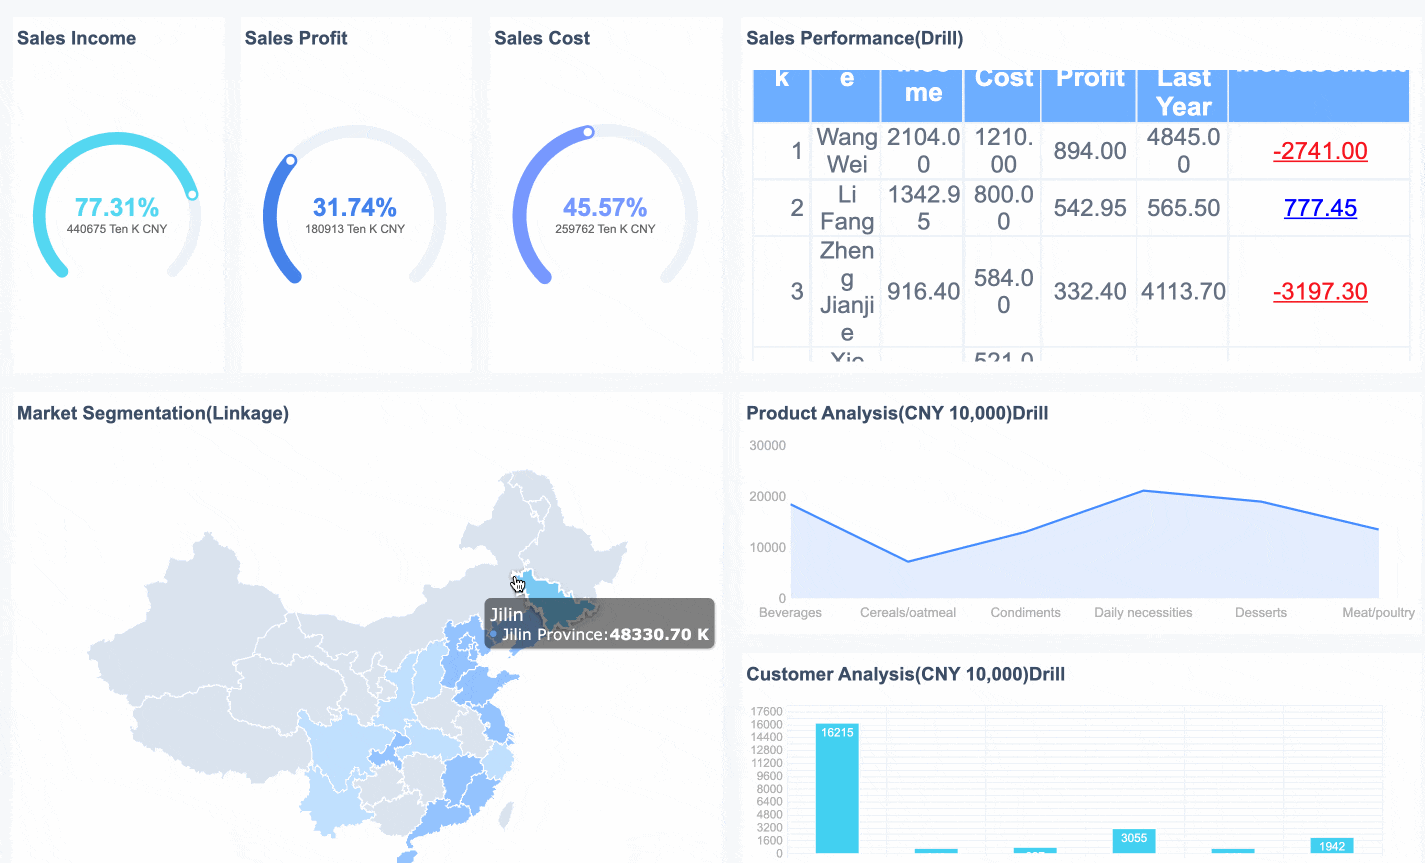
Business intelligence reporting improves performance visibility across all departments. You can track sales, operations, finance, and more from a single platform. BI dashboards consolidate data from multiple sources, making it easy to interpret and share information.
Here’s how BI reporting increases performance visibility:
| Benefit | Description |
|---|---|
| Strategic Insights | BI reports reveal trends that can increase profitability by analyzing sales and operations. |
| Identifying Inefficiencies | Reports highlight process inefficiencies, helping you streamline business operations. |
| Predicting Future Trends | BI tools allow you to anticipate changes and make proactive adjustments. |
| Visual Representation | Dashboards present complex data visually for quick understanding. |
| Single Source of Truth | All data streams unite, reducing errors and ensuring timely, accurate information. |
You can use business intelligence reports to compare performance across teams or locations. This unified view helps you identify best practices and areas for improvement. For example, BOE Technology Group used BI reporting to standardize metrics and create a unified analysis framework. As a result, they reduced inventory costs by 5% and increased operational efficiency by 50%.
Cost and Efficiency Gains
BI reporting helps you save money and work more efficiently. When you use business intelligence tools, you automate data collection and reporting. This reduces manual effort and minimizes errors. Companies that switch to no-code BI platforms often see their BI-related costs drop by as much as 50%.
You can also measure both tangible and intangible cost savings:
| Type of Cost Savings | Description |
|---|---|
| Tangible Cost Savings | Direct reductions in expenses related to BI implementation and maintenance. |
| Intangible Cost Savings | Long-term benefits like improved efficiency and faster decision-making. |
Business intelligence reporting streamlines your processes and allows you to allocate resources more effectively. You can identify areas where you spend too much and shift funds to higher-impact projects. In large enterprises, BI reporting reduces operational costs by optimizing workflows and minimizing mistakes.
- Companies using BI reporting tools report significant reductions in total cost of ownership compared to traditional systems.
- BI reporting simplifies processes, reduces operational errors, and leads to lower expenses.
Competitive Advantage
Business intelligence reporting gives you an edge over competitors. You can analyze market trends, customer preferences, and operational data to develop proactive strategies. In industries like retail and hospitality, BI reporting helps you optimize supply chains, personalize offers, and synchronize pricing across platforms.
- In the hotel industry, BI reporting enabled over 1,800 hotels to gather real-time data on room supply and demand, saving days on data compilation.
- Retailers use BI to analyze sales data and improve customer loyalty through targeted promotions.
- BI reporting supports predictive analytics, allowing you to anticipate market gaps and develop new products or services.
When you use business intelligence reporting, you stay ahead by adapting quickly to changes and making smarter business decisions. You can monitor competitors, respond to customer needs, and innovate faster.
Tip: Self-service BI features, such as those found in modern platforms, let you create reports and dashboards without IT support. This increases productivity and allows your team to focus on analysis and strategy.
Business intelligence reporting transforms how you approach business analytics. You gain deeper insights, improve efficiency, and build a foundation for sustainable growth. By leveraging BI reporting, you empower your organization to make smarter decisions and achieve lasting success.
Implementing BI Reporting with FineBI
Data Integration and Preparation
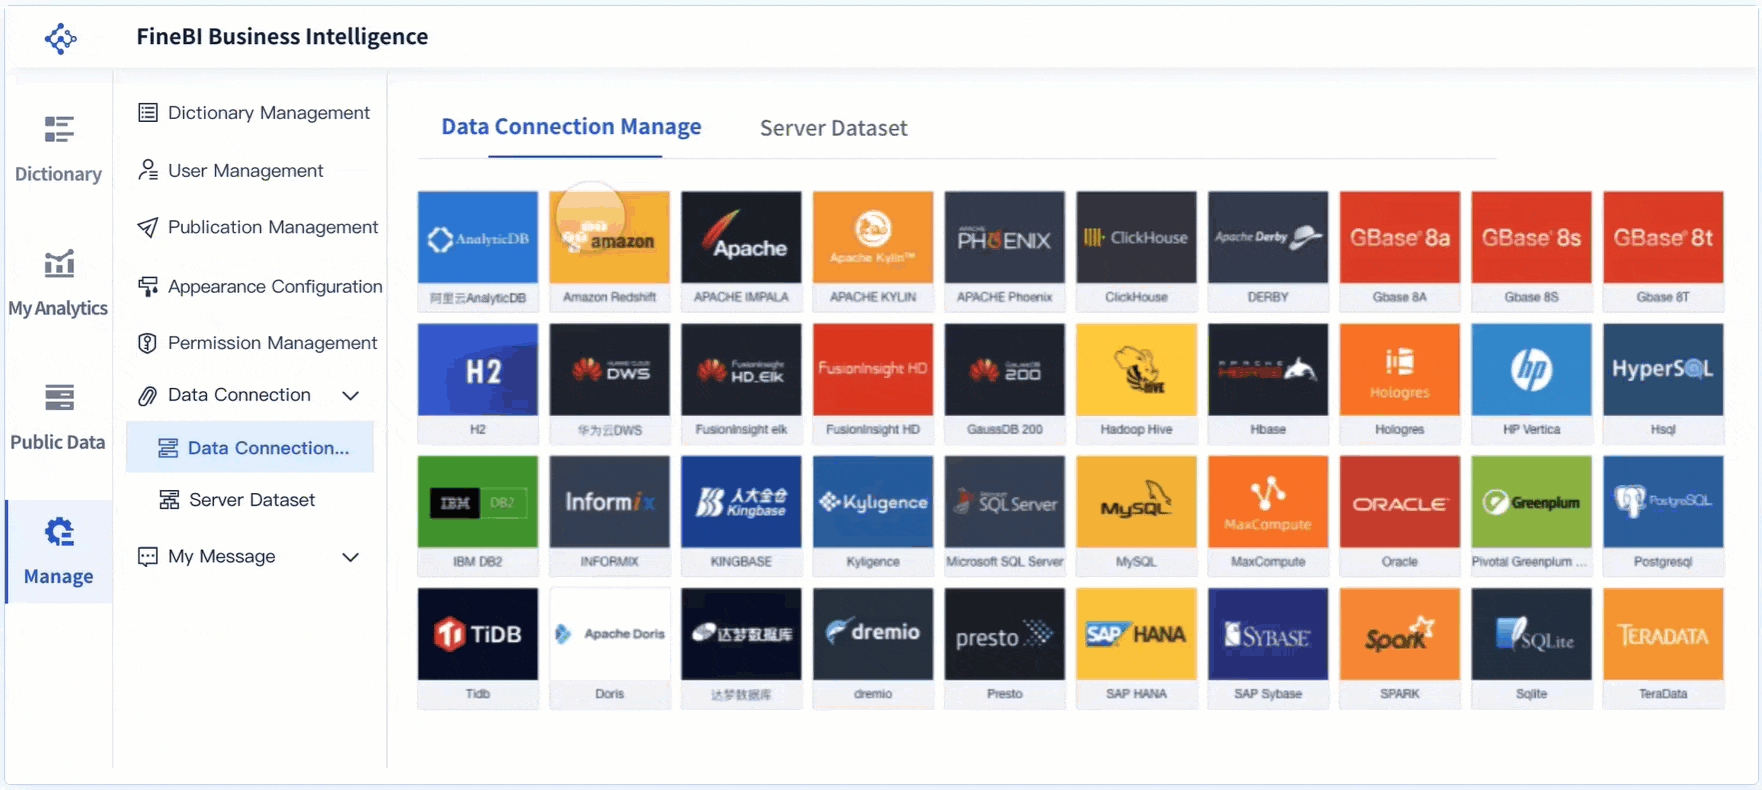
To implement BI reporting with FineBI, you start by connecting your business data sources. FineBI supports integration with databases, cloud warehouses, and APIs. This step ensures you gather all business intelligence data in one place for analysis. You can follow these steps for a smooth integration:
- Maintain the configuration of either FineReport or FineBI. If you keep FineReport, FineBI’s configuration will be erased.
- If you need both FineReport and FineBI datasets, mount the required dashboards before integration and export them using resource migration.
- After integration, FineBI’s default port will be used, which may differ from FineReport’s.
- Copy JAR packages from FineReport to FineBI, keeping FineBI’s versions if duplicates exist.
- Transfer plugin files from FineReport to FineBI, retaining FineBI’s files if duplicates exist.
- For FineReport versions before April 2020, copy the phantomjs folder to ensure chart exports work.
- Optionally, copy embed, logs, and resources folders if you need to keep specific configurations or data.
FineBI’s seamless data integration and real-time processing features help you create a single source of truth for your business. This approach improves data quality and ensures your business intelligence analytics are reliable.
| Feature | Description |
|---|---|
| Seamless Data Integration | Easy sharing and analysis of data across systems. |
| Real-Time Processing | Up-to-date insights for timely decisions. |
| Integration with Various Sources | Supports internal and external, cloud, and on-premises data. |
| Single Source of Truth | Consolidates data to eliminate conflicts. |
| Improved Data Quality | Ensures consistency and reliability. |
Visual Analysis and Dashboards
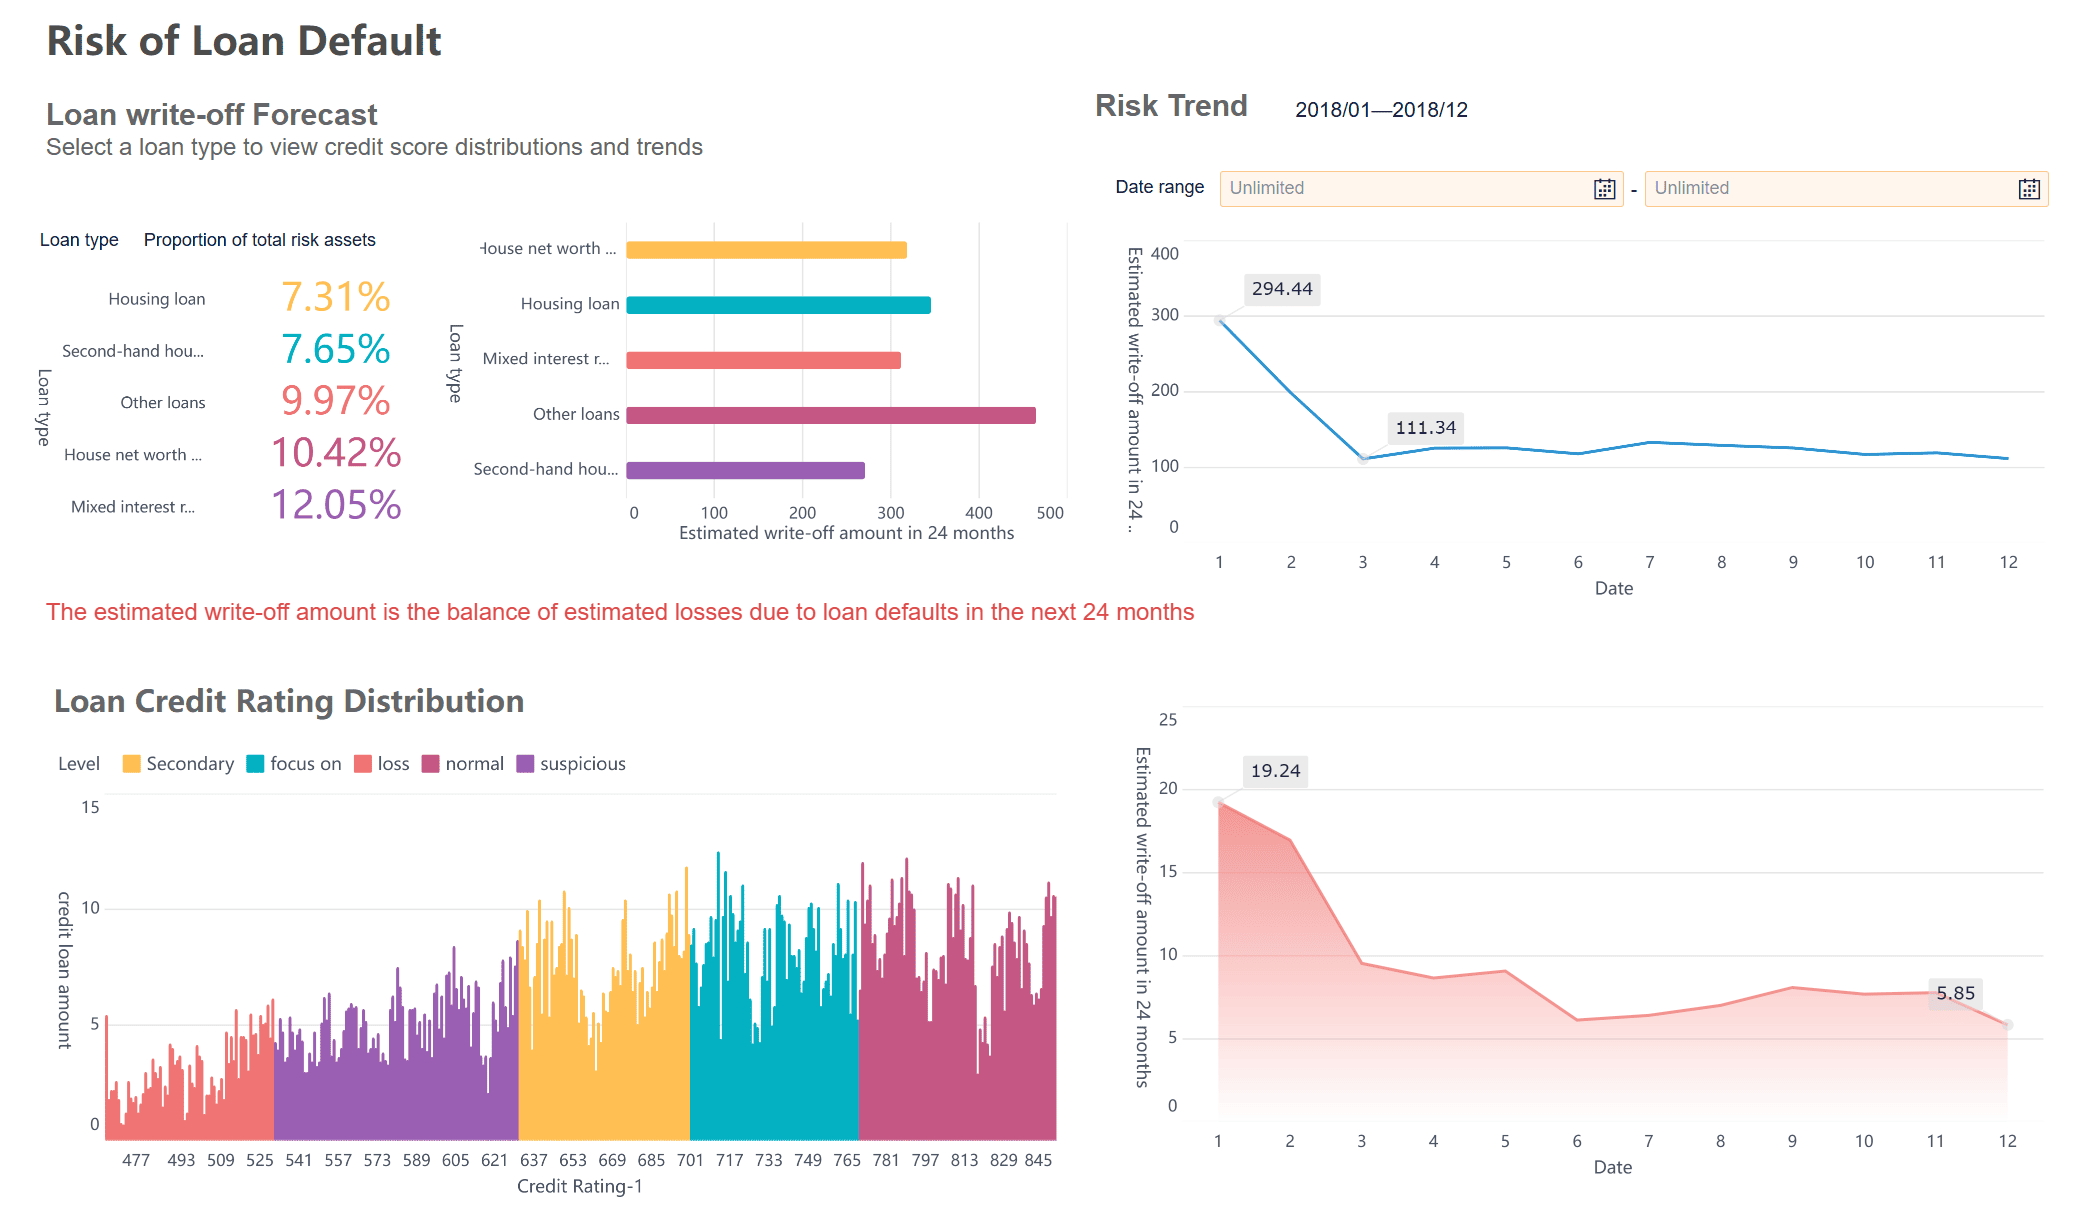
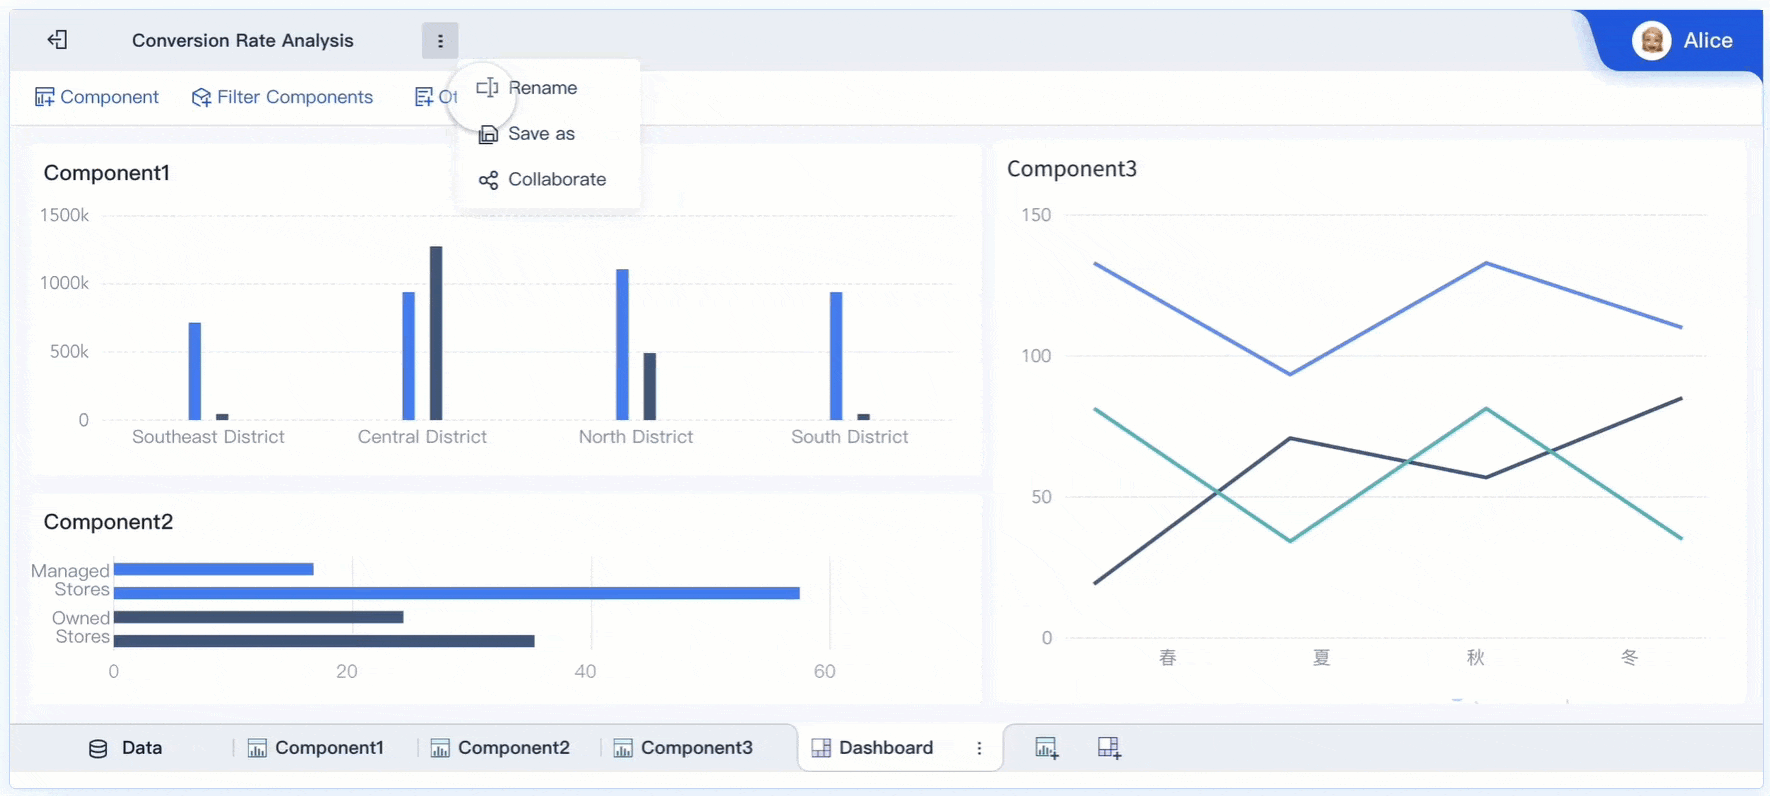
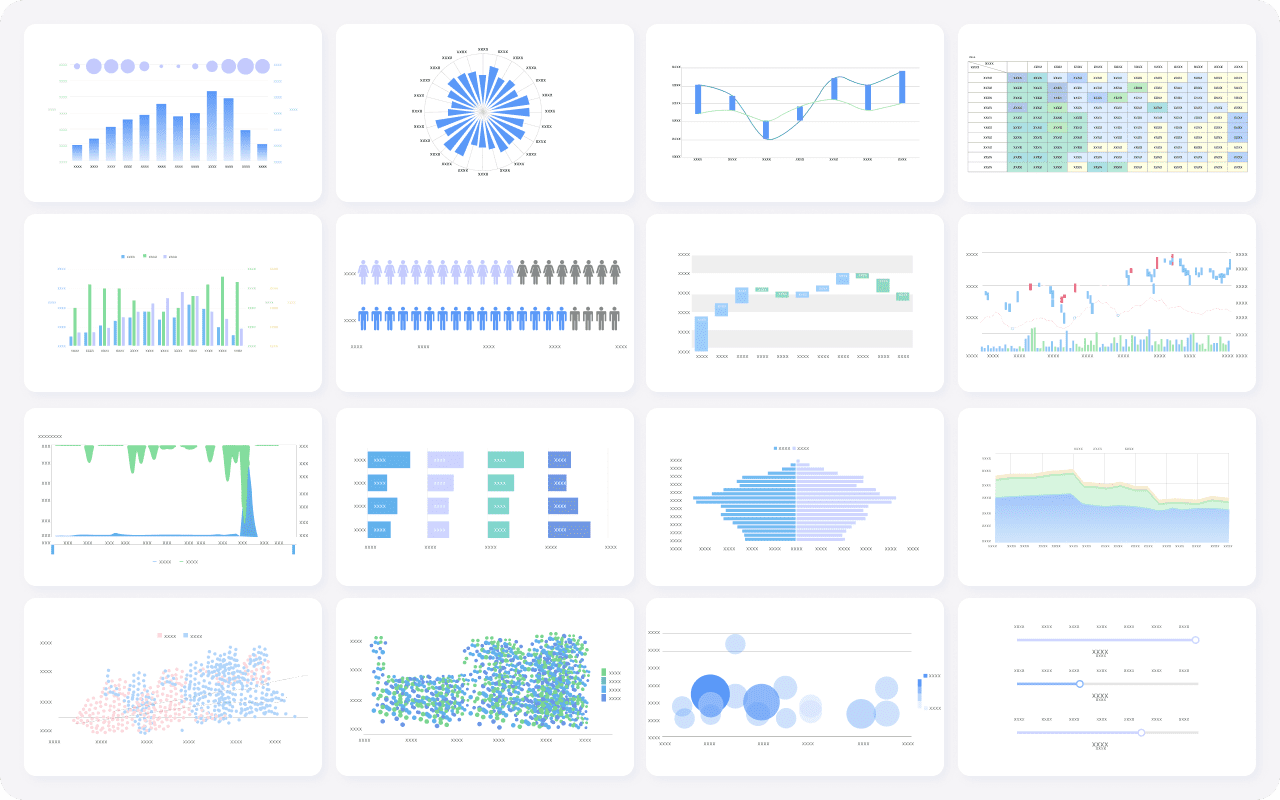
Once you prepare your data, you can use FineBI’s self-service BI features to build dashboards and reports. The drag-and-drop interface allows you to create custom dashboards without coding. You can visualize business performance, track KPIs, and generate actionable insights. FineBI’s data visualization tools help you turn complex data into clear, interactive dashboards. These dashboards support business intelligence analytics and make it easy to share insights across your organization.
Collaboration and Governance
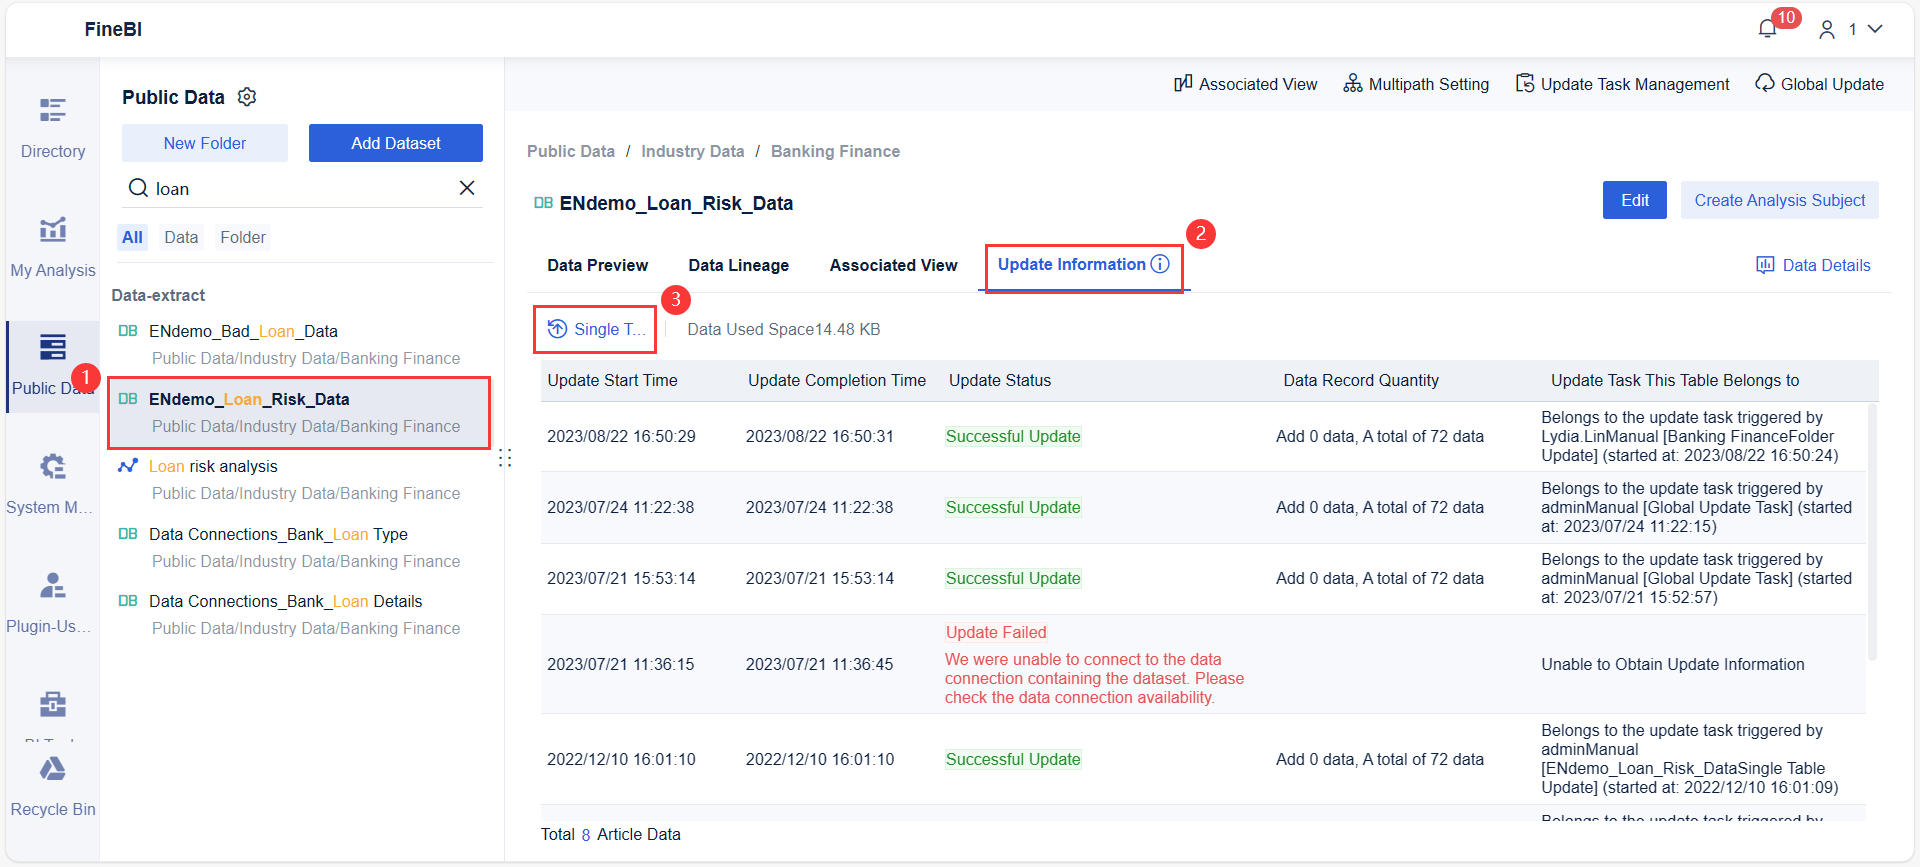
FineBI enhances collaboration by allowing teams to work together on business intelligence reports. You can assign permissions based on user roles, departments, or positions. This role-based access ensures only authorized users can view or edit sensitive business data. FineBI’s governance features include audit logs and data lineage tracking, which help you maintain compliance and data integrity.
| Aspect | Description |
|---|---|
| Permission Allocation | Assign permissions by user role, department, or position. |
| Access Control | Users access only data relevant to their role, reducing risks. |
| Hierarchical Permissions | User-specific permissions take priority over department or role settings. |
By following these steps, you can implement BI reporting with FineBI to drive business intelligence, improve business analytics, and deliver actionable insights that support your business goals.
Overcoming BI Reporting Challenges
Data Quality and Integration
You may face several obstacles when you start with BI reporting. Data quality issues often appear first. These can include duplicate records, outdated information, or inconsistent data from different sources. Data fragmentation is another common problem. When departments keep information in silos, you struggle to create unified reports or gain clear business insights.
FineBI helps you overcome these challenges by integrating multiple data sources into a single platform. You can connect databases, cloud services, and APIs, which reduces data fragmentation. FineBI also provides real-time updates, so your business intelligence reports always reflect the latest information. This unified approach improves the accuracy and reliability of your business analytics.
User Adoption
Getting your team to use new BI tools can be difficult. Many organizations face skill gaps and a lack of training. Complex reporting systems can make it hard for non-technical staff to extract actionable intelligence. To boost adoption, you should:
- Select a BI platform that is easy to use and integrates with your existing systems.
- Build a team of internal champions who can support and encourage others.
- Offer continuous, hands-on training tailored to different roles.
- Celebrate small wins and share success stories to motivate users.
FineBI's user-friendly interface and self-service features make it easier for everyone to create reports and perform analysis without heavy IT support.
Choosing the Right BI Solution
Selecting the right BI solution for your business requires careful planning. You need to consider advanced features, scalability, and vendor support. Start by defining your business intelligence strategy and setting clear selection criteria. Shortlist tools that meet your needs, then invite vendors for live demonstrations and proof-of-concept tests.
| Key Criteria | What to Look For |
|---|---|
| Integration | Compatibility with current systems |
| Scalability | Ability to grow with your business |
| Visualization | Strong reporting and dashboard features |
| Cost-effectiveness | Value for money and support |
Industry trends show a shift toward self-service BI and stronger governance. Mature governance strategies help you maintain data integrity and security as your business grows. FineBI supports these trends by offering robust access controls and audit features, ensuring your business intelligence remains secure and effective.
BI reporting plays a vital role in driving business success and informed decision-making. When you use business intelligence, you gain real-time agility and enhanced performance. Modern BI solutions like FineBI offer accurate data, faster reports, and a user-friendly interface. You can track KPIs, detect company flaws, and access insights that support growth. To ensure long-term value, define clear KPIs and monitor data regularly. Start implementing BI reporting to give your business a strategic advantage and explore FineBI to modernize your intelligence strategy.
| Measurable Outcome | Description |
|---|---|
| Improved Decision-Making | BI implementation enhances the quality of decisions with accurate data. |
| Real-Time Agility | Businesses respond quickly to market changes. |
| Enhanced Performance | Informed decisions lead to better business results. |
| Strategic Advantages | Companies gain a competitive edge by adapting strategies. |

Continue Reading About BI Reporting
Top 15 AWS Reporting Tools for Effective Cost Management


FAQ

The Author
Lewis
Senior Data Analyst at FanRuan
Related Articles

Financial Reporting Valuation Explained: A Practical Guide to ASC 820, ASC 805, ASC 350, and ASC 718
$1 valuation is the process companies use to measure assets, liabilities, equity instruments, and reporting units for compliant $1. For CFOs, controllers, finance directors, and audit facing accounting teams, the challen
Yida Yin
Jun 25, 2026

Best Ad Reporting Tool in 2026: 8 Options Compared for Marketers and Analysts
$1 is an $1 and dashboard platform that helps teams unify ad data, build highly customized reports, and automate distribution at scale. 8 ad reporting tool options compared 1. DashThis One sentence overview: DashThis is
Yida YIn
Jun 25, 2026
Office 365 Reporting Tool Guide: Track Usage, Security, and License Waste in One Dashboard
An office 365 $1 should do more than generate static usage charts. For IT managers, operations leaders, and Microsoft 365 administrators, the real value is operational visibility: who is actually using the platform, wher
Yida Yin
Jun 25, 2026