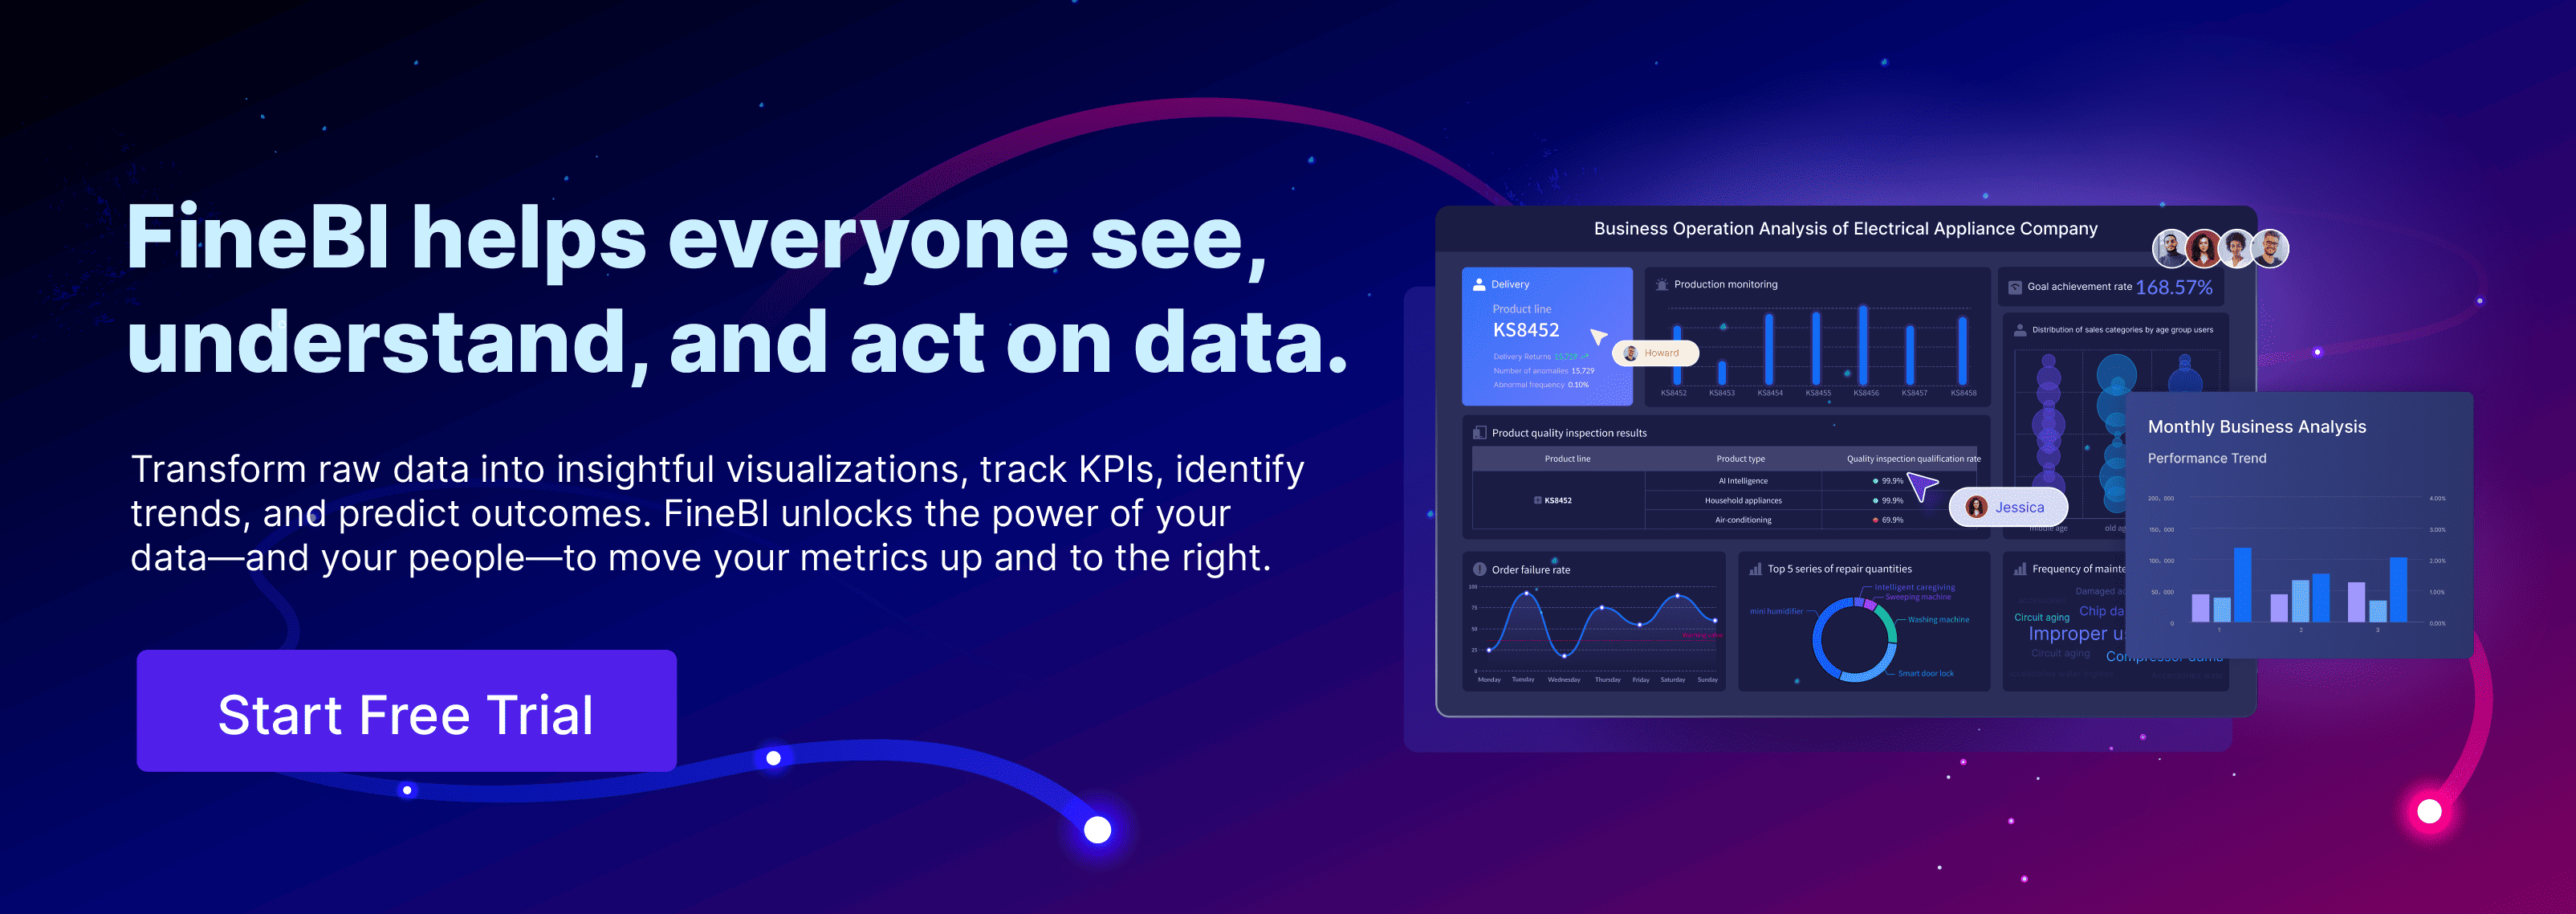

Tabular data, a prevalent form of data organization, arranges information in rows and columns. This structured format simplifies data entry and retrieval, making it indispensable in various fields. You encounter tabular data in spreadsheets, databases, and data warehouses, where solutions like FineDataLink enhance data integration processes. Its significance extends to data analysis and machine learning, where it serves as the foundation for building predictive models and conducting complex analyses. By facilitating data visualization through tools like FineReport and supporting analytical techniques with FineBI, tabular data empowers you to derive meaningful insights and make informed decisions across diverse industries. Additionally, platforms like FineVis enable dynamic visualizations that further enhance the understanding of tabular data, driving effective decision-making.
Definition of Tabular Data
Tabular data represents information organized in a structured format of rows and columns. This arrangement allows you to easily manage and analyze data. Each row typically corresponds to a single record, while each column represents a specific attribute or feature of that record. This format is prevalent in various fields, including data analysis and machine learning, due to its simplicity and efficiency.
Basic Structure of Tabular Data
The basic structure of tabular data consists of two main components: rows and columns. Rows represent individual records or instances, while columns denote the attributes or features of these records. For example, in a spreadsheet containing customer information, each row might represent a different customer, and each column could include details such as name, age, and purchase history. This structured format facilitates straightforward data entry and retrieval, making it ideal for statistical software packages and analytical tools.
Scientific Research Findings:
- Tabular Data Importance in Data Analysis: Tabular data serves as the foundation for various analytical techniques. It allows for efficient data handling in statistical software packages and is crucial for building predictive models and conducting exploratory data analysis.
- Understanding Tabular Data for Machine Learning: Tabular data is fundamental in machine learning, particularly for algorithms like XGBoost. It is essential for effective data preparation and modeling.
Examples of Tabular Data
You encounter tabular data in many everyday applications. Spreadsheets, such as those created in Microsoft Excel or Google Sheets, are common examples. These tools allow you to organize data in a grid format, making it easy to perform calculations and visualize results. Databases also utilize tabular data structures to store and manage large volumes of information efficiently. In research, tabular data helps organize findings, facilitating a connection between text and numerical results.
Scientific Research Findings:
- Benefits of Tabulated Data: Tabulated data offers structured organization, ease of data entry, efficient data retrieval, and compatibility with analytical tools. It supports data visualization and enables effective communication, integration with database systems, and interoperability.
By understanding the definition and structure of tabular data, you can better appreciate its role in data analysis and machine learning. This knowledge empowers you to leverage tabular data effectively in various applications, enhancing your ability to derive meaningful insights and make informed decisions.
Characteristics of Tabular Data
Understanding the characteristics of tabular data helps you appreciate its utility in various applications. This structured format offers several distinct features that make it a preferred choice for data organization and analysis.
Structured Format
Tabular data presents information in a clear, organized manner. You see this format in tables with rows and columns, where each row represents a unique record and each column denotes a specific attribute of that record. This structure simplifies data entry and retrieval, making it easy for you to manage and analyze large datasets. For instance, when working with spreadsheets or databases, the structured format allows you to quickly locate and manipulate data. This organization is particularly beneficial in fields like data analysis and machine learning, where precise data handling is crucial.
Data Types and Formats
In tabular data, you encounter various data types and formats. These can include numerical values, text, dates, and even Boolean values. Each type serves a specific purpose and helps you perform different kinds of analyses. For example, numerical data allows you to conduct statistical analyses, while text data might be used for categorization or labeling. The flexibility of tabular data formats means you can easily integrate it with other data sources, such as CSV files or databases, enhancing your ability to derive insights. This adaptability makes tabular data an invaluable resource in diverse fields, from business intelligence to scientific research.
By recognizing these characteristics, you can effectively utilize tabular data in your projects. Whether you're analyzing sales figures or conducting research, the structured format and diverse data types of tabular data provide a robust foundation for your work.
Types of Tabular Data
Tabular data comes in various forms, each serving distinct purposes in data management and analysis. Understanding these types helps you choose the right format for your needs.
Relational Databases
Relational databases store data in tables, where each table represents a different entity. You can think of these tables as spreadsheets with rows and columns. Each row in a table corresponds to a unique record, while columns represent attributes of that record. This structure allows you to easily manage and query large datasets. Relational databases use Structured Query Language (SQL) to perform operations like data retrieval, insertion, and deletion.
Benefits of Relational Databases:
- Data Integrity: Relational databases ensure data accuracy and consistency through constraints and relationships between tables.
- Scalability: They handle large volumes of data efficiently, making them suitable for enterprise-level applications.
- Flexibility: You can easily modify the database structure without affecting existing data.
Expert Testimony:
Sahakyan et al. highlight the importance of relational databases in fields like finance, medicine, and business. These sectors rely heavily on relational databases for their data management needs.
Non-relational Tables
Non-relational tables, often referred to as NoSQL databases, offer a more flexible approach to data storage. Unlike relational databases, they do not require a fixed schema. This flexibility allows you to store unstructured or semi-structured data, such as JSON or XML files. Non-relational tables are ideal for handling large-scale data with varying formats.
Advantages of Non-relational Tables:
- Scalability: They can handle massive amounts of data across distributed systems.
- Flexibility: You can store diverse data types without predefined schemas.
- Performance: Non-relational tables provide fast data access and retrieval, especially for large datasets.
Expert Testimony:
Rundo et al. emphasize the role of non-relational tables in sectors like agriculture and education, where data formats can vary significantly.
By understanding the differences between relational and non-relational tables, you can make informed decisions about which type of tabular data best suits your needs. Whether you're managing structured data in a relational database or handling diverse data formats in non-relational tables, each type offers unique benefits that enhance your data management capabilities.
Applications in Tabular Data Analysis

Tabular data plays a crucial role in data analysis, providing a structured format that simplifies various analytical processes. By leveraging tabular data, you can enhance your ability to clean, prepare, and analyze datasets effectively.
Data Cleaning and Preparation
Data cleaning and preparation form the foundation of any successful data analysis project. When working with tabular data, you must ensure that the data is accurate, complete, and free from errors. This process involves several key steps:
- Identifying and Handling Missing Values: You often encounter missing values in datasets. Address these gaps by either filling them with appropriate values or removing the affected records. This step ensures that your analysis remains accurate and reliable.
- Standardizing Data Formats: Consistency in data formats is essential. Convert dates, numbers, and text into a uniform format to facilitate seamless analysis. For example, ensure that all date entries follow the same format, such as MM/DD/YYYY.
- Removing Duplicates: Duplicate records can skew your analysis results. Identify and eliminate these duplicates to maintain data integrity.
- Correcting Inaccuracies: Verify the accuracy of your data by cross-referencing it with reliable sources. Correct any inaccuracies to ensure that your analysis is based on valid information.
By meticulously cleaning and preparing your tabular data, you lay the groundwork for meaningful analysis. This process enhances the quality of your insights and supports informed decision-making.
Statistical Analysis
Statistical analysis allows you to extract valuable insights from tabular data. By applying statistical techniques, you can uncover patterns, trends, and relationships within your datasets. Here are some common methods you might use:
- Descriptive Statistics: Begin your analysis with descriptive statistics, which summarize the main features of your data. Calculate measures such as mean, median, mode, and standard deviation to gain a comprehensive understanding of your dataset.
- Inferential Statistics: Use inferential statistics to draw conclusions about a population based on a sample. Techniques like hypothesis testing and regression analysis help you make predictions and assess relationships between variables.
- Data Visualization: Visualize your data using charts and graphs to identify trends and patterns. Tools like FineReport and FineVis enable you to create dynamic visualizations that enhance your understanding of the data.
- Trend Analysis: Analyze sales data from the past quarter to identify growth opportunities. By examining trends, you can make strategic decisions that drive business success.
Statistical analysis empowers you to transform raw tabular data into actionable insights. By applying these techniques, you can make data-driven decisions that positively impact your organization.
Tabular Data Applications in Machine Learning

Tabular data plays a pivotal role in machine learning, providing a structured foundation for developing predictive models. You can harness its potential through various applications, enhancing your ability to derive insights and make informed decisions.
Feature Engineering
Feature engineering involves transforming raw data into meaningful features that improve model performance. You can enhance the predictive power of your models by selecting, modifying, or creating new features from existing tabular data. Here are some key steps in feature engineering:
- Feature Selection: Identify the most relevant features that contribute to your model's accuracy. This process helps you reduce dimensionality and improve computational efficiency.
- Feature Transformation: Apply mathematical operations to modify existing features. Techniques like normalization and scaling ensure that your data fits within a specific range, enhancing model performance.
- Feature Creation: Generate new features by combining or transforming existing ones. For example, you might create a new feature by calculating the ratio of two existing columns.
By focusing on feature engineering, you can significantly improve your machine learning models' accuracy and efficiency. This process allows you to extract valuable insights from tabular data, enabling more precise predictions.
Model Training and Evaluation
Model training and evaluation are critical steps in the machine learning process. You can use tabular data to train models and assess their performance, ensuring that they meet your desired objectives. Here's how you can approach this process:
- Data Splitting: Divide your tabular data into training and testing sets. This step allows you to evaluate your model's performance on unseen data, ensuring its generalizability.
- Model Selection: Choose the appropriate machine learning algorithm for your task. Tree-based methods, such as decision trees and random forests, often excel with tabular data due to their ability to handle complex relationships.
- Training: Fit your model to the training data, allowing it to learn patterns and relationships. This step involves adjusting model parameters to minimize errors and improve accuracy.
- Evaluation: Assess your model's performance using metrics like accuracy, precision, recall, and F1-score. These metrics help you determine how well your model predicts outcomes based on the test data.
- Optimization: Fine-tune your model by adjusting hyperparameters and retraining it. This iterative process helps you achieve optimal performance and ensures that your model meets your objectives.
By following these steps, you can effectively train and evaluate machine learning models using tabular data. This approach empowers you to make data-driven decisions and unlock the full potential of your datasets.
Importance of Tabular Data
Tabular data plays a crucial role in various fields, offering a structured format that enhances data management and analysis. Its significance extends beyond mere organization, impacting decision-making and accessibility.
Data-driven Decision Making
Tabular data serves as a foundation for data-driven decision-making. You can organize information in rows and columns, allowing for easy manipulation and analysis. This structured format enables you to sort, filter, and aggregate data efficiently. By doing so, you can uncover patterns and trends that inform strategic decisions.
In organizations, tabular data supports decision-making processes by providing clear and concise insights. You can visualize data through charts, graphs, and tables, enhancing interpretability. This visualization aids in understanding complex datasets, making it easier for you to draw meaningful conclusions. As a result, you can make informed decisions that drive business success.
Accessibility and Usability
The accessibility and usability of tabular data make it indispensable in various applications. You often encounter tabular data in spreadsheets, CSV files, and relational databases. These formats allow for straightforward data entry and retrieval, ensuring that you can access and manipulate data with ease.
Tabular data's structured nature facilitates a connection between text and numerical results. You can integrate it with other data sources, enhancing its utility in diverse fields. This adaptability ensures that you can use tabular data for a wide range of purposes, from simple calculations to complex analyses.
Moreover, tabular data's widespread use in machine learning highlights its importance. It provides a reliable format for training models and conducting analyses. By leveraging tabular data, you can enhance your ability to derive insights and make data-driven decisions across various domains.
Challenges and Best Practices of Tabular Data
Data Quality Issues
When working with tabular data, you often face challenges related to data quality issues. Ensuring accuracy and consistency is crucial for reliable analysis. Common issues include:
- Missing Values: You might encounter gaps in your data, which can lead to incomplete analysis. Filling these gaps or removing affected records is essential.
- Inconsistent Formats: Data entries may vary in format, such as dates or numerical values. Standardizing these formats ensures seamless analysis.
- Duplicate Records: Duplicates can skew results. Identifying and eliminating them maintains data integrity.
- Inaccuracies: Errors in data can mislead your analysis. Cross-referencing with reliable sources helps correct inaccuracies.
A survey involving 909 responses highlighted these challenges as prevalent in tabular data management. Addressing these issues is vital for effective data handling.
Best Practices for Management
To manage tabular data effectively, you should adopt best practices that enhance data quality and usability. Consider the following strategies:
- Data Validation: Implement checks to ensure data accuracy during entry. This step prevents errors from propagating through your dataset.
- Regular Audits: Conduct periodic reviews of your data to identify and rectify inconsistencies or errors. Regular audits help maintain data quality over time.
- Standardization: Establish uniform formats for data entries. Consistent formats facilitate easier analysis and integration with other datasets.
- Documentation: Maintain clear documentation of your data sources, formats, and any transformations applied. Documentation aids in understanding and replicating analyses.
- Training: Educate your team on best practices for data entry and management. Training ensures everyone follows the same standards, reducing errors.
By implementing these best practices, you can improve the quality and reliability of your tabular data. This approach empowers you to make informed decisions based on accurate and consistent information.
FanRuan's Role in Tabular Data Management
In the realm of tabular data management, FanRuan stands out with its innovative solutions. You can leverage their products to enhance data integration, reporting, and business intelligence. Let's explore how each product contributes to managing tabular data effectively.
FineDataLink for Data Integration
FineDataLink revolutionizes how you handle data integration. It offers a flexible platform for ETL (Extract, Transform, Load) and ELT (Extract, Load, Transform) processes. This flexibility ensures higher data quality and seamless integration across various data sources. With FineDataLink, you can synchronize data in real-time, reducing latency and enhancing efficiency. Its low-code approach simplifies complex data tasks, making it accessible even if you lack extensive coding skills. By using FineDataLink, you streamline data integration, ensuring that your tabular data is accurate and up-to-date.
FineReport for Reporting and Visualization
When it comes to reporting and visualization, FineReport provides a robust solution. It integrates seamlessly with FineDataLink, allowing you to create dynamic reports and dashboards. You can use its drag-and-drop interface to design reports that meet your specific needs. FineReport supports diverse visualization types, enabling you to uncover deeper insights from your tabular data. Whether you're generating pixel-perfect documents or interactive dashboards, FineReport enhances your ability to communicate data effectively. This tool empowers you to make informed decisions by presenting data in a clear and visually appealing manner.
FineBI for Business Intelligence
FineBI transforms raw data into actionable insights, making it an essential tool for business intelligence. It swiftly creates a comprehensive analytics platform, empowering you to connect, analyze, and share data across your organization. FineBI integrates with FineDataLink, facilitating flexible ETL and ELT data development. This integration ensures that your data remains high-quality and reliable. With FineBI, you can perform real-time analysis, track key performance indicators, and predict future outcomes. Its user-friendly interface allows you to explore data independently, maximizing its value and supporting strategic decision-making.
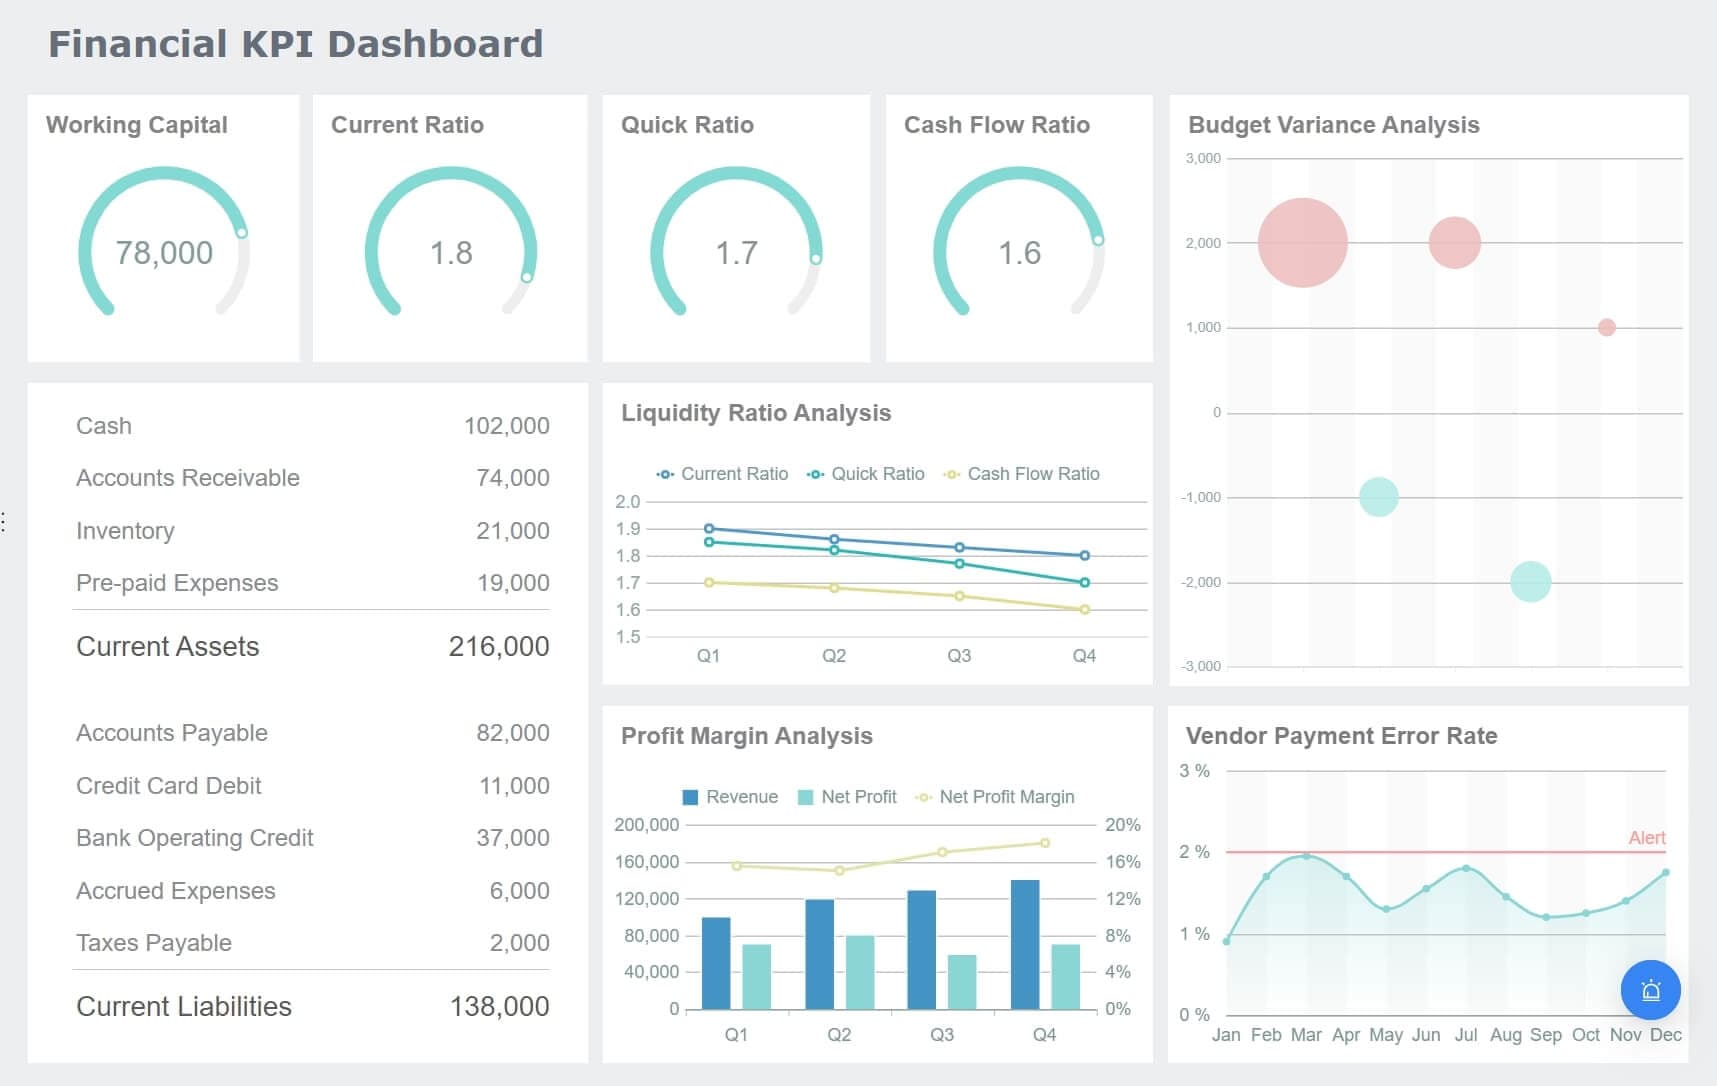
By utilizing these products, you enhance your ability to manage tabular data effectively. FanRuan's solutions provide the tools you need to integrate, visualize, and analyze data, driving success across various applications.
FineVis for Data Visualization
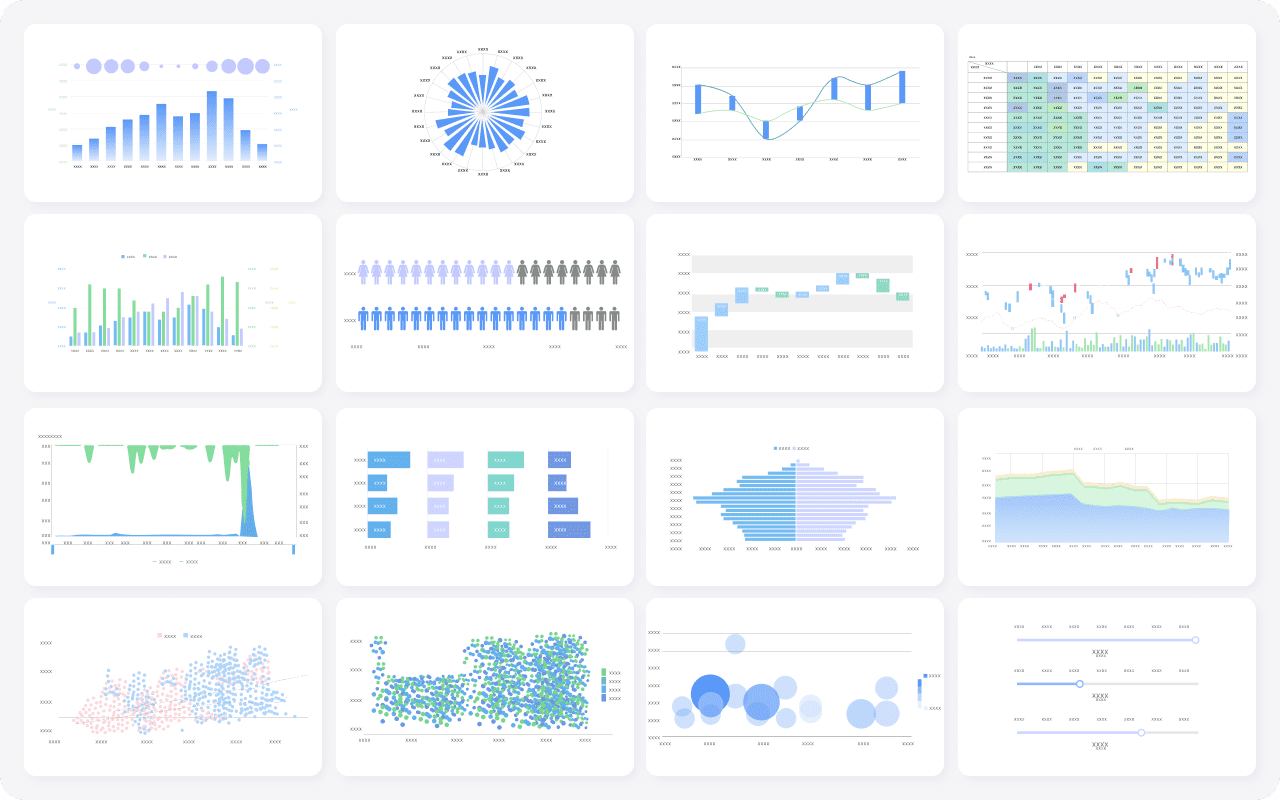
FineVis stands as a powerful tool in the realm of data visualization. You can unlock insights and visualize success with its comprehensive suite of features. FineVis offers over 60 chart types, allowing you to present data in various forms that suit your needs. Whether you need bar charts, line graphs, or pie charts, FineVis provides the flexibility to create compelling visual narratives.
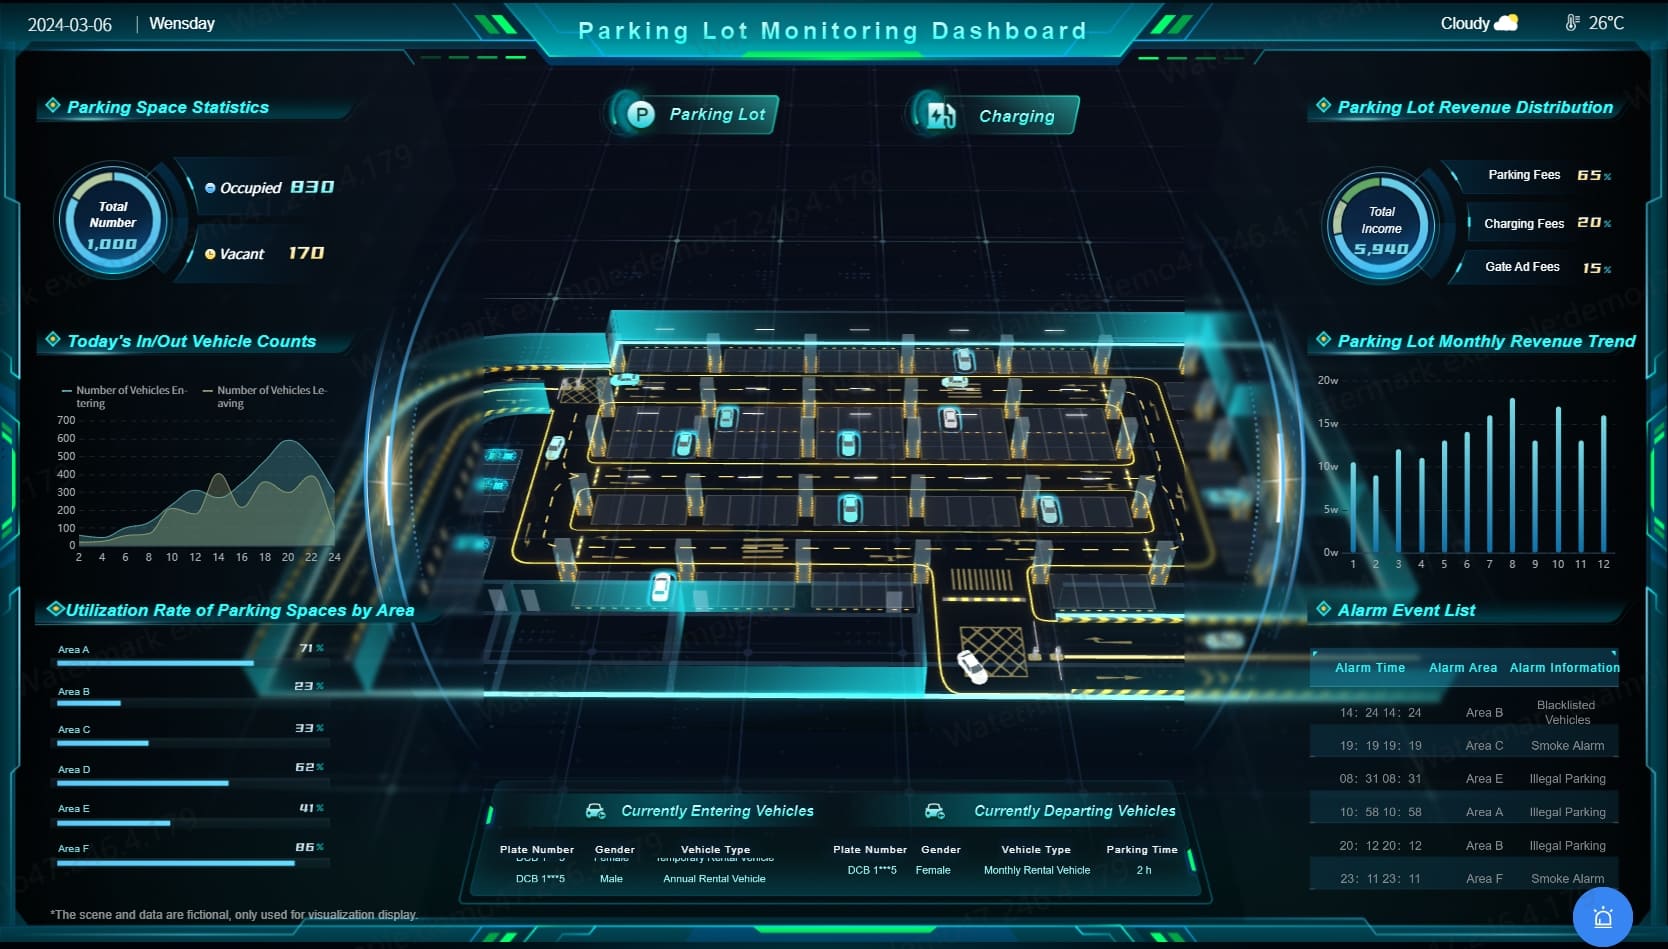
- Dynamic 3D Visualizations: FineVis enables you to create dynamic 3D visualizations. This feature allows you to explore data from different angles, enhancing your understanding of complex datasets. You can use these visualizations to present data in a more engaging and interactive manner.
- Customizable Dashboards: With FineVis, you can design dashboards that cater to your specific requirements. The drag-and-drop interface simplifies the process, making it accessible even if you lack technical expertise. You can customize dashboards to highlight key metrics and trends, ensuring that you focus on the most relevant data.
- Real-time Analytics: FineVis supports real-time analytics, allowing you to make informed decisions quickly. You can monitor data as it updates, providing you with the latest insights. This capability is crucial in fast-paced environments where timely information is essential.
- Adaptive Design: FineVis ensures that your visualizations are accessible across various devices. Whether you're using a smartphone, tablet, or PC, FineVis adapts to provide a seamless experience. This adaptability ensures that you can access and analyze data anytime, anywhere.
By integrating FineVis with other tools like FineDataLink, you can enhance your data management capabilities. FineDataLink revolutionizes data integration, ensuring that your data is accurate and up-to-date. FineReport complements this by enabling you to create dynamic reports and dashboards. Together, these tools provide a comprehensive solution for managing and visualizing tabular data effectively.
Tabular data, with its structured rows and columns, forms the backbone of data analysis and machine learning. You find it essential for building predictive models and conducting various analytical techniques. Its significance spans across applications, from business intelligence to scientific research. As technology evolves, you can expect advancements in how tabular data is handled and utilized, enhancing its efficiency and accessibility. FanRuan plays a pivotal role in this evolution, offering innovative solutions like FineDataLink and FineReport that streamline data management and visualization, empowering you to make informed decisions with ease.
FAQ
Tabular data organizes information in rows and columns. Each row represents a record, while each column represents an attribute of that record. This format simplifies data entry and retrieval, making it ideal for analysis and visualization.
You often encounter tabular data in spreadsheets like Microsoft Excel or Google Sheets. Databases also use tabular structures to store and manage large volumes of information efficiently. These formats are prevalent in business, research, and educational settings.
Tabular data provides a structured format that facilitates easy manipulation and analysis. You can sort, filter, and aggregate data to uncover patterns and trends. This capability supports data-driven decision-making and enhances your ability to derive meaningful insights.
Common challenges include data quality issues such as missing values, inconsistent formats, and duplicate records. Addressing these issues is crucial for reliable analysis. Implementing best practices like data validation and regular audits can help maintain data integrity.
FineVis offers powerful tools for creating dynamic visualizations. You can design and display visual dashboards on various devices, enhancing accessibility and efficiency. With features like high-quality 3D visualizations, FineVis optimizes decision-making and management across diverse scenarios.
Yes, tabular data is fundamental in machine learning. It serves as the foundation for developing predictive models. You can use it for feature engineering, model training, and evaluation, enabling you to make data-driven decisions and unlock the full potential of your datasets.
Continue Reading About Tabular Data
How to Access the Chrysler Employee Portal and Dashboard Anywhere
Access the Chrysler employee portal with ease using Dashboard Anywhere. Follow simple steps to log in with your Employee ID and password for seamless access.
Lewis
Nov 05, 2024
2025 Best Data Integration Solutions and Selection Guide
Explore top data integration solutions for 2025, enhancing data management and operational efficiency with leading platforms like Fivetran and Talend.
Howard
Dec 19, 2024
Augmented Analytics: Unlock the Core Concepts & Benefits!
Discover augmented analytics—where AI and ML automate data prep and insights, revolutionizing decision-making for smarter, faster business strategies!
Lewis
Mar 04, 2025
2025 Data Pipeline Examples: Learn & Master with Ease!
Unlock 2025’s Data Pipeline Examples! Discover how they automate data flow, boost quality, and deliver real-time insights for smarter business decisions.
Howard
Feb 24, 2025
Best Data Integration Platforms to Use in 2025
Explore the best data integration platforms for 2025, including cloud-based, on-premises, and hybrid solutions. Learn about key features, benefits, and top players.
Howard
Jun 20, 2024
Best Data Management Tools of 2025
Explore the best data management tools of 2025, including FineDataLink, Talend, and Snowflake. Learn about their features, pros, cons, and ideal use cases.
Howard
Aug 04, 2024


