

Data manipulation transforms raw data into a usable format, making it essential for effective data analysis. You rely on data manipulation to ensure accuracy and consistency in your datasets. This process is crucial for extracting valuable insights and optimizing business operations. Tools like FineDataLink, FineReport, FineBI, and FineVis enhance your ability to manipulate data efficiently. By mastering data manipulation, you can make informed decisions and drive strategic growth in your organization. As data volumes grow, the importance of data manipulation becomes even more pronounced, ensuring that your data remains accessible and actionable.
Objectives of Data Manipulation
Data manipulation serves several key objectives that enhance the quality and usability of your data. By understanding these objectives, you can better appreciate the role data manipulation plays in your data-driven endeavors.
Enhancing Data Quality
Improving Accuracy
You aim to improve the accuracy of your data through manipulation. This involves correcting errors and ensuring that the data reflects reality as closely as possible. Accurate data forms the foundation for reliable analysis and decision-making. When you remove inaccuracies, you increase the trustworthiness of your data, which is crucial for generating meaningful insights.
Ensuring Consistency
Consistency in data means that the information remains uniform across different datasets and time periods. You achieve this by standardizing formats, units, and terminologies. Consistent data allows you to compare and combine datasets effectively, leading to more comprehensive analyses. By ensuring consistency, you eliminate discrepancies that could skew results and lead to incorrect conclusions.
Facilitating Data Analysis
Preparing Data for Analysis
Before you can analyze data, it must be prepared. This preparation involves organizing and structuring the data in a way that makes it ready for analysis. You might need to sort, filter, or transform the data to fit the requirements of your analytical tools. Proper preparation ensures that your analysis is efficient and that the results are valid.
Streamlining Data Processing
Streamlining data processing involves optimizing the steps you take to handle data. By automating repetitive tasks and using efficient algorithms, you can process data faster and with fewer errors. This efficiency is crucial when dealing with large datasets, as it saves time and resources. Streamlined processing allows you to focus on interpreting results rather than getting bogged down in data handling tasks.
"Data manipulation provides consistent data, projects data, creates more value from the data, and removes unneeded data." This quote highlights the transformative power of data manipulation in enhancing both the quality and utility of your data.
Steps Involved in Data Manipulation
Data manipulation involves several key steps involved that transform raw data into a format suitable for analysis. Understanding these steps helps you manage data effectively and extract valuable insights.
Data Collection
Data collection forms the foundation of any data manipulation process. You gather raw data from various sources to begin your analysis journey.
Gathering Raw Data
You start by collecting raw data. This data comes from multiple sources, such as databases, spreadsheets, or online repositories. The goal is to accumulate a comprehensive dataset that represents the subject of your analysis. For instance, in a study on wine quality, you might collect data on different wine attributes like acidity, sugar content, and alcohol levels.
Identifying Data Sources
Identifying reliable data sources is crucial. You need to ensure that the data you collect is accurate and relevant. This step involves evaluating the credibility of sources and selecting those that provide the most pertinent information. Reliable sources enhance the quality of your analysis and lead to more accurate conclusions.
Once you have collected data, the next step is data cleaning. Data cleaning ensures that your dataset is free from errors and inconsistencies.
Removing Duplicates
You remove duplicate entries to maintain the integrity of your dataset. Duplicate data can skew analysis results and lead to incorrect conclusions. By eliminating these redundancies, you ensure that each data point contributes uniquely to your analysis.
Handling Missing Values
Handling missing values is another critical aspect of data cleaning. You address gaps in your dataset by either filling them with estimated values or removing incomplete entries. This step ensures that your analysis remains robust and that missing data does not compromise the validity of your results.
Data Transformation
Data transformation involves converting your cleaned data into a format suitable for analysis. This step enhances the usability of your dataset.
Normalization
Normalization adjusts data values to a common scale. You apply this technique to ensure that different variables contribute equally to your analysis. For example, when analyzing wine quality, you might normalize attributes like acidity and sugar content to compare them effectively.
Aggregation
Aggregation involves summarizing data by combining multiple data points. You use this technique to derive meaningful insights from large datasets. For instance, you might aggregate wine quality data to determine average ratings across different regions. This step simplifies complex datasets and highlights key trends.
"Data manipulation provides consistent data, projects data, creates more value from the data, and removes unneeded data." This quote underscores the transformative power of data manipulation in enhancing both the quality and utility of your data.
Types of Data Manipulation
Data manipulation plays a pivotal role in transforming raw data into actionable insights. You can categorize data manipulation into two primary types: descriptive and predictive. Each type serves distinct purposes and employs different techniques to enhance your data analysis capabilities.
Descriptive Manipulation
Descriptive manipulation focuses on summarizing and visualizing data to provide a clear understanding of past and present trends. This type of manipulation helps you make sense of large datasets by highlighting key patterns and insights.
Summarizing Data
When you summarize data, you condense large volumes of information into digestible formats. This process involves calculating averages, totals, and other statistical measures. By summarizing data, you can quickly identify trends and anomalies. For example, summarizing sales data can reveal peak sales periods and underperforming products. This step is crucial for making informed decisions based on historical data.
Visualizing Data
Visualization tools like FineVis offer dynamic 3D visualizations and customizable dashboards. These tools help you uncover hidden patterns and relationships within your data. Effective visualization enhances your ability to convey insights to stakeholders and drive strategic decisions.
Predictive Manipulation
Predictive manipulation involves using historical data to forecast future trends and model potential outcomes. This type of manipulation empowers you to anticipate changes and make proactive decisions.
Forecasting Trends
Forecasting trends involves analyzing historical data to predict future patterns. You use statistical models and algorithms to project future values based on past behavior. For instance, you might forecast sales trends to optimize inventory management. Accurate forecasting enables you to prepare for upcoming challenges and opportunities, ensuring that your business remains competitive.
Modeling Data
Modeling data involves creating mathematical representations of real-world processes. You use these models to simulate scenarios and evaluate potential outcomes. Data modeling helps you understand complex systems and test hypotheses. For example, you might model customer behavior to improve marketing strategies. By leveraging data models, you can make data-driven decisions that align with your business objectives.
"Data manipulation provides consistent data, projects data, creates more value from the data, and removes unneeded data." This quote underscores the transformative power of data manipulation in enhancing both the quality and utility of your data.
Differentiating Data Manipulation and Data Modification
Understanding the distinction between data manipulation and data modification is crucial for effective data management. Although these terms often appear interchangeably, they serve different purposes in data processing.
Definitions and Key Differences
Purpose and Scope
Data manipulation involves adjusting data to make it more organized and readable. You focus on transforming raw data into a structured format that enhances its usability. This process includes tasks like sorting, filtering, and aggregating data. By manipulating data, you ensure that it is ready for analysis and decision-making.
In contrast, data modification refers to changing the data itself. You alter the actual content of the data, which may involve updating values, adding new records, or deleting existing ones. The primary goal of data modification is to maintain the accuracy and relevance of the dataset.
"Data manipulation provides consistent data, projects data, creates more value from the data, and removes unneeded data." This quote highlights the role of data manipulation in enhancing data quality without altering the original content.
Techniques Used
Data manipulation employs techniques that focus on organizing and structuring data. You might use methods such as:
- Sorting: Arranging data in a specific order to facilitate analysis.
- Filtering: Selecting specific data points based on criteria to focus on relevant information.
- Aggregation: Summarizing data by combining multiple entries to derive insights.
These techniques help you prepare data for analysis without changing its inherent values.
On the other hand, data modification involves techniques that directly alter the data. You might engage in:
- Updating: Changing existing data values to reflect new information.
- Inserting: Adding new data entries to expand the dataset.
- Deleting: Removing outdated or irrelevant data to maintain dataset integrity.
These actions ensure that your data remains current and accurate, supporting informed decision-making.
By understanding these differences, you can effectively manage your data processes and enhance your analytical capabilities.
Tools and Techniques for Data Manipulation
To effectively manipulate data, you need the right tools and techniques. These resources help you transform raw data into actionable insights, making your analysis more efficient and accurate.
Data Manipulation Tools
Data manipulation tools streamline the process of organizing and transforming data. They offer features that automate repetitive tasks, allowing you to focus on analysis rather than manual data entry.
Excel
Excel is a widely used tool for data manipulation. It provides a range of functions and formulas that allow you to sort, filter, and analyze data efficiently. With Excel, you can create pivot tables to summarize large datasets, making it easier to identify trends and patterns. Its user-friendly interface makes it accessible for users at all skill levels.
Python Libraries
Python offers powerful libraries like Pandas and NumPy for data manipulation. These libraries provide functions for data cleaning, transformation, and analysis. With Pandas, you can handle large datasets with ease, performing operations like merging, grouping, and reshaping data. NumPy enhances numerical computations, allowing you to perform complex calculations quickly.
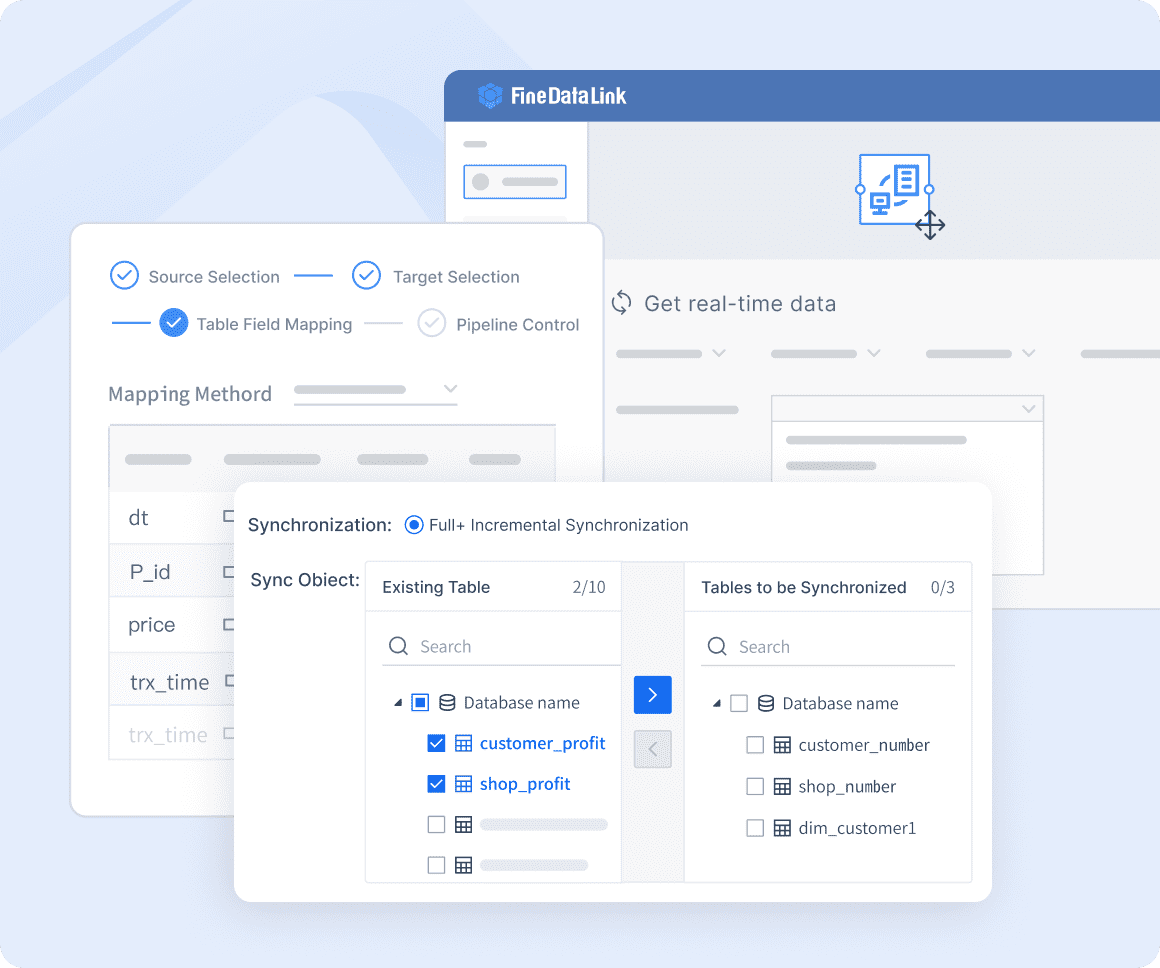
FanRuan's FineDataLink
FineDataLink is an enterprise-level data integration platform that simplifies data manipulation tasks. It offers real-time data synchronization and advanced ETL (Extract, Transform, Load) capabilities. With FineDataLink, you can automate data preprocessing, reducing manual efforts and improving efficiency. Its low-code platform allows you to integrate data from various sources seamlessly, ensuring that your data remains accurate and up-to-date.
Data Manipulation Techniques
Mastering data manipulation techniques is essential for transforming raw data into meaningful insights. These techniques help you organize and structure data, making it ready for analysis.
SQL Queries
SQL (Structured Query Language) is a powerful tool for data manipulation. You use SQL queries to retrieve, update, and manage data in databases. With SQL, you can filter data based on specific criteria, join tables to combine datasets, and aggregate data to calculate sums, averages, and other metrics. This language is essential for managing large datasets efficiently.
Scripting
Scripting involves writing code to automate data manipulation tasks. You can use scripting languages like Python or R to create scripts that clean, transform, and analyze data. Scripting allows you to customize data manipulation processes, tailoring them to your specific needs. By automating repetitive tasks, you save time and reduce the risk of errors.
"Data manipulation tools handle the heavy lifting for you by making it easier to modify existing data to organize, read, and use it." This quote emphasizes the importance of using the right tools and techniques to enhance your data manipulation capabilities.
Practical Examples of Data Manipulation

Data manipulation plays a crucial role in transforming raw data into actionable insights. By applying various techniques, you can enhance your understanding of data and make informed decisions. Let's explore some practical examples of data manipulation in different fields.
Business Applications
In the business world, data manipulation is essential for optimizing operations and gaining a competitive edge. You can leverage data to analyze customer behavior, forecast sales, and generate insightful reports.
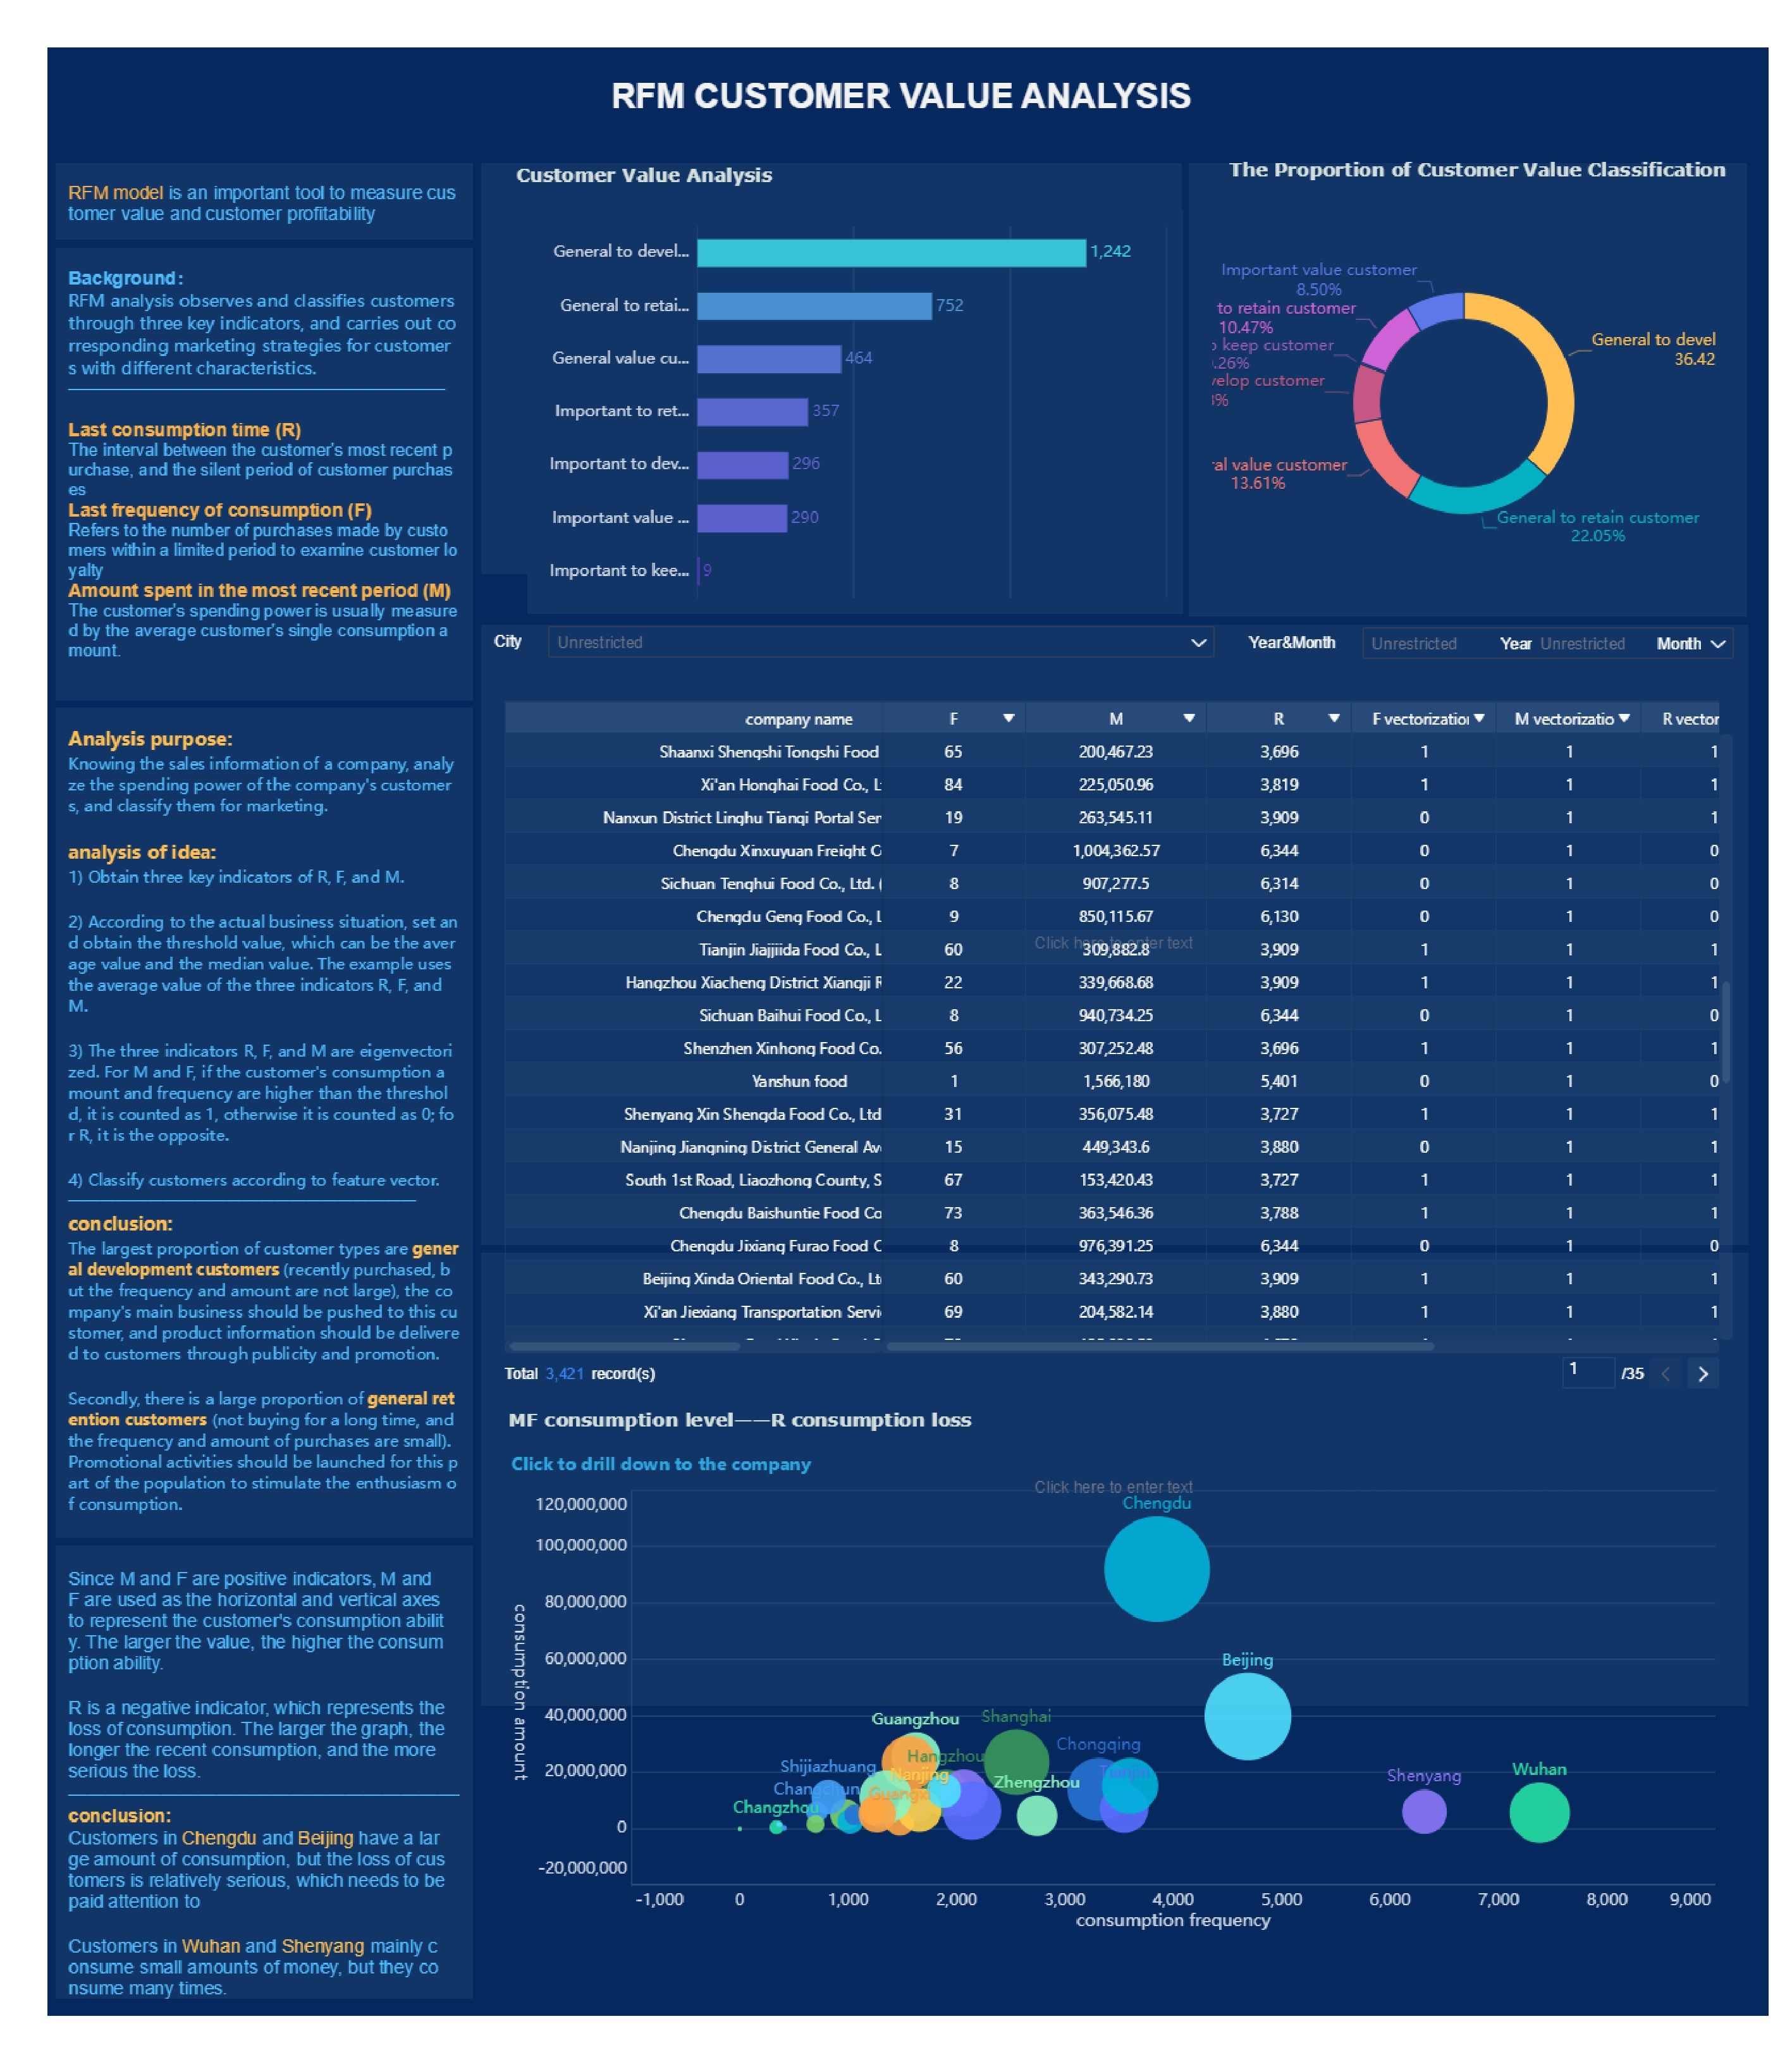
Customer Data Analysis
Analyzing customer data helps you understand consumer behavior and preferences. By manipulating data, you can segment customers based on demographics, purchase history, and engagement levels. This segmentation allows you to tailor marketing strategies and improve customer satisfaction. For instance, you might use FineReport to create detailed reports that highlight customer trends and preferences, enabling you to make data-driven decisions.
Sales Forecasting
Sales forecasting involves predicting future sales based on historical data. You can use data manipulation techniques to identify patterns and trends in sales data. By doing so, you can anticipate demand fluctuations and adjust inventory levels accordingly. FineReport can assist you in visualizing sales trends, making it easier to forecast future sales and optimize inventory management.
Using FineReport for Reporting
FineReport is a powerful tool for generating comprehensive business reports. It allows you to manipulate data from various sources and create dynamic dashboards. With FineReport, you can automate report generation, ensuring that stakeholders receive timely and accurate information. This capability enhances decision-making and streamlines business operations.

Scientific Research
In scientific research, data manipulation is vital for modeling data, conducting statistical analysis, and deriving meaningful insights. You can use these techniques to validate hypotheses and advance scientific knowledge.
Data Modeling
Data modeling involves creating mathematical representations of real-world phenomena. By manipulating data, you can simulate scenarios and evaluate potential outcomes. FineBI offers robust data modeling capabilities, allowing you to explore complex datasets and uncover hidden patterns. This process aids in hypothesis testing and enhances your understanding of scientific phenomena.
Statistical Analysis
Statistical analysis is a cornerstone of scientific research. You can use data manipulation to clean and organize data, making it suitable for statistical tests. FineBI provides tools for conducting advanced statistical analysis, enabling you to draw valid conclusions from your data. By leveraging these capabilities, you can ensure the accuracy and reliability of your research findings.
Utilizing FineBI for Insights
FineBI empowers researchers to gain insights from large datasets. Its intuitive interface and powerful analytics features allow you to manipulate data effortlessly. With FineBI, you can create interactive visualizations that highlight key trends and relationships. These insights can inform research decisions and contribute to scientific advancements.
"Data manipulation ensures accurate data and leads to accurate insights, helping in making optimal decisions based on valuable information." This quote underscores the importance of data manipulation in both business and scientific contexts.

Best Practices for Effective Data Manipulation
To harness the full potential of data manipulation, you must adhere to best practices that ensure data integrity and maintain comprehensive documentation. These practices not only enhance the quality of your data but also streamline your analytical processes.
Ensuring Data Integrity
Data integrity is crucial for reliable analysis. You need to implement strategies that validate your data and conduct regular audits to maintain its accuracy and consistency.
Validating Data
Validation is the process of validating your data for accuracy and completeness. You should establish criteria that your data must meet before it is used in analysis. This might involve setting rules for data entry or using software tools to automatically check for errors. By validating data, you ensure that your analysis is based on accurate information, leading to more reliable insights.
Conducting regular audits helps you identify and rectify any discrepancies in your data. You should schedule periodic reviews of your datasets to check for inconsistencies or errors. Audits can reveal issues such as duplicate entries or outdated information. By addressing these problems promptly, you maintain the integrity of your data and enhance the reliability of your analysis.
"Data manipulation is critical for process efficiency and optimization. It provides a way to see data more clearly within a big picture." This insight underscores the importance of maintaining data integrity to achieve effective data manipulation.
Maintaining Documentation
Proper documentation is essential for tracking changes and ensuring that your data manipulation processes are transparent and reproducible. You should record all modifications and implement version control to manage your datasets effectively.
Recording Changes
You must document every change made to your data. This includes noting the reasons for modifications and the methods used. Keeping detailed records allows you to trace the history of your data, making it easier to understand how it has evolved over time. This practice is particularly important when collaborating with others, as it ensures that everyone has access to the same information.
Version Control
Version control involves managing different versions of your datasets. You should use software tools that allow you to track changes and revert to previous versions if necessary. This practice prevents data loss and ensures that you can recover from errors quickly. By implementing version control, you maintain a clear record of your data's evolution, which is vital for accurate analysis.
By following these best practices, you can enhance the quality and reliability of your data manipulation efforts, leading to more accurate and actionable insights.
The Role of Visualization in Data Manipulation

Visualization plays a crucial role in data manipulation. It transforms complex datasets into understandable visuals, making it easier for you to interpret and communicate insights. By leveraging visualization, you can enhance your data analysis capabilities and make informed decisions.
Importance of Visual Representation
Enhancing Understanding
Visual representation helps you grasp complex data quickly. When you see data in charts or graphs, you can identify patterns and trends more easily than with raw numbers. This visual clarity allows you to understand the data's story and draw meaningful conclusions. For instance, a line graph can show sales trends over time, helping you spot peaks and troughs at a glance.
Facilitating Communication
Visuals make it easier to share insights with others. When you present data visually, you can communicate findings effectively to stakeholders who may not have a technical background. This approach ensures that everyone understands the key points and can contribute to decision-making. A well-designed chart or infographic can convey complex information succinctly, making it accessible to a broader audience.
Tools for Visualization
FineVis for Dynamic Visualizations
FineVis offers powerful tools for creating dynamic visualizations. With FineVis, you can transform raw data into interactive charts and dashboards. These visualizations help you explore data from different angles and uncover hidden insights. FineVis supports a wide range of chart types, allowing you to choose the best format for your data. Its user-friendly interface makes it easy for you to create stunning visuals without coding skills.

Integrating with Other Tools
You can enhance your data manipulation efforts by integrating FineVis with other tools. This integration allows you to combine data from multiple sources and create comprehensive visualizations. By using FineVis alongside other data manipulation tools, you can streamline your workflow and improve efficiency. This synergy ensures that your data remains accurate and up-to-date, providing a solid foundation for analysis.
In this blog, you explored the essential aspects of data manipulation, from its objectives to practical applications. You learned how crucial it is to apply best practices like ensuring data integrity and maintaining documentation. These practices enhance the reliability of your data analysis. As you continue your journey in data science, consider delving deeper into advanced tools and techniques. This exploration will empower you to harness data's full potential, driving informed decisions and strategic growth in your endeavors.
FAQ
Data manipulation involves adjusting, organizing, and transforming data to make it suitable for analysis. You use it to clean, sort, and structure data, making it easier to read and use. This process is essential in fields like accounting, stock market analysis, and web server logs.
Data manipulation is vital because it turns raw data into a usable format. It enhances data quality, making it more accurate and consistent. By manipulating data, you can extract valuable insights, which are crucial for informed decision-making and strategic growth.
You can employ various techniques, such as:
Data Cleaning: Removing inaccuracies and inconsistencies.
Data Transformation: Converting data into different formats.
Data Aggregation: Summarizing data to derive insights.
Data Sorting: Arranging data in a specific order.
These techniques help you prepare data for analysis and ensure its reliability.
Data manipulation focuses on organizing and structuring data without altering its inherent values. You might sort or filter data to make it more readable. In contrast, data modification involves changing the actual content, such as updating values or adding new records, to maintain dataset accuracy.
Yes, improper data manipulation can lead to inaccurate results. For instance, data manipulation attacks occur when adversaries subtly alter data for gain, affecting data integrity. It's crucial to use reliable methods and tools to ensure data remains accurate and trustworthy.
To maintain ethical standards, you should:
Avoid manipulative methods that engineer desired outcomes.
Ensure transparency in your data processes.
Validate data regularly to maintain its integrity.
By adhering to these practices, you can uphold the ethical use of data in your analyses.
Several tools can aid you, including:
Excel: For basic data sorting and analysis.
Python Libraries: Such as Pandas and NumPy for advanced manipulation.
FineDataLink: An enterprise-level platform for real-time data integration and ETL processes.

Continue Reading About Data Manipulation
2025 Best Data Integration Solutions and Selection Guide
Explore top data integration solutions for 2025, enhancing data management and operational efficiency with leading platforms like Fivetran and Talend.
Howard
Dec 19, 2024
2025's Best Data Validation Tools: Top 7 Picks
Explore the top 7 data validation tools of 2025, featuring key features, benefits, user experiences, and pricing to ensure accurate and reliable data.
Howard
Aug 09, 2024
Best Data Integration Vendors for Seamless Workflows
Discover the top 20 data integration vendors of 2025 for seamless workflows. Compare tools like Talend, AWS Glue, and Fivetran to optimize your data processes.
Howard
Jan 22, 2025
Best Data Management Tools of 2025
Explore the best data management tools of 2025, including FineDataLink, Talend, and Snowflake. Learn about their features, pros, cons, and ideal use cases.
Howard
Aug 04, 2024
Best Data Integration Platforms to Use in 2025
Explore the best data integration platforms for 2025, including cloud-based, on-premises, and hybrid solutions. Learn about key features, benefits, and top players.
Howard
Jun 20, 2024
Creating an Excel Dashboard: Easy Steps for Beginners
Learn to create Excel dashboards with templates for easy data visualization and analysis. Perfect for beginners seeking efficient insights.
Lewis
Nov 05, 2024

