

Data patterns in statistics are sequences or structures you can recognize in data. These patterns help you predict outcomes and make informed decisions. For instance, companies like Zomato use data patterns to personalize user experiences, leading to a 15% improvement in order conversions. Identifying data patterns is crucial for businesses. It allows them to optimize marketing campaigns and enhance customer retention. Tools like FineReport, FineBI, and FineVis empower you to uncover these patterns. They provide insights that drive strategic growth and efficiency. Understanding data patterns is essential for navigating today's data-driven world.
Understanding Data Patterns
What Are Data Patterns?
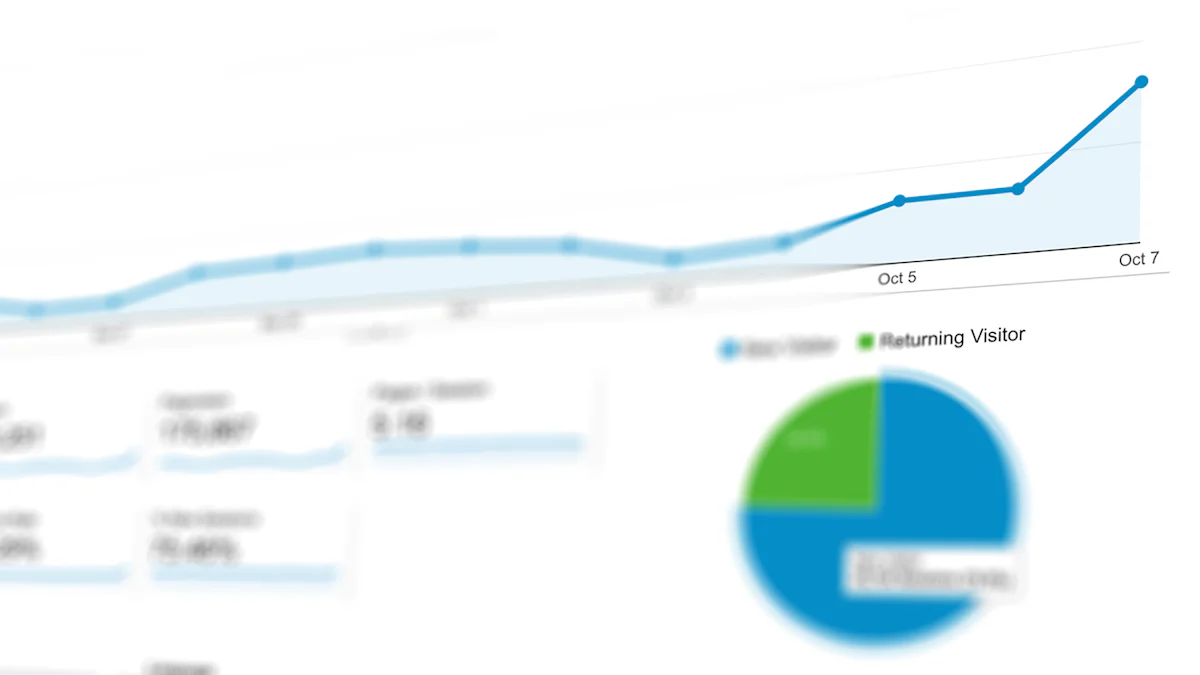
Data patterns are recognizable sequences or structures in data. They help you understand trends and make predictions. For example, when you look at a graph, you might see a line going up or down. This line represents a pattern. Patterns can show you how things change over time. They can also reveal relationships between different pieces of data. Recognizing these patterns is crucial for making informed decisions.
How Are Data Patterns Identified?
You can identify data patterns using various techniques. Here are some common methods:
- Statistical Analysis: This involves using mathematical formulas to summarize data. You can calculate averages, medians, and other statistics to find patterns. These calculations help you understand the central tendencies and variability in your data.
- Data Mining: This process involves searching through large datasets to find hidden patterns. You use algorithms to sift through data and uncover trends. Data mining can reveal insights that are not immediately obvious.
- Machine Learning Algorithms: These are computer programs that learn from data. They can identify complex patterns that humans might miss. Machine learning is especially useful for analyzing large datasets.
- Data Visualization: Creating graphs and charts helps you see patterns more clearly. Visual tools make it easier to spot trends and relationships in your data.
By using these techniques, you can uncover valuable information from your data. This knowledge helps you make better decisions and predict future outcomes.
Types of Data Patterns
Linear Patterns
Linear patterns show a consistent increase or decrease in data over time. You can often see these patterns as straight lines on graphs. For example, if you track your daily steps, you might notice a steady increase as you become more active. This linear trend helps you predict future activity levels. Businesses use linear patterns to understand customer behavior. By analyzing purchase history, they identify trends in product preferences. This insight allows companies to tailor marketing strategies effectively.
Exponential Patterns
Exponential patterns involve rapid increases or decreases. These patterns appear as curves on graphs, showing how data grows or shrinks at an accelerating rate. Imagine a viral video gaining views. Initially, the increase is slow, but it quickly skyrockets. This exponential growth helps you understand how trends can spread rapidly. In finance, analysts use exponential patterns to predict stock prices. By examining historical data, they develop models to forecast future market movements.
Cyclical Patterns
Cyclical patterns repeat over regular intervals. You can observe these patterns in seasonal trends, such as holiday shopping spikes. Retailers analyze cyclical patterns to optimize inventory and promotions. Understanding these cycles helps businesses prepare for peak demand periods. In weather forecasting, cyclical patterns reveal climate changes over time. By studying these patterns, meteorologists predict weather conditions and plan accordingly. Recognizing cyclical patterns allows you to anticipate changes and make informed decisions.
Irregular Patterns
Irregular patterns in data often defy the typical structures you might expect. Unlike linear or cyclical patterns, irregular patterns do not follow a predictable path. They can appear as sudden spikes or drops in data, making them challenging to interpret. You might encounter these patterns when analyzing customer purchase history. For instance, a sudden surge in sales of a particular product could indicate a successful marketing campaign or a viral trend.
When you examine datasets, you may notice outliers or clusters that don't fit the usual pattern. These irregularities can provide valuable insights. For example, identifying outliers in customer demographics might reveal niche markets or untapped opportunities. By understanding these irregular patterns, you can adapt your strategies to capitalize on unexpected trends.
Irregular patterns also play a crucial role in fields like finance. Historical stock prices often exhibit irregular fluctuations due to market events or economic changes. By analyzing these patterns, you can develop models to predict future stock movements with a certain level of accuracy. This ability to anticipate changes helps investors make informed decisions and manage risks effectively.
Importance of Data Patterns in Decision-Making
Business Applications
Data patterns play a crucial role in business decision-making. By analyzing these patterns, you can gain insights into customer behavior, market trends, and operational efficiency. For instance, businesses often use data patterns to forecast sales and optimize inventory levels. This helps in reducing costs and improving customer satisfaction.
Consider the case of retail sales forecasting. Using models like the Prophet model, businesses can capture the impact of promotions and holidays on sales. This leads to more accurate demand forecasts. As a result, you can better manage stock levels and avoid overstocking or stockouts.
In marketing, data patterns help you understand customer preferences and tailor campaigns accordingly. By analyzing purchase history and engagement data, you can identify which products or services resonate most with your audience. This allows you to allocate resources effectively and maximize return on investment.
Policy Formulation
Data patterns also influence policy formulation in various sectors. Policymakers rely on these patterns to understand societal trends and address emerging issues. For example, in public health, analyzing data patterns can reveal the spread of diseases and inform preventive measures.
In education, data patterns help identify areas where students struggle. By examining performance data, educators can develop targeted interventions to improve learning outcomes. This ensures that resources are allocated where they are needed most.
Environmental policies benefit from data patterns as well. By studying climate data, policymakers can identify trends in weather patterns and develop strategies to mitigate the impact of climate change. This proactive approach helps protect communities and preserve natural resources.
Data Patterns in Various Fields

Economics
In economics, data patterns help you understand market trends and consumer behavior. By analyzing these patterns, you can predict economic shifts and make informed decisions. For instance, economists often study employment data to identify trends in job growth or decline. This analysis helps policymakers develop strategies to boost employment rates.
You can also use data patterns to analyze inflation rates. By examining historical data, you can identify periods of high or low inflation. This insight allows you to anticipate changes in purchasing power and adjust economic policies accordingly. Understanding these patterns is crucial for maintaining economic stability and fostering growth.
Healthcare
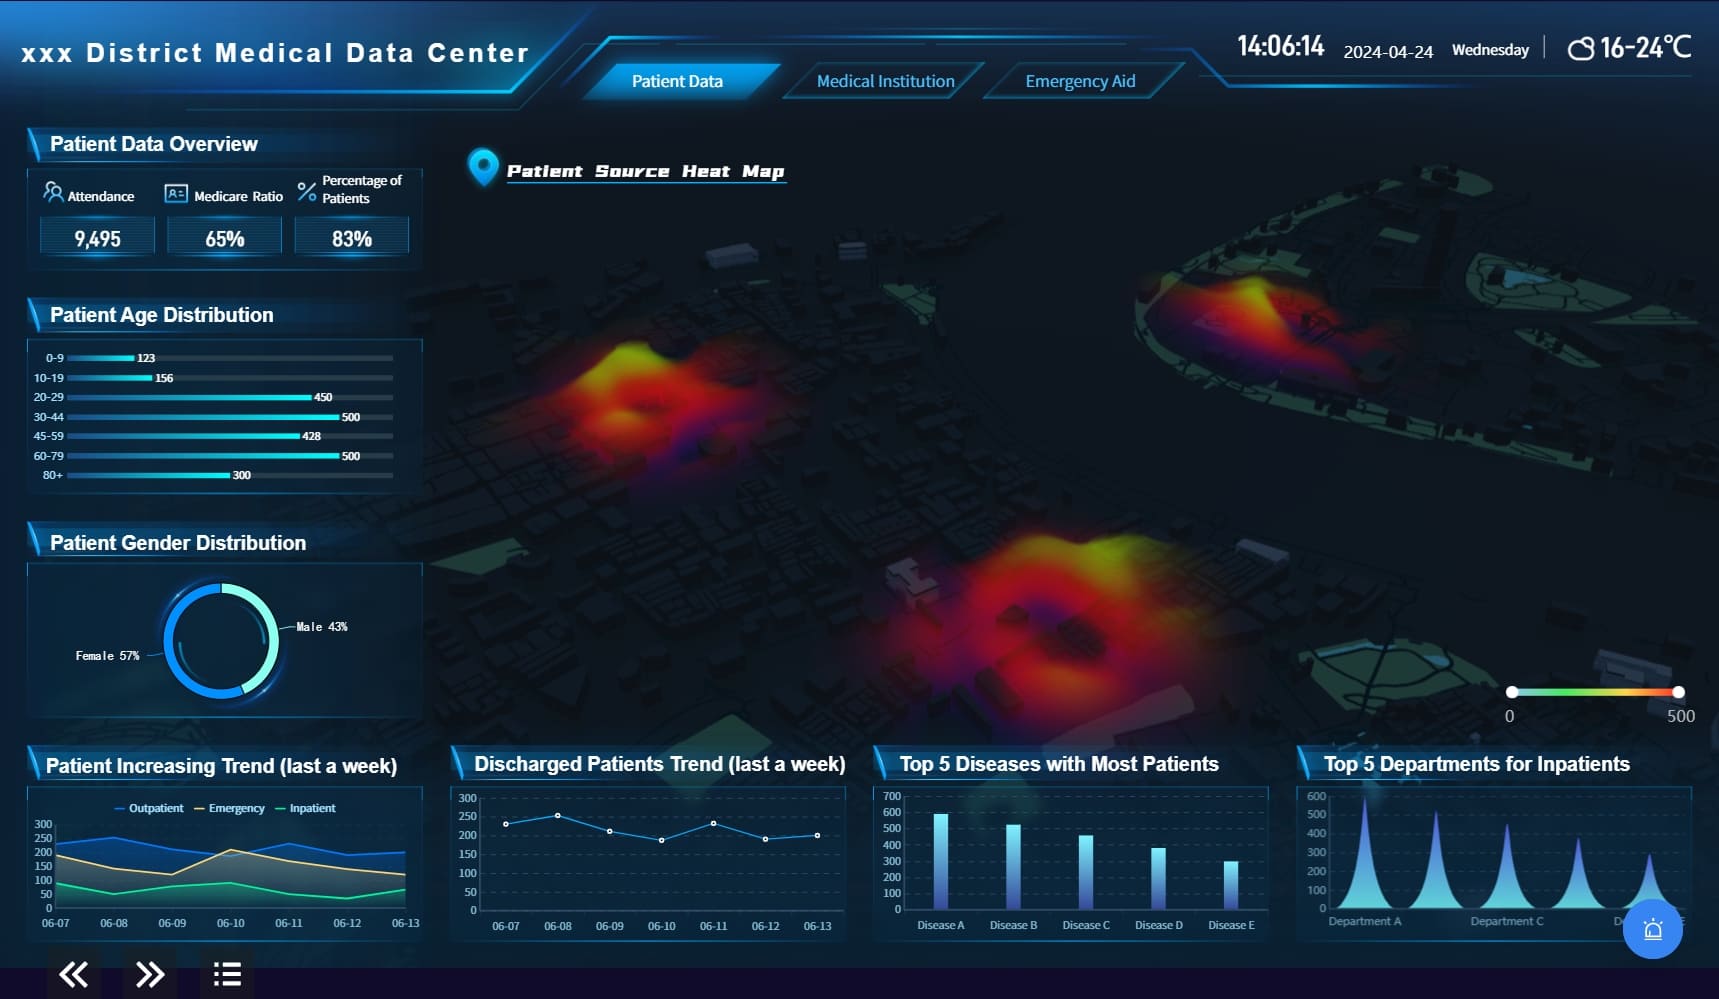
Data patterns play a vital role in healthcare by improving patient outcomes and operational efficiency. By analyzing patterns in patient data, you can identify risk factors for diseases and develop preventive measures. For example, healthcare providers use data patterns to track the spread of infectious diseases. This information helps them implement timely interventions and control outbreaks.
In addition, data patterns assist in optimizing hospital operations. By examining patient admission and discharge data, you can identify peak times and allocate resources effectively. This ensures that hospitals maintain high-quality care while minimizing wait times. Recognizing these patterns enhances the overall efficiency of healthcare systems.
Technology
In the technology sector, data patterns drive innovation and enhance user experiences. By analyzing patterns in user behavior, you can develop products that meet customer needs. For instance, tech companies use data patterns to personalize recommendations on streaming platforms. This customization improves user satisfaction and engagement.
Data patterns also inform cybersecurity strategies. By studying patterns in network traffic, you can identify potential threats and prevent cyberattacks. This proactive approach helps protect sensitive information and maintain system integrity. Understanding these patterns is essential for staying ahead in the rapidly evolving tech landscape.
Data Scientists at InstituteData emphasize the importance of pattern analysis in data science. They state, "By recognizing patterns, data scientists can extract valuable information, make predictions, and gain insights that would otherwise be challenging to obtain." This insight highlights the transformative power of data patterns across various fields, including economics, healthcare, and technology.
Challenges in Analyzing Data Patterns
Data Quality Issues
When you analyze data patterns, data quality issues become a significant challenge. Poor data quality can lead to incorrect conclusions and misguided decisions. You might encounter issues such as missing data, duplicate entries, or inaccurate information. These problems can distort the patterns you aim to identify.
To ensure reliable analysis, you must prioritize data cleaning. This process involves removing errors and inconsistencies from your dataset. By doing so, you enhance the accuracy of your findings. High-quality data allows you to uncover genuine patterns and make informed decisions.
In healthcare, for example, accurate data is crucial. Predictive analytics helps healthcare organizations save money by optimizing resources and identifying at-risk patients. However, this is only possible with clean and reliable data. When you maintain high data quality, you improve health outcomes and operational efficiency.
Complexity of Patterns
Data patterns can be complex and challenging to interpret. You might face difficulties when patterns do not follow straightforward trends. Complex patterns require advanced analytical techniques to decipher. You need to employ tools like machine learning algorithms to identify these intricate patterns.
In finance, pattern analysis can predict stock market trends. However, the complexity of financial data demands sophisticated models. You must use historical data to forecast future trends accurately. This requires a deep understanding of the data and the ability to apply advanced analytical methods.
Diagnostic patterns also present complexity. Identifying root causes of anomalies is crucial for troubleshooting. You need to analyze data thoroughly to pinpoint these causes. This process can be time-consuming and requires expertise in data analysis.
Despite these challenges, analyzing data patterns provides valuable insights. By overcoming data quality issues and complexity, you can make informed decisions. You gain a deeper understanding of trends and can draw meaningful conclusions. As technology advances, you will find more efficient ways to tackle these challenges and enhance your data analysis capabilities.
Role of FanRuan in Data Patterns Analysis
FanRuan plays a pivotal role in helping you analyze data patterns effectively. By leveraging its advanced tools, you can uncover valuable insights and make informed decisions. Let's explore how FineBI and FineReport contribute to this process.
FineBI for Identifying Data Patterns
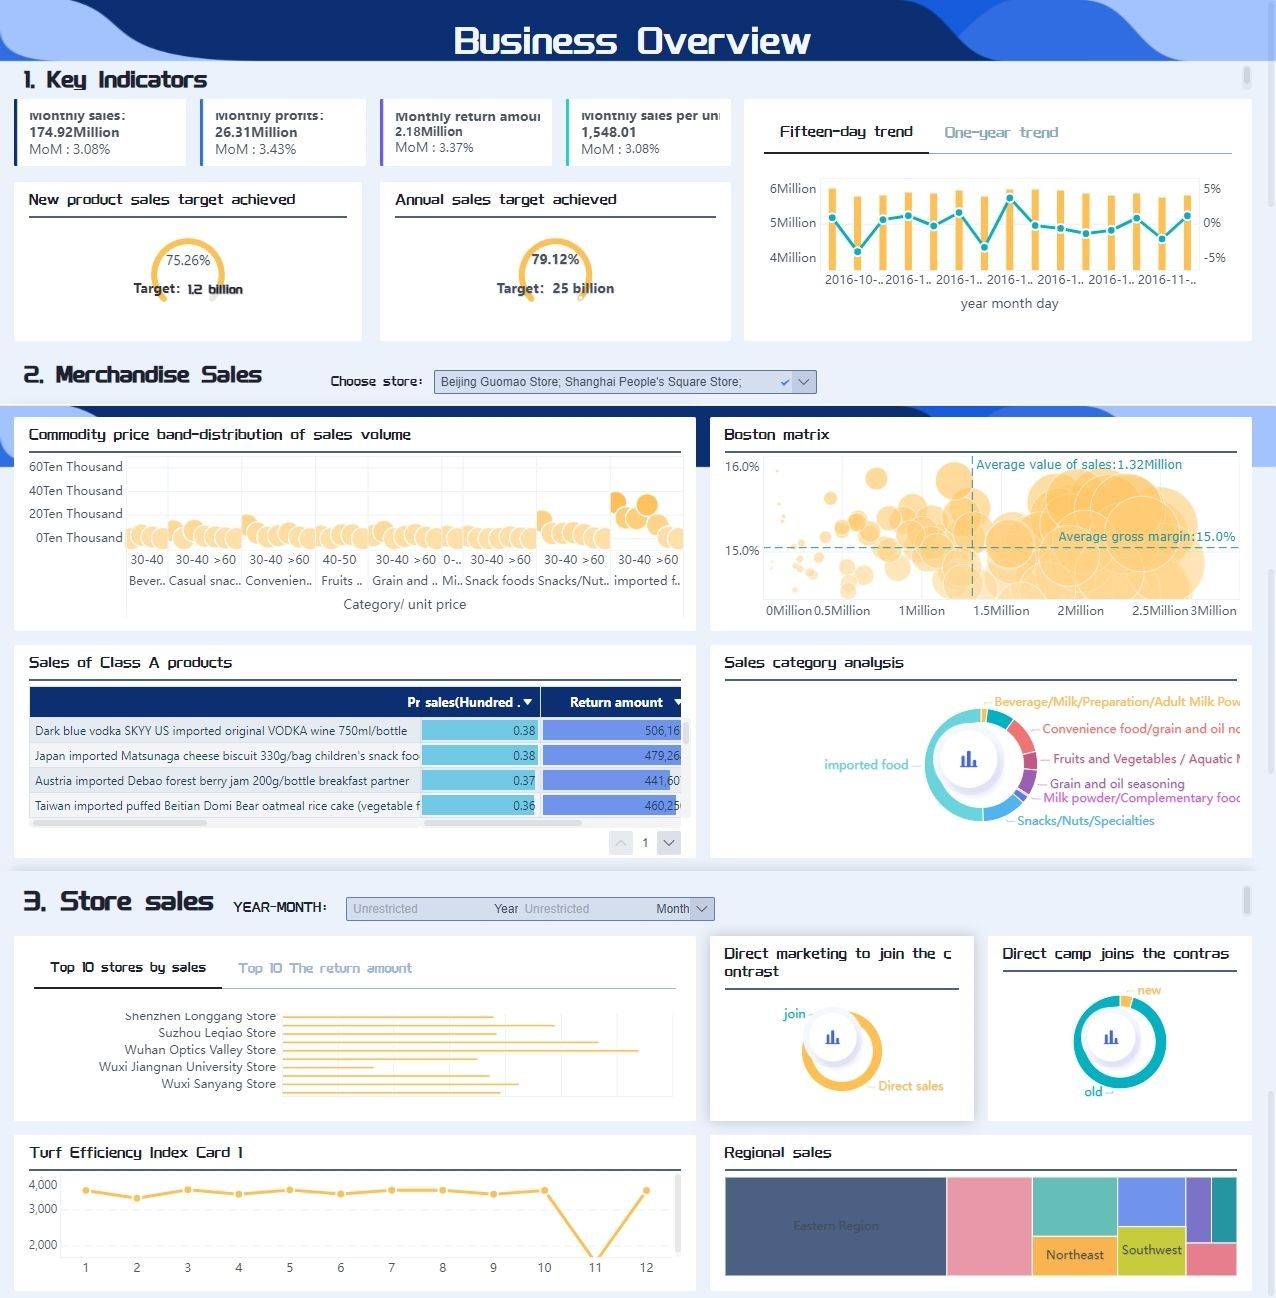
FineBI empowers you to identify data patterns with ease. This self-service business intelligence tool allows you to connect, analyze, and share data across your organization. You can transform raw data into insightful visualizations, track key performance indicators (KPIs), and predict future outcomes. FineBI's high-performance computing engine processes massive datasets, enabling you to uncover trends and correlations quickly.

- Data Connection: FineBI connects to various data sources, including big data platforms and relational databases. This capability ensures that you have access to comprehensive data for analysis.
- Visual Analysis: With FineBI, you can create visualizations using a drag-and-drop interface. This feature makes it easy for you to spot patterns and trends in your data.
- Real-Time Analysis: FineBI supports real-time data analysis, allowing you to gain immediate insights. This capability helps you identify significant data patterns as they emerge.
By using FineBI, you can enhance your data analysis efficiency by over 50%. This tool democratizes data analysis, making it accessible to everyone in your organization.

FineReport for Data Integration
FineReport excels in data integration, providing you with a unified view of your data. This enterprise-level reporting software connects to data from any source, uncovering deeper insights and delivering the reporting and analytics your business demands.
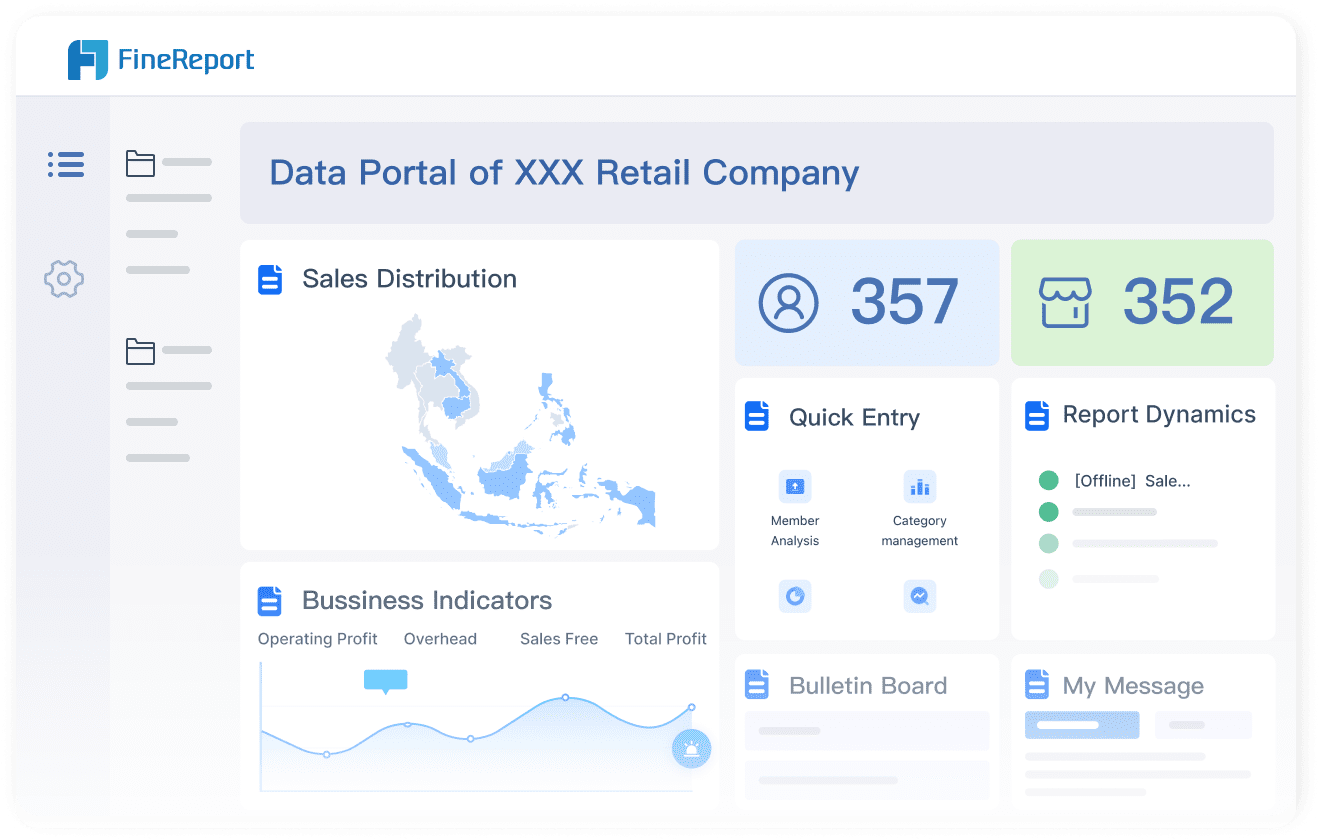
- Multi-Source Data Connection: FineReport integrates data from various databases and systems. This feature ensures that your data is consistent and accurate, facilitating comprehensive analysis.
- Flexible Report Designer: With FineReport's drag-and-drop interface, you can generate reports and dashboards quickly. This capability allows you to present data patterns clearly and effectively.
- Dynamic Data Integration: FineReport supports dynamic data integration into Word files, enabling you to create highly formatted and pixel-perfect reports.

FineReport's robust deployment and integration capabilities make it suitable for enterprise-level reporting needs. By consolidating data from multiple sources, you can overcome challenges such as data silos and complex data formats.
Survey Results: Data pattern analysis is crucial for organizations to make data-driven decisions and derive value from their data. By identifying recurring structures, trends, and behaviors within datasets, you can unlock valuable insights.
FanRuan's tools, FineBI and FineReport, provide you with the capabilities needed to analyze data patterns effectively. By leveraging these tools, you can enhance your decision-making process and drive strategic growth.
Future of Data Patterns Analysis
Advancements in Technology
Technology continues to evolve rapidly, transforming how you analyze data patterns. New tools and techniques make it easier for you to uncover insights from complex datasets. Machine learning and artificial intelligence (AI) play a significant role in this transformation. These technologies enable you to identify patterns that were previously difficult to detect.
- Machine Learning: Algorithms learn from data, allowing you to recognize intricate patterns. This capability helps you make predictions and improve decision-making processes.
- Artificial Intelligence: AI enhances your ability to process large volumes of data quickly. It automates pattern recognition, saving you time and effort.
- Cloud Computing: With cloud-based solutions, you can access powerful computing resources. This access allows you to analyze data patterns without investing in expensive hardware.
- Data Visualization Tools: Advanced visualization tools help you see patterns more clearly. They provide interactive charts and graphs, making it easier for you to interpret data.
FanRuan Software exemplifies these advancements with its FineReport tool. This BI reporting and dashboard software empowers you to create dynamic reports and dashboards. By leveraging such tools, you can stay ahead in the ever-evolving landscape of data analysis.
Emerging Trends
Several emerging trends shape the future of data pattern analysis. These trends influence how you approach data-driven decision-making.
- Real-Time Data Analysis: The demand for real-time insights grows. You need to analyze data as it is generated to respond quickly to changes. This trend requires tools that support instant data processing and visualization.
- Predictive Analytics: Predictive analytics becomes more prevalent. You use historical data to forecast future outcomes. This approach helps you anticipate trends and make proactive decisions.
- Data Democratization: Access to data analysis tools expands. You no longer need to rely solely on data scientists. Self-service BI tools empower you to explore data independently.
- Integration of IoT Data: The Internet of Things (IoT) generates vast amounts of data. You must integrate this data into your analysis to gain comprehensive insights.
By embracing these trends, you can enhance your data analysis capabilities. Staying informed about technological advancements and emerging trends ensures that you remain competitive in a data-driven world.
Practical Applications of Data Patterns
Case Studies
Data patterns play a crucial role in real-world scenarios. You can see their impact through various case studies. Let's explore a few examples.
- Retail Industry: Retailers use data patterns to optimize inventory management. By analyzing sales data, you can identify trends and predict demand. This helps in stocking the right products at the right time. For instance, a major retail chain used data patterns to reduce overstock by 20%. This led to significant cost savings and improved customer satisfaction.
- Healthcare Sector: In healthcare, data patterns help in predicting patient outcomes. Hospitals analyze patient data to identify risk factors for diseases. This allows for early intervention and better treatment plans. A study showed that hospitals using data patterns reduced readmission rates by 15%. This improvement enhances patient care and reduces costs.
- Finance and Banking: Financial institutions rely on data patterns for fraud detection. By examining transaction data, you can spot unusual patterns that indicate fraudulent activity. This proactive approach helps in preventing financial losses. A leading bank reported a 30% decrease in fraud cases after implementing pattern analysis.
Institute Data Blog highlights the role of data analysis and pattern recognition in predicting future outcomes accurately. This insight underscores the transformative power of data patterns across various industries.
Everyday Examples
Data patterns are not just for businesses. You encounter them in everyday life too. Here are some examples you might relate to.
- Weather Forecasting: Meteorologists use data patterns to predict weather conditions. By analyzing historical weather data, they identify patterns that indicate future weather changes. This helps you plan your day better, whether it's carrying an umbrella or dressing warmly.
- Fitness Tracking: Fitness apps analyze your activity data to provide insights. They identify patterns in your exercise routine and suggest improvements. For example, if you consistently run faster on certain days, the app might recommend those days for intense workouts.
- Streaming Services: Platforms like Netflix use data patterns to recommend shows. By analyzing your viewing history, they identify patterns in your preferences. This personalization enhances your viewing experience by suggesting content you are likely to enjoy.
- Traffic Management: Cities use data patterns to manage traffic flow. By analyzing traffic data, they identify peak hours and adjust signal timings. This reduces congestion and improves commute times.
Recognizing these patterns in daily life helps you make informed decisions. Whether it's planning your day or choosing what to watch, data patterns provide valuable insights. As technology advances, you will find even more ways to leverage data patterns for personal and professional growth.
Understanding data patterns holds immense significance. These patterns help you make sense of numbers, charts, and graphs, providing insights into underlying behaviors and predictions. By recognizing these elements, you gain a deeper understanding of your data, enabling more informed conclusions. You should explore and apply data pattern analysis across various fields. This practice can lead to better decision-making and problem-solving. As technology evolves, the potential for data pattern analysis continues to grow. Embrace this evolving landscape to unlock new opportunities and insights in your data-driven journey.
FAQ
Data patterns refer to recognizable sequences or structures within datasets. They help you understand trends, relationships, and behaviors. By identifying these patterns, you can make informed decisions and predictions.
Data patterns matter because they provide insights into trends and behaviors. Recognizing these patterns allows you to make data-driven decisions. For example, businesses use data patterns to optimize marketing strategies and improve customer retention.
You can identify data patterns using several methods:
Statistical Analysis: Use mathematical formulas to summarize data.
Data Mining: Search through large datasets to find hidden patterns.
Machine Learning: Employ algorithms that learn from data to identify complex patterns.
Data Visualization: Create graphs and charts to see patterns more clearly.
Common types of data patterns include:
Linear Patterns: Show consistent increases or decreases over time.
Exponential Patterns: Involve rapid growth or decline.
Cyclical Patterns: Repeat over regular intervals.
Irregular Patterns: Do not follow predictable paths and may include outliers.
Data patterns impact business decisions by providing insights into customer behavior, market trends, and operational efficiency. For instance, analyzing sales data patterns helps businesses forecast demand and manage inventory effectively.
You might face challenges such as data quality issues and the complexity of patterns. Poor data quality can lead to incorrect conclusions, while complex patterns require advanced analytical techniques to interpret.
Technology aids in analyzing data patterns through tools like machine learning and artificial intelligence. These technologies automate pattern recognition and enhance your ability to process large datasets quickly.
Yes, data patterns can predict future outcomes. By analyzing historical data, you can identify trends and make forecasts. This predictive capability helps you anticipate changes and make proactive decisions.
Data patterns apply to everyday life in various ways. For example, weather forecasting uses data patterns to predict conditions. Fitness apps analyze activity patterns to suggest improvements. Streaming services recommend shows based on viewing patterns.
FanRuan provides tools like FineBI and FineReport to help you analyze data patterns effectively. These tools offer features such as data integration, visual analysis, and real-time insights, empowering you to uncover valuable patterns and make informed decisions.

Continue Reading About Data Patterns
10 Game-Changing Project Management Reporting Types!
Unlock project success with 10 must-know reporting types! Track progress, manage risks, and stay on budget like a pro.
Lewis
Mar 03, 2025
2025 Data Pipeline Examples: Learn & Master with Ease!
Unlock 2025’s Data Pipeline Examples! Discover how they automate data flow, boost quality, and deliver real-time insights for smarter business decisions.
Howard
Feb 24, 2025
Best Data Integration Vendors for Seamless Workflows
Discover the top 20 data integration vendors of 2025 for seamless workflows. Compare tools like Talend, AWS Glue, and Fivetran to optimize your data processes.
Howard
Jan 22, 2025
Best Data Management Tools of 2025
Explore the best data management tools of 2025, including FineDataLink, Talend, and Snowflake. Learn about their features, pros, cons, and ideal use cases.
Howard
Aug 04, 2024
Data Validation Techniques: Secrets to Achieving Precision and Accuracy
Master data validation techniques from manual to machine learning methods. Ensure data quality with our practical steps.
Howard
Aug 06, 2024
Customer Data Integration: A Comprehensive Guide
Master customer data integration to enhance business operations by combining data from multiple sources for a comprehensive customer view.
Howard
Sep 07, 2024

