Project management reporting plays a vital role in ensuring project success. It involves creating structured reports that provide clarity on tasks, progress, and challenges. These reports keep your team informed, helping them focus on what works well. They also identify issues early, enabling corrective actions. By offering a clear overview of the project's status, they guide future decisions effectively.
Using tools like FineReport and FineBI enhances the quality of project management reports. FineReport simplifies report creation with its drag-and-drop interface, while FineBI empowers teams with real-time insights and self-service analytics. These tools ensure your reports are not only accurate but also visually engaging, making them ideal for executive presentations.
You can try it out in the demo model below:
Key Takeaways on Project Management Reporting
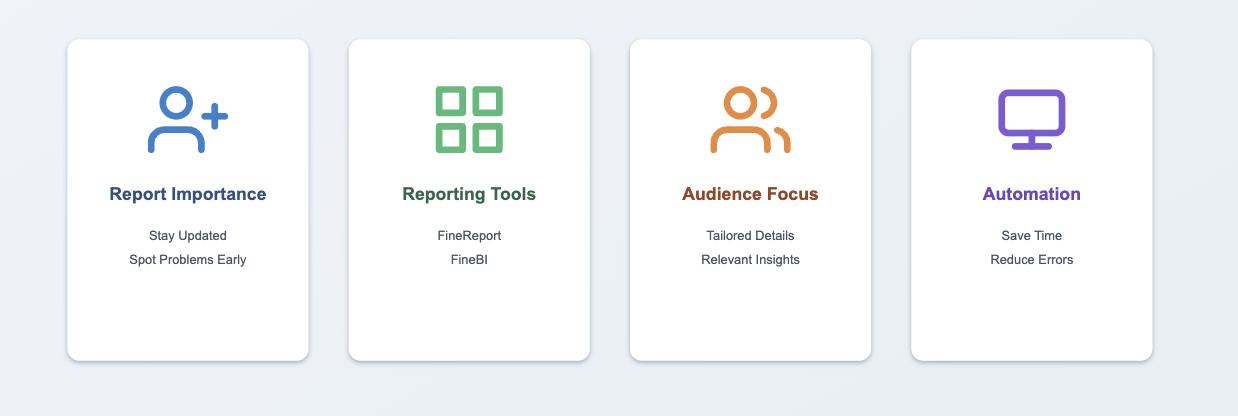
- Project management reports are important for project success. They help teams stay updated and spot problems early.
- Tools like FineReport and FineBI improve report quality. They make reports easy to create and show live updates.
- Make reports fit your audience. Different people need different details to stay on track.
- Automate reports to save time and avoid mistakes. Automation gives faster and more accurate updates.
- Visuals make hard data simple to understand. Use charts and dashboards to make decisions easier.
Understanding Project Management Reporting
What is Project Management Reporting?
Project management reporting involves creating structured documents that provide insights into a project's progress, challenges, and outcomes. These reports serve as a communication bridge between you and project stakeholders, ensuring everyone stays informed and aligned. They include various types, such as the project status report, project health report, and variance report. Each type plays a unique role in tracking performance, identifying risks, and ensuring project goals are met.

For example, a project status report keeps stakeholders updated on achievements, risks, and issues. A project health report evaluates performance against scope, schedule, and budget, helping you identify areas needing corrective action. Meanwhile, a variance report compares planned and actual performance, enabling you to address deviations effectively. Tools like FineReport simplify the creation of these reports with drag-and-drop features, while FineBI provides real-time insights for better decision-making.
Why is Project Management Reporting Essential for Success?
Effective project management reporting ensures your projects stay on track. It helps you monitor progress, manage resources, and address challenges proactively. Without clear reports, you risk miscommunication, delays, and budget overruns. For instance, a project budget report allows you to track financial health, ensuring resources are allocated efficiently. Similarly, a cost benefit analysis report helps you evaluate whether the project's benefits outweigh its costs.
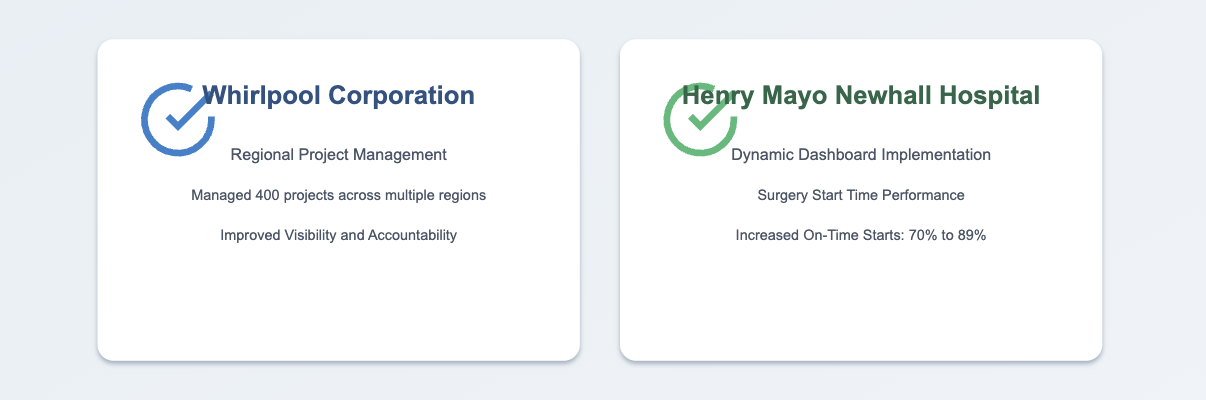
Consider successful projects like Whirlpool's initiative to manage 400 projects across regions. By implementing a robust reporting system, they improved visibility and accountability. Another example is Henry Mayo Newhall Hospital, which used dynamic dashboards to increase on-time surgery starts from 70% to 89%. These cases highlight how structured reporting can transform complex challenges into opportunities for success.
However, challenges like gathering accurate information or maintaining consistency in reports can arise. Standardized templates and tools like FineReport and FineBI address these issues by automating data collection and ensuring uniformity. FineBI's self-service analytics empower you to explore data independently, reducing reliance on IT teams.
By leveraging advanced tools and structured reporting, you can enhance collaboration, improve decision-making, and achieve project success.
Key Types of Project Management Reporting
Project Status Report
Purpose and Benefits of Project Status Reports
A project status report provides a comprehensive overview of your project's current state. It includes data on progress, risks, issues, and overall project health. This type of report ensures that stakeholders remain informed and aligned with the project's objectives. By offering a snapshot of the project's status, it helps you identify potential risks early and take corrective actions.
Compared to other types of project reports, a project status report focuses on the broader picture rather than specific tasks or milestones. For example, while a progress report details completed tasks, a status report evaluates overall project performance. The table below highlights the key differences:
| Report Type | Purpose | Content Overview |
|---|---|---|
| Project Status Report | Provides a comprehensive overview of the project's current state. | Includes data on progress, risks, issues, and overall project health. |
| Progress Report | Focuses on specific tasks and milestones completed. | Details completed tasks to show alignment with the project schedule. |
How FineReport Enhances Project Status Reporting
FineReport simplifies the creation of project status reports with its drag-and-drop interface. You can integrate data from multiple sources, ensuring accuracy and consistency. Its advanced visualization tools transform complex data into clear, interactive dashboards. These features allow you to present project health metrics effectively, making it easier for stakeholders to grasp critical insights. FineReport also automates report generation, saving time and reducing errors.
You can try it out in the demo model below:
Project Progress Report
Tracking Milestones with Project Progress Reports
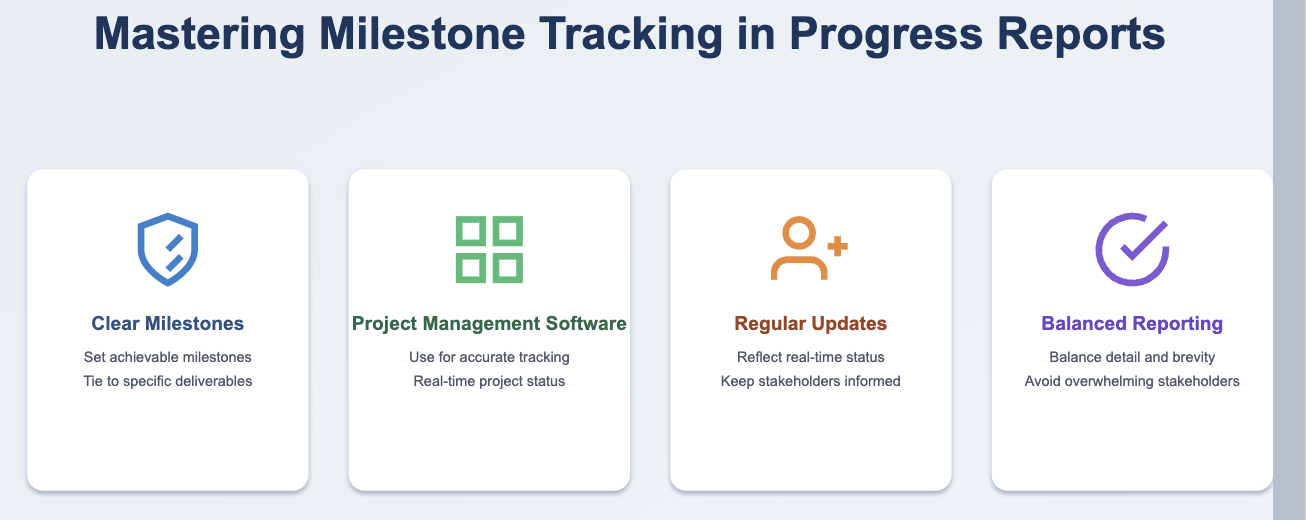
A project progress report focuses on tracking milestones and completed tasks. It ensures that your project aligns with its schedule and budget baselines. Effective progress reporting involves setting clear milestones, using tools for accurate tracking, and regularly updating reports with real-time data.
Here are best practices for tracking milestones in progress reports:
- Set clear and achievable milestones tied to specific deliverables.
- Use project management software for accurate tracking.
- Regularly update reports to reflect real-time project status.
- Balance detail and brevity to avoid overwhelming stakeholders.
- Adjust milestones as project conditions evolve.
Using FineBI for Real-Time Progress Tracking
FineBI excels in real-time progress tracking. Its self-service analytics empower you to explore data independently, reducing reliance on IT teams. With FineBI, you can create dynamic dashboards that update automatically as project data changes. This ensures that your progress reports always reflect the latest information. FineBI's intuitive interface and robust visualization capabilities make it easy to track milestones and communicate progress effectively.
Project Budget Report
Monitoring Financial Health with Budget Reports
A project budget report helps you monitor your project's financial health. It includes components like direct costs, indirect costs, fixed costs, variable costs, contingency reserves, and management reserves. These elements provide a detailed view of your project's expenses, enabling you to allocate resources efficiently and address financial risks proactively.
| Component | Description |
|---|---|
| Direct Costs | Expenses directly tied to the project’s deliverables and activities, such as labor, materials, and equipment. |
| Indirect Costs | Expenses that support the project but cannot be directly attributed to specific activities, like administrative overhead and utilities. |
| Fixed Costs | Costs that remain constant throughout the project, regardless of activity level, such as salaries and rent. |
| Variable Costs | Costs that vary based on the project’s activity level, like materials and labor. |
| Contingency Reserves | Funds set aside to address unexpected challenges, acting as a buffer against financial impacts. |
| Management Reserves | Additional budget allocations kept by the project manager for unforeseen changes affecting project scope or objectives. |
How FineReport Simplifies Budget Reporting
FineReport streamlines budget reporting by integrating data from various sources into a unified platform. Its automated data aggregation and validation features ensure accuracy, while its visualization tools make financial data accessible to all stakeholders. You can create detailed budget reports that highlight cost variances and track financial performance in real time. FineReport's ability to handle large datasets and generate reports quickly makes it an invaluable tool for monitoring project budgets.
Risk Management Report
Identifying and Mitigating Risks with Risk Reports
A risk report plays a crucial role in identifying and mitigating potential threats to your project. It provides a structured approach to risk assessment, helping you anticipate challenges and develop strategies to address them. Common project risks include scope creep, performance issues, and communication breakdowns. To mitigate these, you can set a clear project scope, conduct regular check-ins, and train your team on necessary technologies.
Successful risk management strategies often rely on risk reports. For example:
| Strategy Type | Description |
|---|---|
| Risk Acceptance | Accepting risks that are within acceptable tolerance levels. |
| Risk Transfer | Transferring risks to third parties or insurance companies. |
| Risk Avoidance | Choosing not to engage in activities that incur risk. |
| Risk Mitigation | Implementing plans to reduce or limit risks to acceptable levels. |
FineBI enhances your ability to create actionable risk reports. Its real-time analytics and dynamic dashboards allow you to monitor risks continuously. You can identify trends, assess solutions, and take proactive measures to ensure project success.
Leveraging FineBI for Proactive Risk Management
FineBI empowers you to stay ahead of risks by providing advanced visualization and self-service analytics. Its intuitive interface simplifies risk assessment, enabling you to identify and address issues before they escalate. For instance, you can use FineBI to track operational risks or technology challenges in real time. This proactive approach ensures your project remains on track, even in the face of uncertainties.

Resource Allocation Report
Optimizing Resources with Allocation Reports
Resource allocation reports help you optimize the use of your team and tools. These reports track key metrics like resource availability, cost, and workload balance. For example:
| Metric | Description |
|---|---|
| Billable Utilization | Measures the percentage of time spent on billable tasks relative to total available hours. |
| Resource Cost Variance | Compares actual resource costs against planned costs to identify inefficiencies. |
| Resource Workload Balance | Analyzes how evenly resources are distributed across projects to prevent burnout and delays. |
Challenges like resource overallocation or underutilization can hinder your project. FineReport addresses these issues by integrating data from multiple sources, ensuring accurate and efficient resource planning. Its automated reporting features save time and reduce errors, allowing you to focus on strategic decisions.
How FineReport Supports Resource Planning
FineReport simplifies resource planning with its drag-and-drop interface and robust data integration capabilities. You can create detailed allocation reports that highlight inefficiencies and suggest improvements. Its visualization tools make it easy to communicate resource plans to stakeholders, ensuring alignment and transparency.

Issue Tracking Report
Resolving Problems with Issue Tracking Reports
Issue tracking reports document and manage problems that arise during a project. These reports cover software bugs, quality assurance defects, and customer support inquiries. By resolving issues promptly, you can maintain project schedules and improve outcomes.
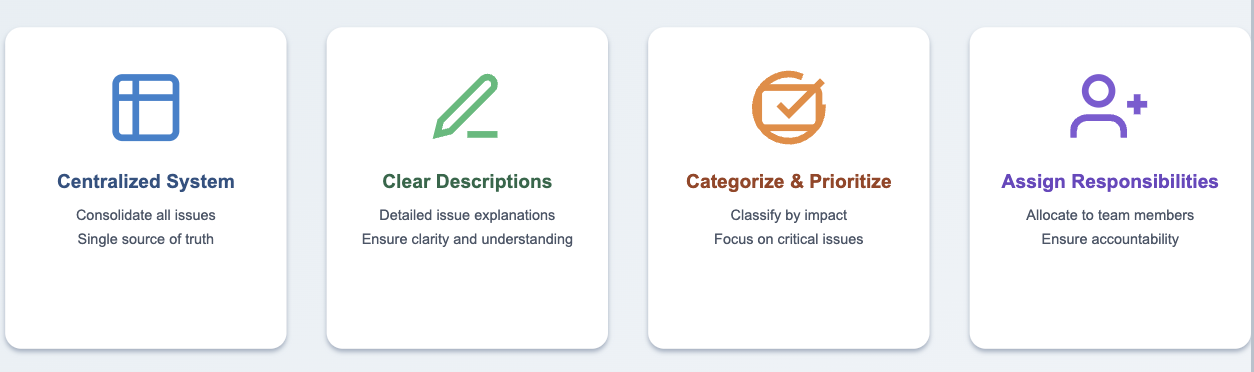
Best practices for creating effective issue tracking reports include:
- Use a centralized system to consolidate all issues.
- Provide clear descriptions for each issue.
- Categorize and prioritize issues based on their impact.
- Assign responsibilities to specific team members.
- Regularly update and communicate progress.
FineBI’s Role in Streamlining Issue Management
FineBI streamlines issue tracking by offering real-time updates and collaborative dashboards. Its automation features reduce repetitive tasks, while its data analysis tools help you identify recurring problems. With FineBI, you can ensure timely resolution and maintain high project quality.
Time Tracking Report
Managing Deadlines with Time Tracking Reports
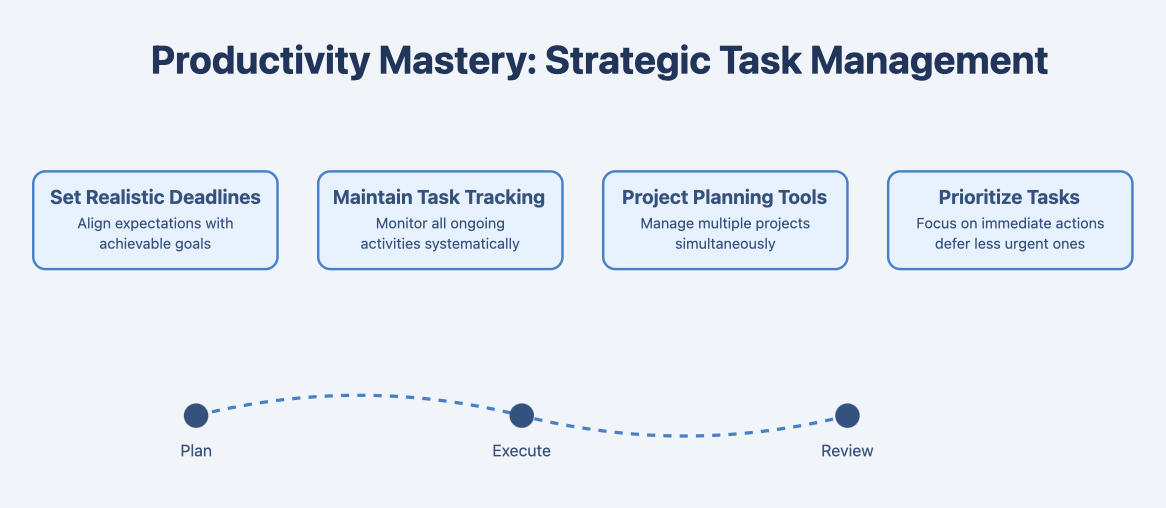
Time tracking reports are essential for managing deadlines effectively. They provide a clear overview of task durations, helping you monitor progress and ensure timely completion. To manage deadlines efficiently, you can adopt several strategies:
- Set realistic deadlines to align expectations with achievable goals.
- Maintain a task tracking system to monitor all ongoing activities.
- Use project planning tools to manage multiple projects simultaneously.
- Prioritize tasks to focus on immediate actions while deferring less urgent ones.
- Schedule tasks using techniques like time blocking or the Pomodoro Technique to enhance focus and productivity.
Effective communication also plays a critical role. By coordinating with your team, you can assign tasks appropriately and ensure everyone prioritizes their workload to meet deadlines.
How FineReport Improves Time Management
FineReport simplifies time tracking by integrating data from multiple sources into a unified platform. Its automated scheduling features allow you to monitor task timelines and identify delays in real time. The drag-and-drop interface makes it easy to create dynamic time tracking reports, while its visualization tools transform raw data into actionable insights. For example, you can use Gantt charts to visualize task dependencies and deadlines. FineReport’s ability to automate repetitive tasks ensures you spend less time on administrative work and more on achieving project goals.
Stakeholder Report
Tailoring Reports for Stakeholder Communication
Stakeholder reports are vital for maintaining transparency and trust. These reports address the specific needs of different stakeholder groups, ensuring effective communication. Key components of a stakeholder report include:
| Key Component | Description |
|---|---|
| Identify Stakeholders | Determine who influences or is affected by the project. |
| Set Communication Objectives | Define clear goals for the report to maintain focus. |
| Choose Communication Methods | Select channels that stakeholders can easily access. |
| Create Communication Plan | Organize content, timing, and feedback mechanisms. |
| Execute and Monitor Plan | Implement the plan and adjust based on feedback. |
Tailoring reports to each stakeholder group ensures relevance. For instance, project managers may need detailed variance analysis, while directors prefer executive summaries. Understanding these needs helps you build trust and improve collaboration.
FineBI’s Customization Features for Stakeholder Reports
FineBI excels in creating customized stakeholder reports. Its self-service analytics enable you to tailor content for different audiences without relying on IT teams. You can use FineBI to generate real-time dashboards that highlight key performance metrics for directors or detailed progress updates for project managers. Its role-based access control ensures stakeholders only see data relevant to their responsibilities, enhancing security and clarity. FineBI’s intuitive interface and advanced visualization options make it easier to communicate complex information effectively.
Quality Assurance Report
Ensuring Deliverables Meet Standards
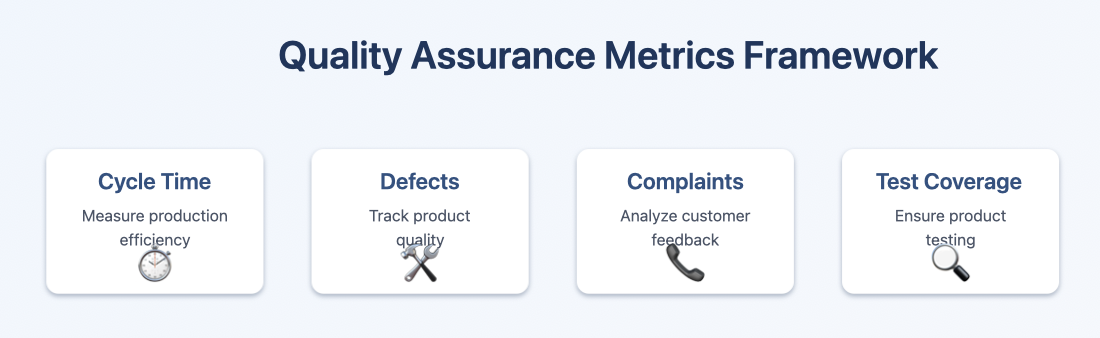
Quality assurance reports ensure your project deliverables meet predefined standards. These reports track key metrics like defects, customer complaints, and audit results to identify improvement areas. Common quality assurance metrics include:
- Manufacturing Cycle Time
- Defects and Scrap Rates
- Customer Complaints and Returns
- Test Coverage Percentage
- Maintenance Metrics
Tracking these metrics helps you evaluate performance and set quality goals. However, challenges like resistance to change or tight deadlines can hinder quality assurance efforts. Addressing these challenges requires clear communication, proper resource allocation, and the use of reliable tools.
How FineReport Enhances Quality Assurance Reporting
FineReport streamlines quality assurance reporting by automating data collection and analysis. Its multi-source integration capabilities allow you to consolidate data from various systems, ensuring accuracy. You can use FineReport to create detailed reports that highlight defects, track maintenance schedules, and monitor customer feedback. Its visualization tools, such as Pareto charts and trend analyses, make it easier to identify root causes and implement corrective actions. By leveraging FineReport, you can ensure your deliverables consistently meet quality standards, even under tight deadlines.

Lessons Learned Report
Using Lessons Learned Reports to Improve Future Projects
Lessons learned reports are essential for improving future projects. These reports capture insights from completed projects, helping you identify what worked well and what didn’t. By analyzing these lessons, you can refine your processes and achieve better outcomes in subsequent initiatives.
Key lessons typically captured in these reports include:
- Continuous Improvement: Boost efficiency and reduce waste in future projects.
- Error Reduction: Avoid repeating past mistakes by learning from them.
- Better Risk Management: Recognize previous risks to improve future risk mitigation.
- Enhanced Collaboration: Build a shared knowledge base that strengthens team communication.
- Improved Customer Satisfaction: Deliver higher-quality results, increasing stakeholder trust.
For example, if a project faced delays due to unclear task assignments, documenting this issue allows you to implement better task management strategies next time. Tools like FineReport simplify this process by offering structured templates for lessons learned reports. Its drag-and-drop interface ensures you can organize insights efficiently, while its visualization features make it easier to present findings to stakeholders.

FineBI’s Role in Capturing and Analyzing Lessons Learned
FineBI excels in capturing and analyzing lessons learned. It provides a structured framework that ensures no critical insight gets overlooked. To apply lessons effectively, follow these steps:
- Establish a lessons learned process to standardize how insights are collected.
- Capture lessons throughout the project lifecycle, not just at the end.
- Conduct structured meetings to discuss and document key takeaways.
- Store lessons in a centralized system for easy access.
- Integrate these lessons into future project plans to avoid repeating mistakes.
- Foster a culture of learning by encouraging teams to share experiences.
- Measure the impact of lessons learned to evaluate their effectiveness.
FineBI’s self-service analytics empower you to analyze lessons learned data independently. Its dynamic dashboards allow you to track recurring issues and identify trends across multiple projects. Unlike traditional tools, FineBI integrates seamlessly with various data sources, ensuring you have a comprehensive view of project performance. Its intuitive interface makes it accessible to all team members, fostering a culture of continuous improvement.

By leveraging FineBI and FineReport, you can transform lessons learned into actionable strategies. These tools not only streamline the reporting process but also ensure your team is equipped to tackle future challenges with confidence. Embracing such advanced solutions positions your organization for long-term success in an increasingly competitive landscape.
Best Practices for Effective Project Management Reporting
Tailoring Reports to Your Audience
Tailoring project management reports to your audience ensures that the information you present is relevant and actionable. Different stakeholders have unique needs, and understanding these needs helps you communicate effectively. For example, clients and customers often prefer high-level summaries, while project managers require detailed variance analyses.
| Audience Type | Key Reporting Needs |
|---|---|
| Clients and Customers | Monthly executive summary, overall project status, variance reports with explanations. |
| Directors | Executive summary, key indices for every project, focus on project issues if targets are missed. |
| Vice Presidents | Performance reports for each group, data grouping at the enterprise level. |
| Program Management Office | Reports on program and project performance, comparison of actual costs to budgeted amounts. |
| Project Managers | Summary level information, detailed reports on variances, analysis of issues. |
| Line Supervisors and Managers | Reports on staffing needs, budgeted vs actual labor rates to identify potential budget issues. |
FineBI simplifies this process with its role-based access control and customization features. You can create dashboards tailored to each audience, ensuring that stakeholders only see the data relevant to their responsibilities. This approach not only saves time but also builds trust by delivering precise and meaningful insights.
Ensuring Data Accuracy and Relevance
Accurate and relevant data forms the backbone of effective project management reporting. Inaccurate data can lead to poor decisions, while irrelevant information may overwhelm stakeholders. To ensure accuracy, validate your data sources and use tools that automate data integration. FineReport excels in this area by connecting to multiple data sources and performing real-time validation.
Relevance requires filtering out unnecessary details. For instance, a project manager may need granular task-level data, but a director might only require a summary of key performance indicators. FineBI’s self-service analytics allow you to drill down into data or zoom out for a broader view, ensuring that every report aligns with its intended purpose.
Leveraging Tools like FineReport and FineBI for Automation
Automating project management reporting processes offers numerous benefits. It reduces manual effort, minimizes errors, and ensures timely updates. Tools like FineReport and FineBI excel in automating repetitive tasks, allowing you to focus on strategic decisions.
| Benefit | Description |
|---|---|
| Increased Scalability | Automation software helps manage tasks, allowing teams to focus on growth and expansion. |
| Reduced Human Error | Automation ensures data accuracy and reliability, minimizing mistakes made by individuals. |
| Greater ROI | Increased productivity leads to cost savings and improved revenue generation for the company. |
| Greater Visibility for Stakeholders | Automation provides consistent updates, enhancing stakeholder confidence in project statuses. |
| Improved Employee Morale | Employees can focus on meaningful tasks, boosting morale and job satisfaction. |
FineReport’s automated scheduling and distribution features ensure that reports reach stakeholders on time. FineBI’s dynamic dashboards update in real time, providing greater visibility into project progress. These tools not only enhance efficiency but also foster a culture of data-driven decision-making. By adopting automation, you position your team for long-term success in an increasingly competitive environment.

Incorporating Visualizations for Better Insights
Visualizations transform raw data into meaningful insights. They make complex information easier to understand and help you identify trends, risks, and opportunities quickly. By using the right visual tools, you can enhance clarity, improve decision-making, and boost team collaboration.

Some of the most effective visualizations for project management include:
- Gantt Charts: These charts display timelines and task dependencies. They help you track project schedules and understand how tasks relate to each other.
- Kanban Boards: These boards organize tasks into columns representing different stages. They improve workflow visibility and task management.
- Project Dashboards: Dashboards provide an overview of project status and key metrics. They allow you to monitor progress, prioritize tasks, and manage resources efficiently.
| Visualization Type | Description | Benefits |
|---|---|---|
| Gantt Charts | Visualize timelines and task dependencies. | Helps in tracking project timelines and understanding task relationships. |
| Kanban Boards | Organize tasks visually in columns representing different stages. | Enhances task management and workflow visibility. |
| Project Dashboards | Provide an overview of project status and metrics. | Facilitates tracking progress, prioritizing tasks, and managing resources effectively. |
Using these tools ensures visibility, clarity, and transparency around your project’s scope. They save time by making essential details accessible and help you understand progress, roadblocks, and risks. This leads to increased productivity and better collaboration.
Fanruan’s tools, such as FineReport and FineBI, excel in creating these visualizations. FineReport offers over 70 chart styles, including Gantt charts and interactive dashboards. Its drag-and-drop interface simplifies the process, allowing you to create professional visuals without technical expertise. FineBI enhances this further with self-service analytics, enabling you to explore data independently and generate real-time dashboards. These features make FineReport and FineBI stand out from competitors by combining ease of use with advanced functionality.
As project management evolves, visualizations will play an even greater role. Tools like FineReport and FineBI are already leading this trend, offering innovative solutions that adapt to your needs. By embracing these technologies, you can stay ahead and ensure your projects succeed in an increasingly data-driven world.
You can try it out in the demo model below:
Project management reporting remains a cornerstone of successful project execution. It ensures transparency, enhances decision-making, and keeps your team aligned with project goals. Tools like FineReport and FineBI simplify this process by automating data integration, offering real-time insights, and delivering visually engaging reports. These features set them apart from traditional tools, which often lack flexibility and ease of use.
Adopting advanced tools can present challenges, such as resistance to change or integration issues. FineReport and FineBI address these with user-friendly interfaces, seamless system compatibility, and customizable solutions. By embracing these tools and following best practices, you can overcome barriers, streamline workflows, and future-proof your project management strategies.
Click the banner below to also experience FineReport for free and empower your enterprise to convert data into productivity!
Continue Reading About Data Analysis
Why Care About Data Platforms? Find Out Here!
Understanding Descriptive Analytics: What It Is and How It Works
Step-by-Step Guide to Setting Up a Data Analytics Framework
Write a Killer Visual Analysis Essay in 2025!


FAQ

The Author
Lewis
Senior Data Analyst at FanRuan
Related Articles

What Is Business Management? A Real-World Guide to Strategy, Operations, Finance, and People
$1 is the discipline of turning goals into results. It connects strategy with execution, money with decisions, and people with performance. Whether a company has 5 employees or 50,000, strong management is what keeps pri
Lewis Chou
Jun 24, 2026

What Recruiters Look for in a Data Analysis Portfolio: 10 Criteria to Score Yours Fast
A $1 is not judged like a school assignment. It is judged like a hiring shortcut. Recruiters, hiring managers, and analytics leads use it to answer one question fast: Can this person solve business problems with data in
Lewis Chou
May 29, 2026

What Is Data Analytics Consulting? Beginner’s Guide to Services, Deliverables, and Business Value
$1 helps organizations turn raw data into decisions they can trust. For many business leaders, the challenge is not a lack of data. It is a lack of clarity. Reports conflict, teams track different KPIs, dashboards are un
Lewis Chou
Jun 03, 2026