You can use a nepse alpha chart to see real-time market trends and spot patterns as they happen. This tool gives you an edge by helping you act quickly and make informed choices. When you combine its features with data-driven platforms like FineBI from FanRuan, you unlock deeper insights. Smart traders use these tools to analyze data faster and respond with confidence.
A nepse alpha chart is a digital tool that shows you real-time price movements and trading patterns in the Nepal Stock Exchange. You can use it to track stocks, indices, and other financial instruments. The chart displays data visually, making it easier for you to spot trends and make quick decisions. You can choose different types of charts, such as line, bar, or candlestick, depending on your preference. Each chart type gives you a unique view of the market.
You gain a significant advantage when you use a nepse alpha chart. It helps you analyze market behavior and identify opportunities as they appear. You can monitor price changes, volume, and technical indicators all in one place. This information supports smarter trading decisions. You do not need to rely on guesswork because the chart provides clear, visual data.
Tip: Start by accessing the Nepse Alpha website. Log in to your account. Select the "Charts" section from the main menu. Choose the stock or index you want to analyze. Adjust the timeframe and chart type to match your strategy. Add indicators or drawing tools as needed.
You can make your analysis even more powerful by integrating the chart with a business intelligence tool like FineBI from FanRuan. FineBI lets you connect multiple data sources, clean your data, and create custom dashboards. When you combine FineBI with your nepse alpha chart, you can prepare your data more efficiently and uncover deeper insights. This approach saves you time and helps you make decisions based on accurate, up-to-date information.
The nepse alpha chart gives you a powerful set of tools to analyze the market. You can use different features to spot trends, make predictions, and improve your trading strategy. Here is a quick overview of the main features you will find:
| Feature Category | Details |
|---|---|
| Timeframes | Multiple timeframes including intraday, short-term, long-term; multi-timeframe scans; custom timeframes |
| Indicators | Over 65 technical indicators like RSI, MACD, Bollinger Bands, and more |
| Drawing Tools | More than 35 drawing tools such as trendlines, Fibonacci retracements, and shapes |
| Additional Features | Auto-trendlines, supply/demand zones, 6-window chart layouts, 190+ technical & fundamental scans, real-time data (1-min and 5-min) |
You can choose from many timeframes on the nepse alpha chart. Switch between intraday, daily, weekly, or even custom timeframes to match your trading style. For example, if you want to catch quick price movements, use the 1-minute or 5-minute charts. If you prefer long-term trends, select daily or weekly views. This flexibility helps you see both the big picture and the small details.
Indicators give you extra information about price action. The nepse alpha chart offers over 65 technical indicators. You can add tools like Moving Averages, RSI, MACD, and Bollinger Bands. These indicators help you spot overbought or oversold conditions, trend strength, and possible reversals. For example, you might use the MACD to confirm a trend or the RSI to find entry points.
Tip: Combine multiple indicators to build a stronger trading signal. For deeper analysis, export your chart data to FineBI. FineBI lets you compare indicator signals with historical performance, helping you validate your strategy with real numbers.
Drawing tools let you mark up your charts and highlight important areas. The nepse alpha chart includes more than 35 drawing tools. You can draw trendlines to track price direction, use Fibonacci retracements to find support and resistance, or add shapes to mark breakout zones. Overlays like moving averages or Bollinger Bands appear directly on the price chart, making it easy to see how price interacts with these levels.
You can use these tools to plan your trades visually. For example, draw a trendline to see if a stock is in an uptrend. Mark support and resistance zones to set your entry and exit points. When you combine these drawings with overlays, you get a clear map of the market.
Note: If you want to analyze your drawings across multiple stocks or timeframes, FineBI can help. Import your chart annotations into FineBI to compare patterns and test which setups work best over time.
Auto chart features save you time by detecting patterns automatically. The nepse alpha chart can draw trendlines, highlight supply and demand zones, and scan for technical or fundamental setups. You can set up scans to find stocks that meet your criteria, such as a moving average crossover or a new high. The platform supports over 190 technical and fundamental scans, so you never miss an opportunity.
These scanning tools help you filter the market quickly. For example, you can scan for stocks with strong volume or those breaking out of a range. This lets you focus on the best setups without checking every chart manually.
Pro Tip: Use FineBI to track the results of your scans. Build a dashboard that shows which scanned stocks performed best. This helps you refine your scanning rules and improve your trading results.
The nepse alpha chart, when combined with FineBI, gives you a complete toolkit for smarter trading. You can analyze, visualize, and validate your strategies with confidence.

You can adjust the nepse alpha chart to match your trading style. Start by choosing the chart type that fits your needs. Some traders prefer candlestick charts for detailed price action. Others use line charts for a simple view. You can also set your preferred timeframes. If you trade quickly, select shorter intervals like 1-minute or 5-minute charts. For longer trades, use daily or weekly views.
You can add or remove technical indicators based on your strategy. For example, if you focus on momentum, add the RSI or MACD. If you watch for support and resistance, use moving averages or Bollinger Bands. You can also change the color scheme and layout. This helps you see important information at a glance.
Tip: Try different settings and see which ones help you spot trends faster. Save your favorite setups for easy access later.
Saving templates can make your trading process smoother. When you find a chart setup that works, save it as a template. This lets you apply the same settings to other stocks or timeframes with one click. You do not need to set up your indicators and drawings every time.
FineBI from FanRuan can help you manage your templates and workflows. You can import your chart data into FineBI and create dashboards that track your favorite setups. This saves time and keeps your analysis organized. You can also share templates with your team for better collaboration.

Note: Templates and BI tools like FineBI help you work faster and avoid mistakes. They keep your trading strategy consistent and efficient.
When you use the nepse alpha chart, you might run into some common mistakes. These errors can lead to wrong conclusions or missed opportunities. Here are some pitfalls to watch out for:
Tip: Use a checklist before you start your analysis. This helps you avoid simple mistakes and keeps your process consistent.
You can improve your results by following some proven best practices. These steps help you get the most from your nepse alpha chart and FineBI integration:
Note: When you use both automated and manual methods, you process data faster and gain deeper insights. This combination works best for large datasets and complex trading strategies.
| Practice | Benefit |
|---|---|
| Automation + Review | Higher accuracy, less bias |
| Checklists | Fewer skipped steps |
| Holistic Checks | Detects outliers, errors |
| Secure Storage | Easy reanalysis, saves time |
| Correct Methods | Reliable results |
FineBI gives you the power to turn raw data into clear, interactive dashboards. You can drag and drop charts, tables, and filters onto your dashboard. This lets you see key market trends and trading signals at a glance. You do not need to write code or rely on IT support. The dashboard updates in real time, so you always work with the latest numbers.

You can use filters to focus on specific stocks, timeframes, or indicators. When you select a filter, every chart on your dashboard updates instantly. This helps you spot patterns and compare different data points quickly. You can also link components together. For example, when you click on a stock in one chart, related data appears in another chart. This makes your analysis faster and more intuitive.
Tip: Use dashboard sharing to let your team review your findings. Everyone can see the same data and make decisions together.

FineBI puts you in control of your analysis. You can explore, analyze, and visualize data without waiting for IT help. The self-service dataset tools let you add columns, filter, sort, and aggregate data with just a few clicks. You can focus on analysis instead of spending time preparing data.
FineBI includes powerful built-in functions for calculations and summaries. You can use logical, mathematical, and aggregation tools to dig deeper into your data. The platform offers many chart types, so you can choose the best way to show your results. Multi-dimensional analysis lets you look at your data from different angles.
FineBI’s user-friendly interface helps you make decisions quickly and confidently. You can move from raw data to actionable insights in minutes. This independence lets you react to market changes and trading opportunities without delay.
With FineBI, you become the analyst. You gain the tools to explore, visualize, and share insights—empowering smarter trading every day.
You now know how to use the nepse alpha chart for smarter trading. Start by choosing the right chart type and timeframe. Add indicators and drawing tools to spot trends. Save your favorite setups as templates. Combine your analysis with FineBI to create interactive dashboards and track your results. Keep exploring both platforms to improve your trading skills and make better decisions every day.
Click the banner below to experience FineBI for free and empower your enterprise to convert data into productivity!

작성자
Seongbin
FanRuan에서 재직하는 고급 데이터 분석가
관련 기사
워드클라우드 사이트 비교 2026: 한글 지원·디자인·저장 기능까지 한눈에
$1는 텍스트에서 자주 등장하는 단어를 크게 보여 주는 $1 방식입니다. $1, 발표 자료, 수업 활동, SNS 콘텐츠까지 활용 범위가 넓어지면서 어떤 $1 사이트 를 선택해야 하는지 고민하는 분도 많아졌습니다. 특히 2026년 기준으로는 단순히 “예쁘게 보이는가”보다 한글 처리 품질, 저장 형식, 재편집 편의성 이 훨씬 중요해졌습니다. 영문 중심 서비스는 많지만, 실제 국내 사용자 입장에서
Seongbin
2026년 4월 15일
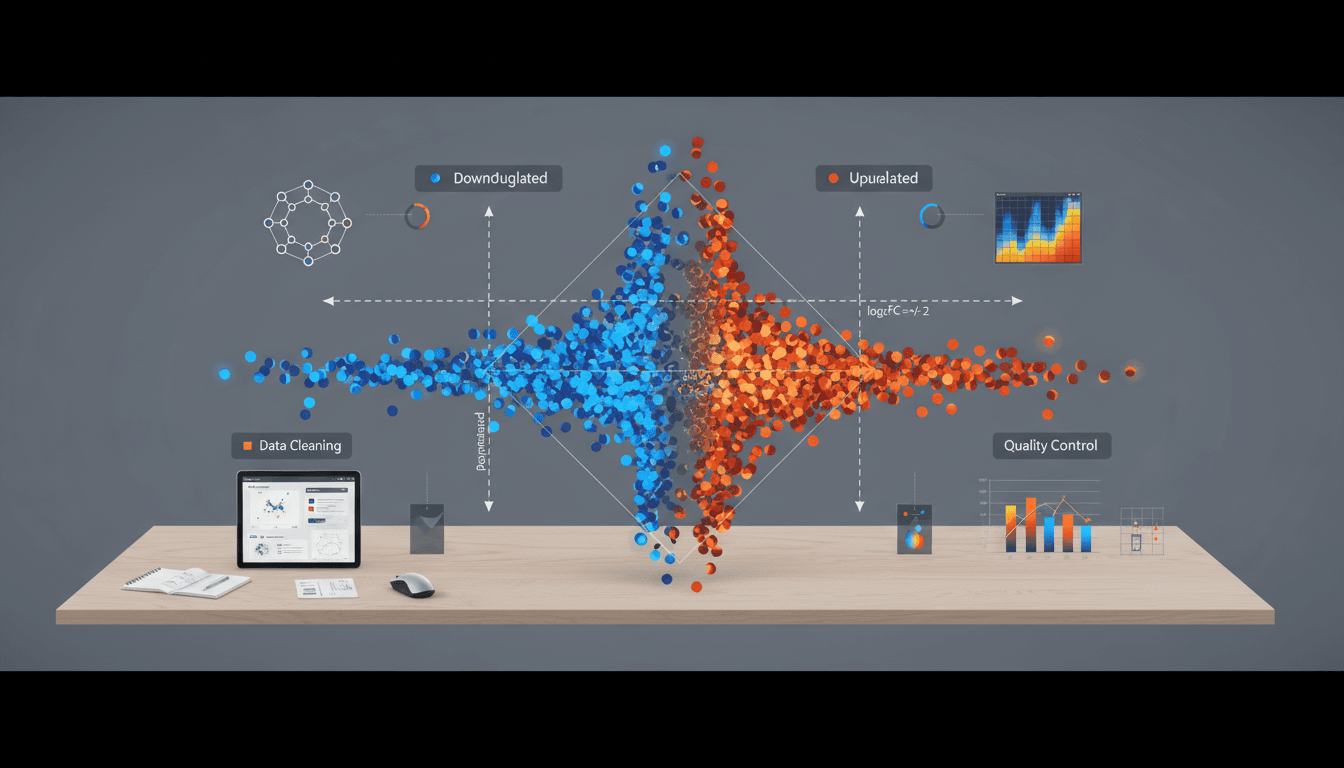
volcano plot 실전 제작 가이드: Excel·R·Python·웹툴 비교로 최적 도구 찾기
차등 발현 분석 결과를 빠르게 훑어보고, 중요한 후보 유전자를 직관적으로 찾고 싶다면 volcano plot 은 거의 가장 먼저 떠올려야 할 $1 방법입니다. 특히 RNA Seq, 마이크로어레이, 단백질체, 대사체처럼 비교 대상이 많고 변수 수가 큰 데이터에서는 변화의 크기와 통계적 유의성을 동시에 보여준다는 점에서 매우 강력합니다. 이 글에서는 volcano plot의 개념, 읽는 법, 해
Seongbin
2026년 4월 14일
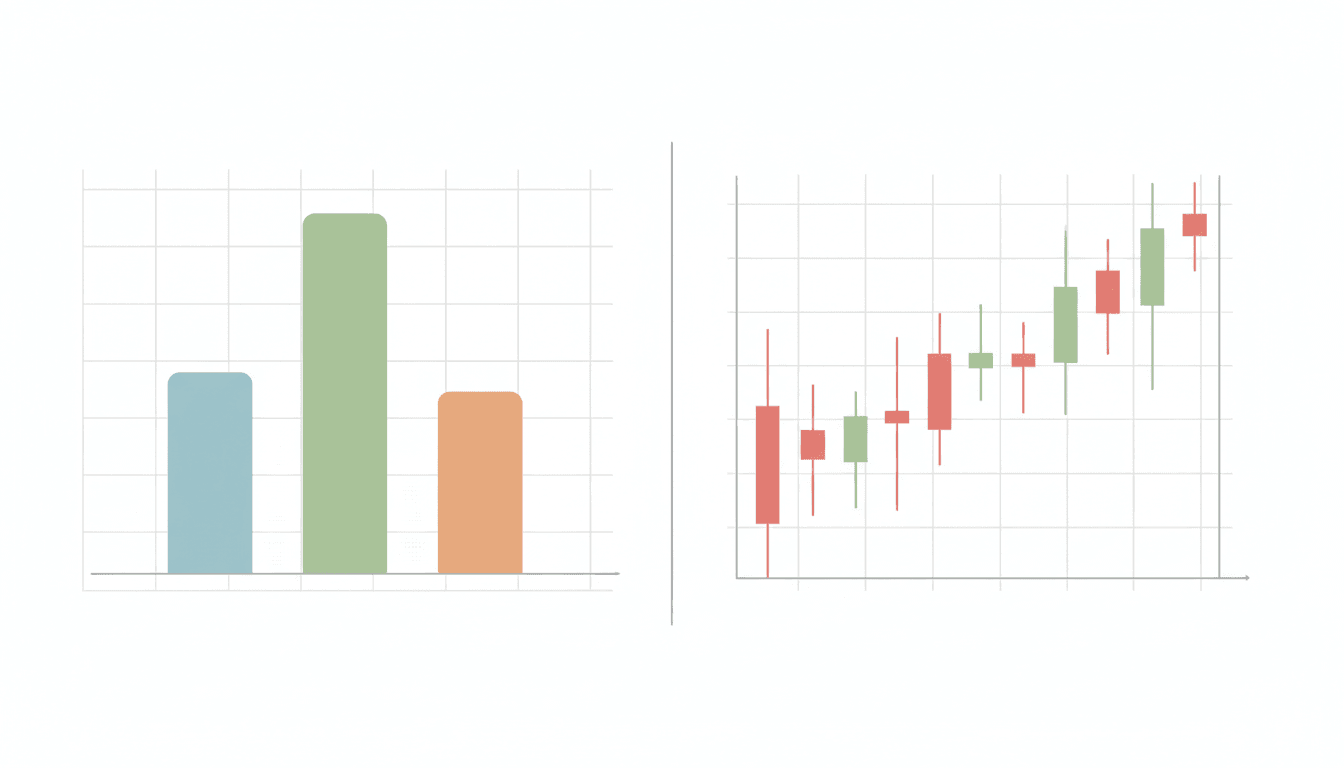
바차트란 무엇인가? 막대그래프와 주식 바차트 차이까지 10분 만에 이해하기
‘ 바차트 ’라는 말을 들으면 많은 사람이 먼저 $1 를 떠올립니다. 실제로 $1에서는 바차트가 곧 $1를 뜻하는 경우가 많습니다. 하지만 주식이나 금융 시장에서는 같은 단어가 전혀 다른 방식의 가격 차트 를 의미하기도 합니다. 바로 하나의 선과 짧은 눈금으로 시가, 고가, 저가, 종가 를 표시하는 금융용 바차트입니다. 초보자가 가장 많이 헷갈리는 지점도 여기입니다. “바차트 = $1 아닌가
Seongbin
2026년 4월 14일


