Choosing the right data visualization company plays a crucial role in your business's success. Effective data visualization consulting services transform raw data into actionable insights, enabling you to make informed decisions swiftly. Visuals help you grasp information quickly, uncovering patterns and trends that drive strategic growth.
By leveraging tools like FineBI and FineVis, you can enhance your decision-making process, ensuring that insights lead to impactful actions. This approach not only aids in data-driven decisions but also empowers you to explore and understand complex data landscapes, ultimately fostering a culture of informed decision-making.
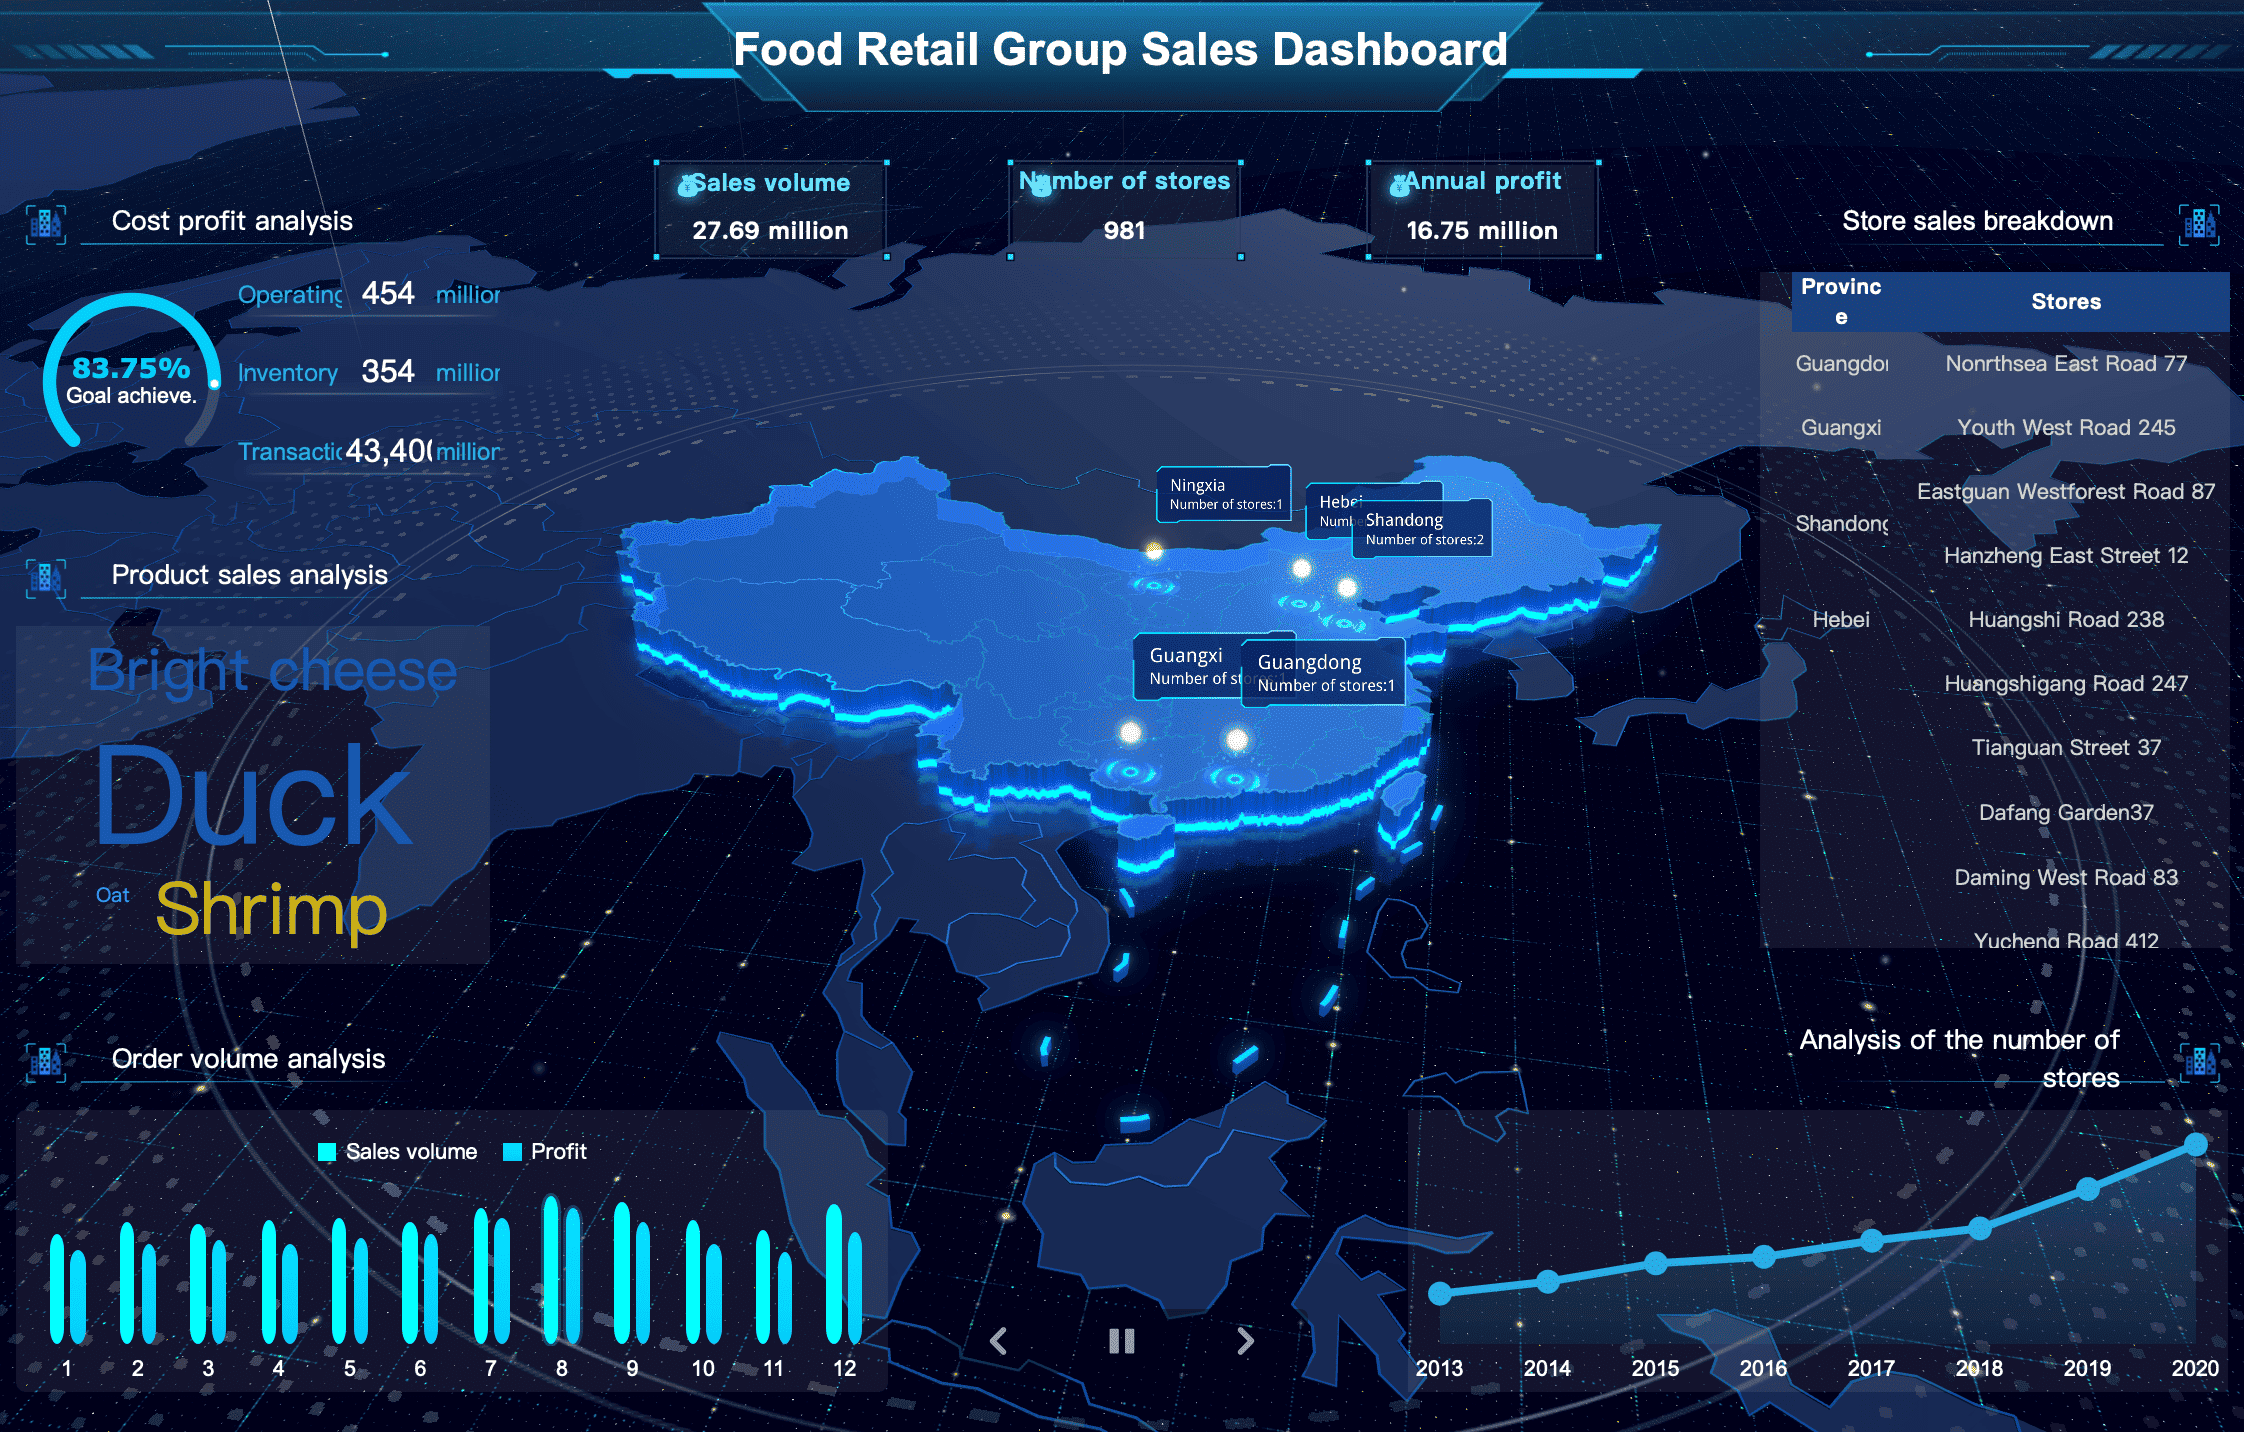
Food Retail Group Sales Dashboard Created By FineVis
Define Your Requirements for Data Visualization Consulting Services
Before you dive into selecting data visualization consulting services, it's crucial to define your requirements. This step ensures that you align the service with your business needs and objectives, ultimately leading to more effective decision-making.
Identify Your Business Goals
Start by identifying your business goals—whether it's improving operational efficiency, enhancing customer experience, or driving sales growth. Clear objectives will guide your choice of data visualization services, ensuring you select the right tools to achieve actionable insights. For example, FineReport, a powerful report generation tool, can help create detailed, actionable visualizations tailored to your business needs. By aligning your goals with the right visual strategies, you can design meaningful visualizations that effectively communicate your data's message and support informed decision-making.
Determine the Scope of the Project
Next, define the scope of your project. Consider the size, complexity, and frequency of the data you need to visualize. Are you working on a one-time analysis, or do you require ongoing support for continuous reporting? Understanding the scope helps you select a service that aligns with your needs. For example, FineReport, FineBI, and FineVis from FanRuan offer flexible solutions for both small-scale projects and large-scale, ongoing data visualization needs. A clear scope also aids in setting realistic timelines and budgets, ensuring the project aligns with your strategic priorities.
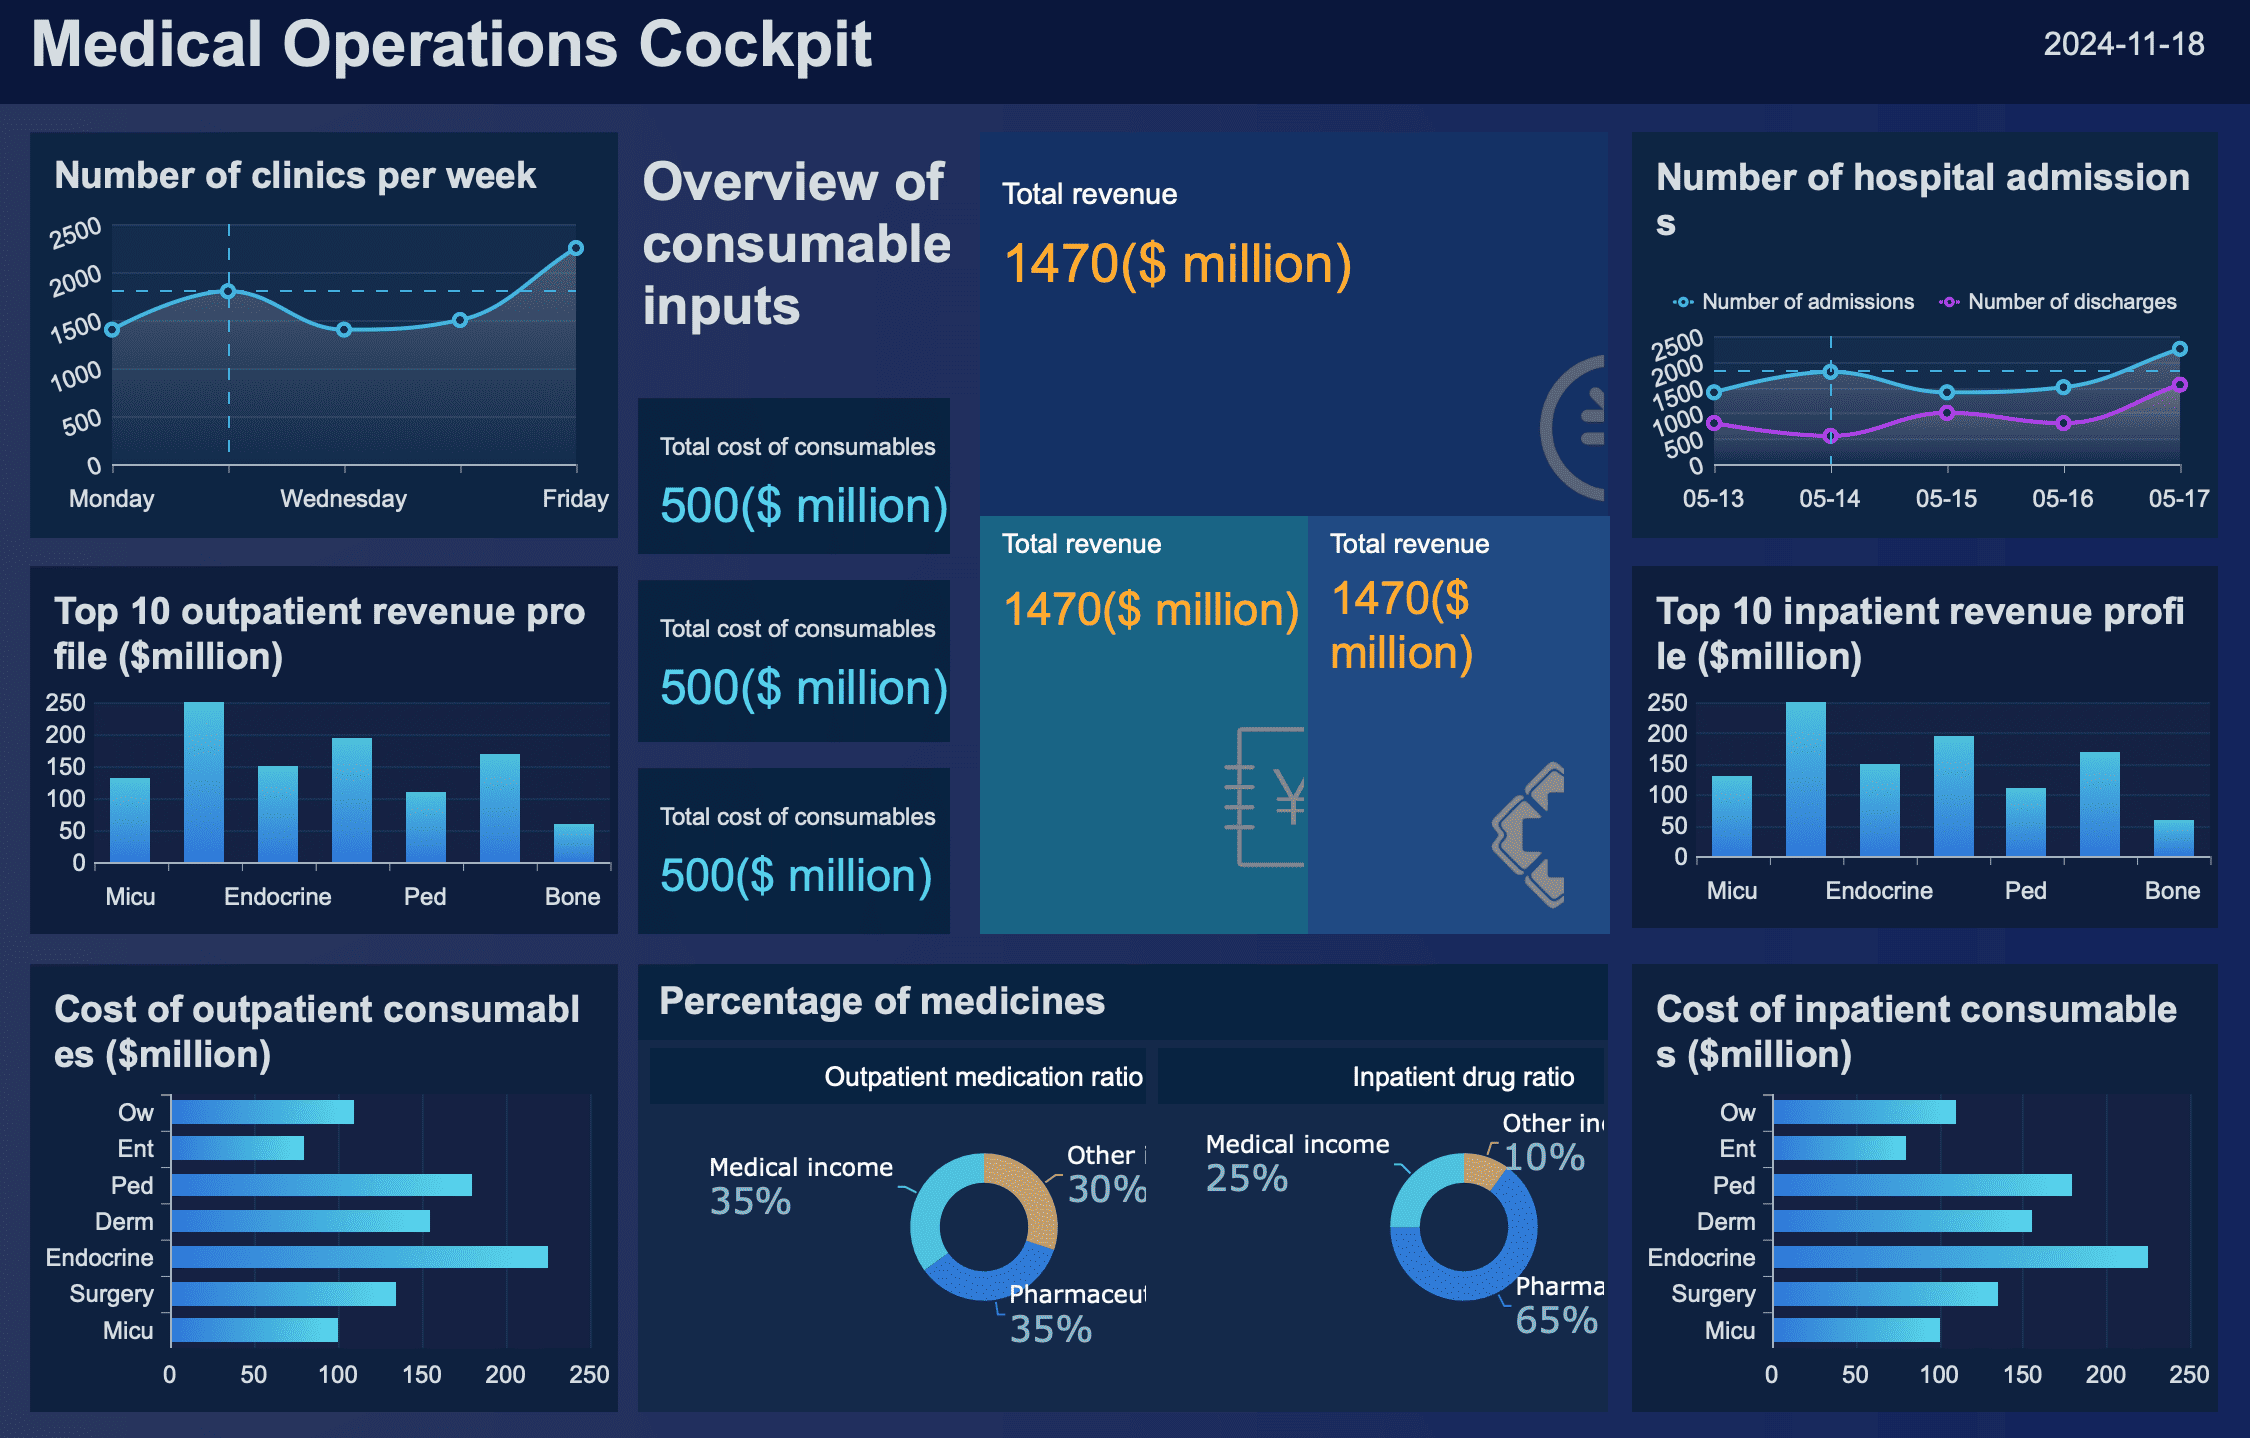
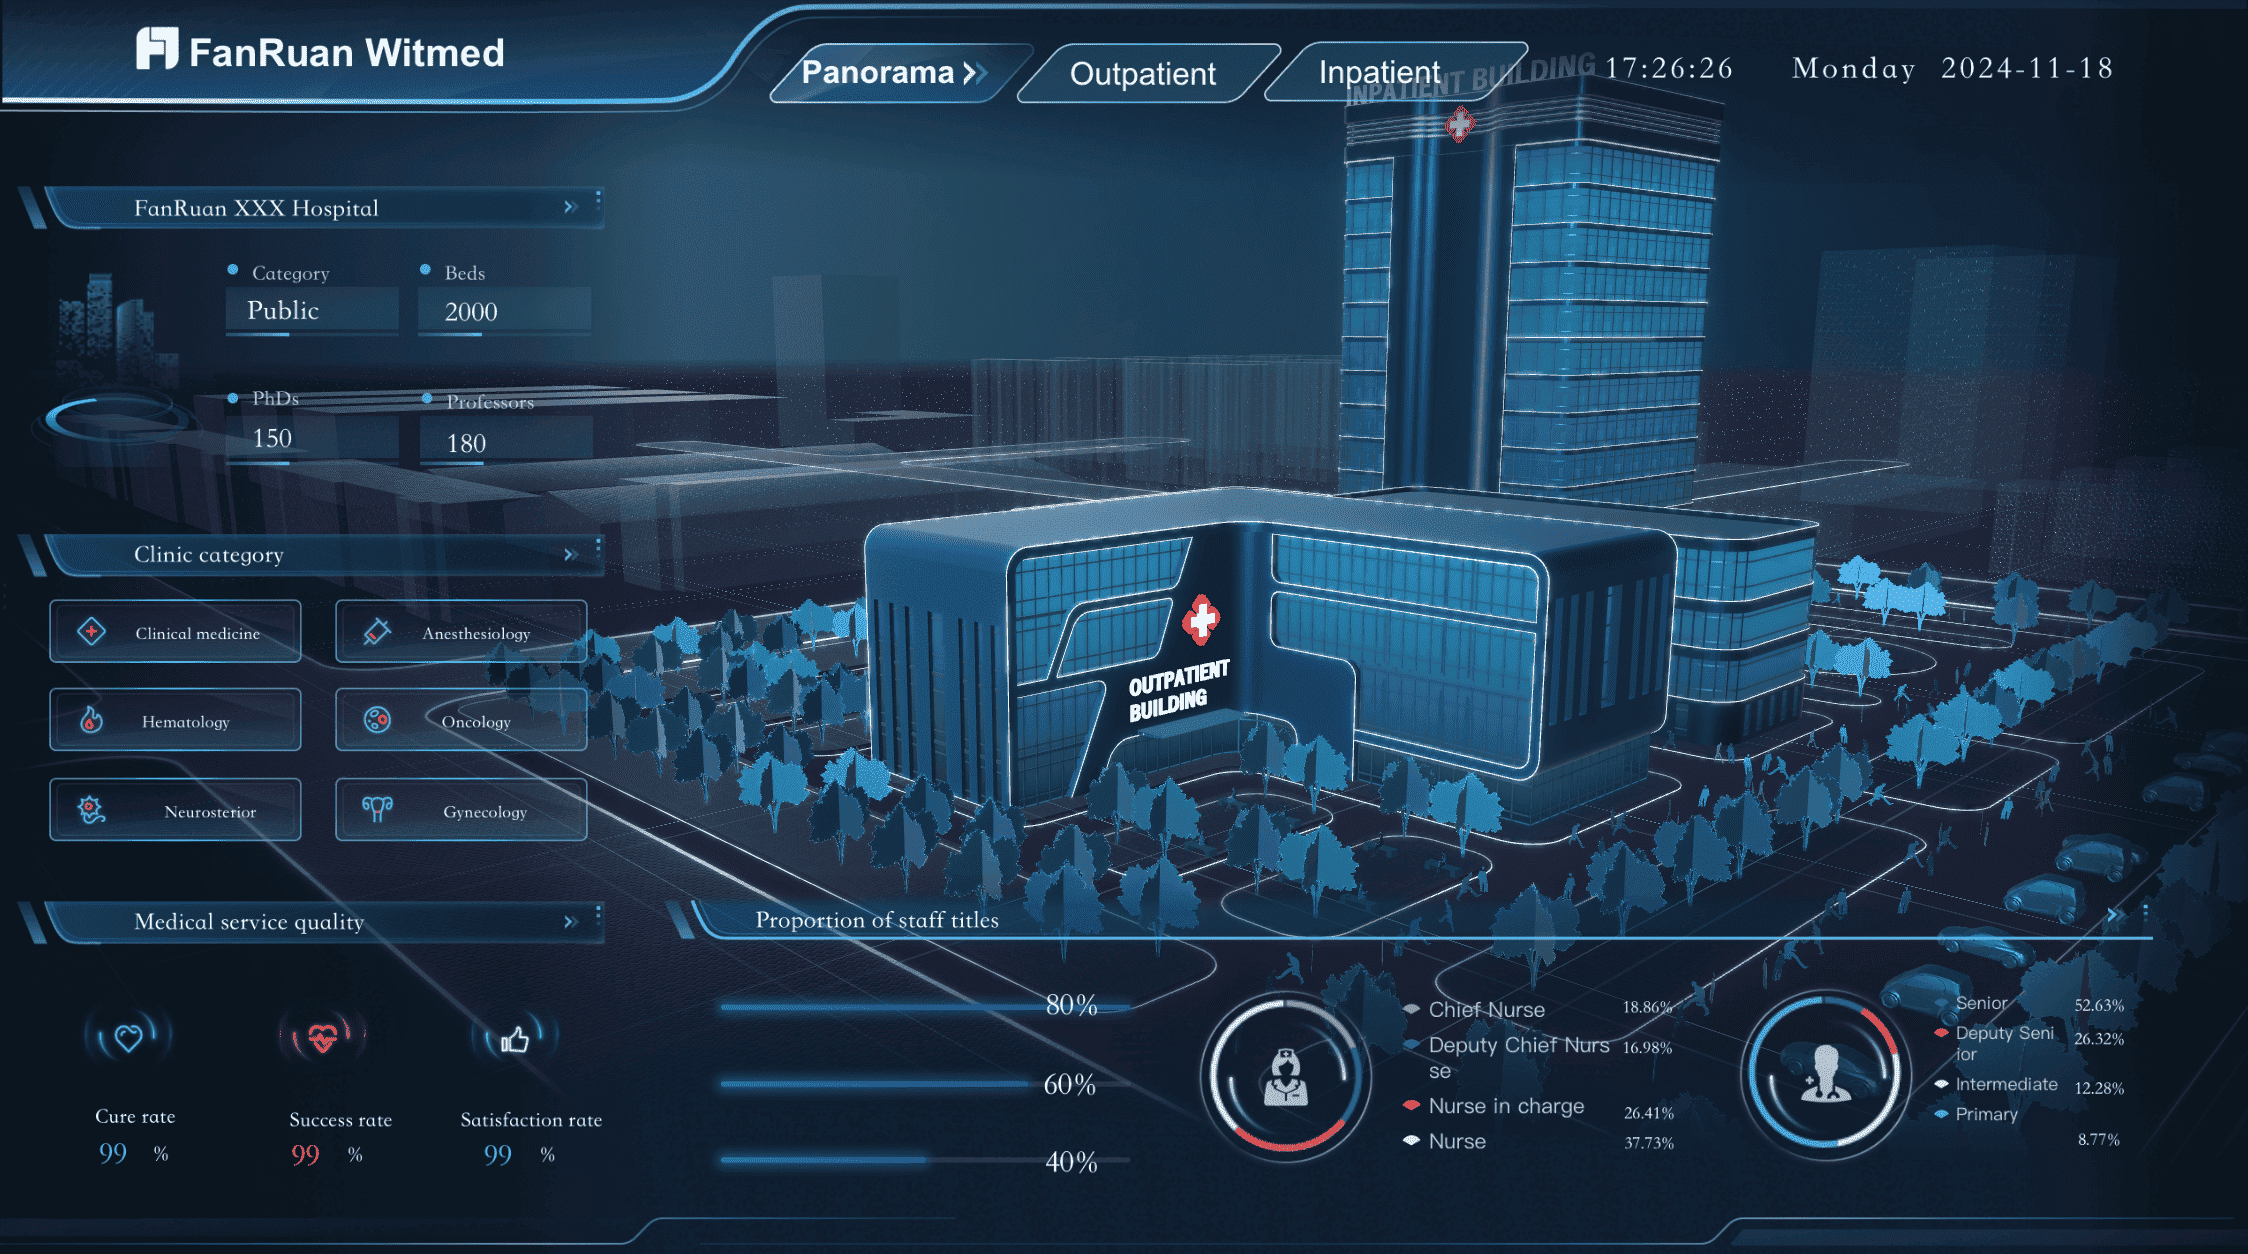
Medical Operations Cockpit Dashboard Created By FineReport
Finally, understand your data needs. What type of data do you have, and how do you plan to use it? Knowing your data sources and the kind of insights you seek will help you select a consulting service that can transform raw data into actionable insights. This understanding is vital for making data-driven decisions that propel your business forward. By defining your data needs, you ensure that the chosen service can tailor its tools and techniques to suit your specific requirements.
By clearly defining your requirements, you set the foundation for selecting the best data visualization consulting services. This clarity not only streamlines the selection process but also enhances your ability to make informed, data-driven decisions.
Evaluate Expertise and Experience for Data Visualization Consulting Services
When selecting data visualization consultants, evaluating their expertise and experience is crucial. This ensures that the team can effectively transform your complex data into actionable insights, enhancing your decision-making process. It’s also important to consider the tools they use. For instance, FanRuan’s FineReport, FineBI, and FineVis provide powerful and flexible platforms for creating customized, interactive data visualizations that cater to a wide range of business needs. Choosing a consultant familiar with these tools can streamline your workflow and boost overall efficiency.
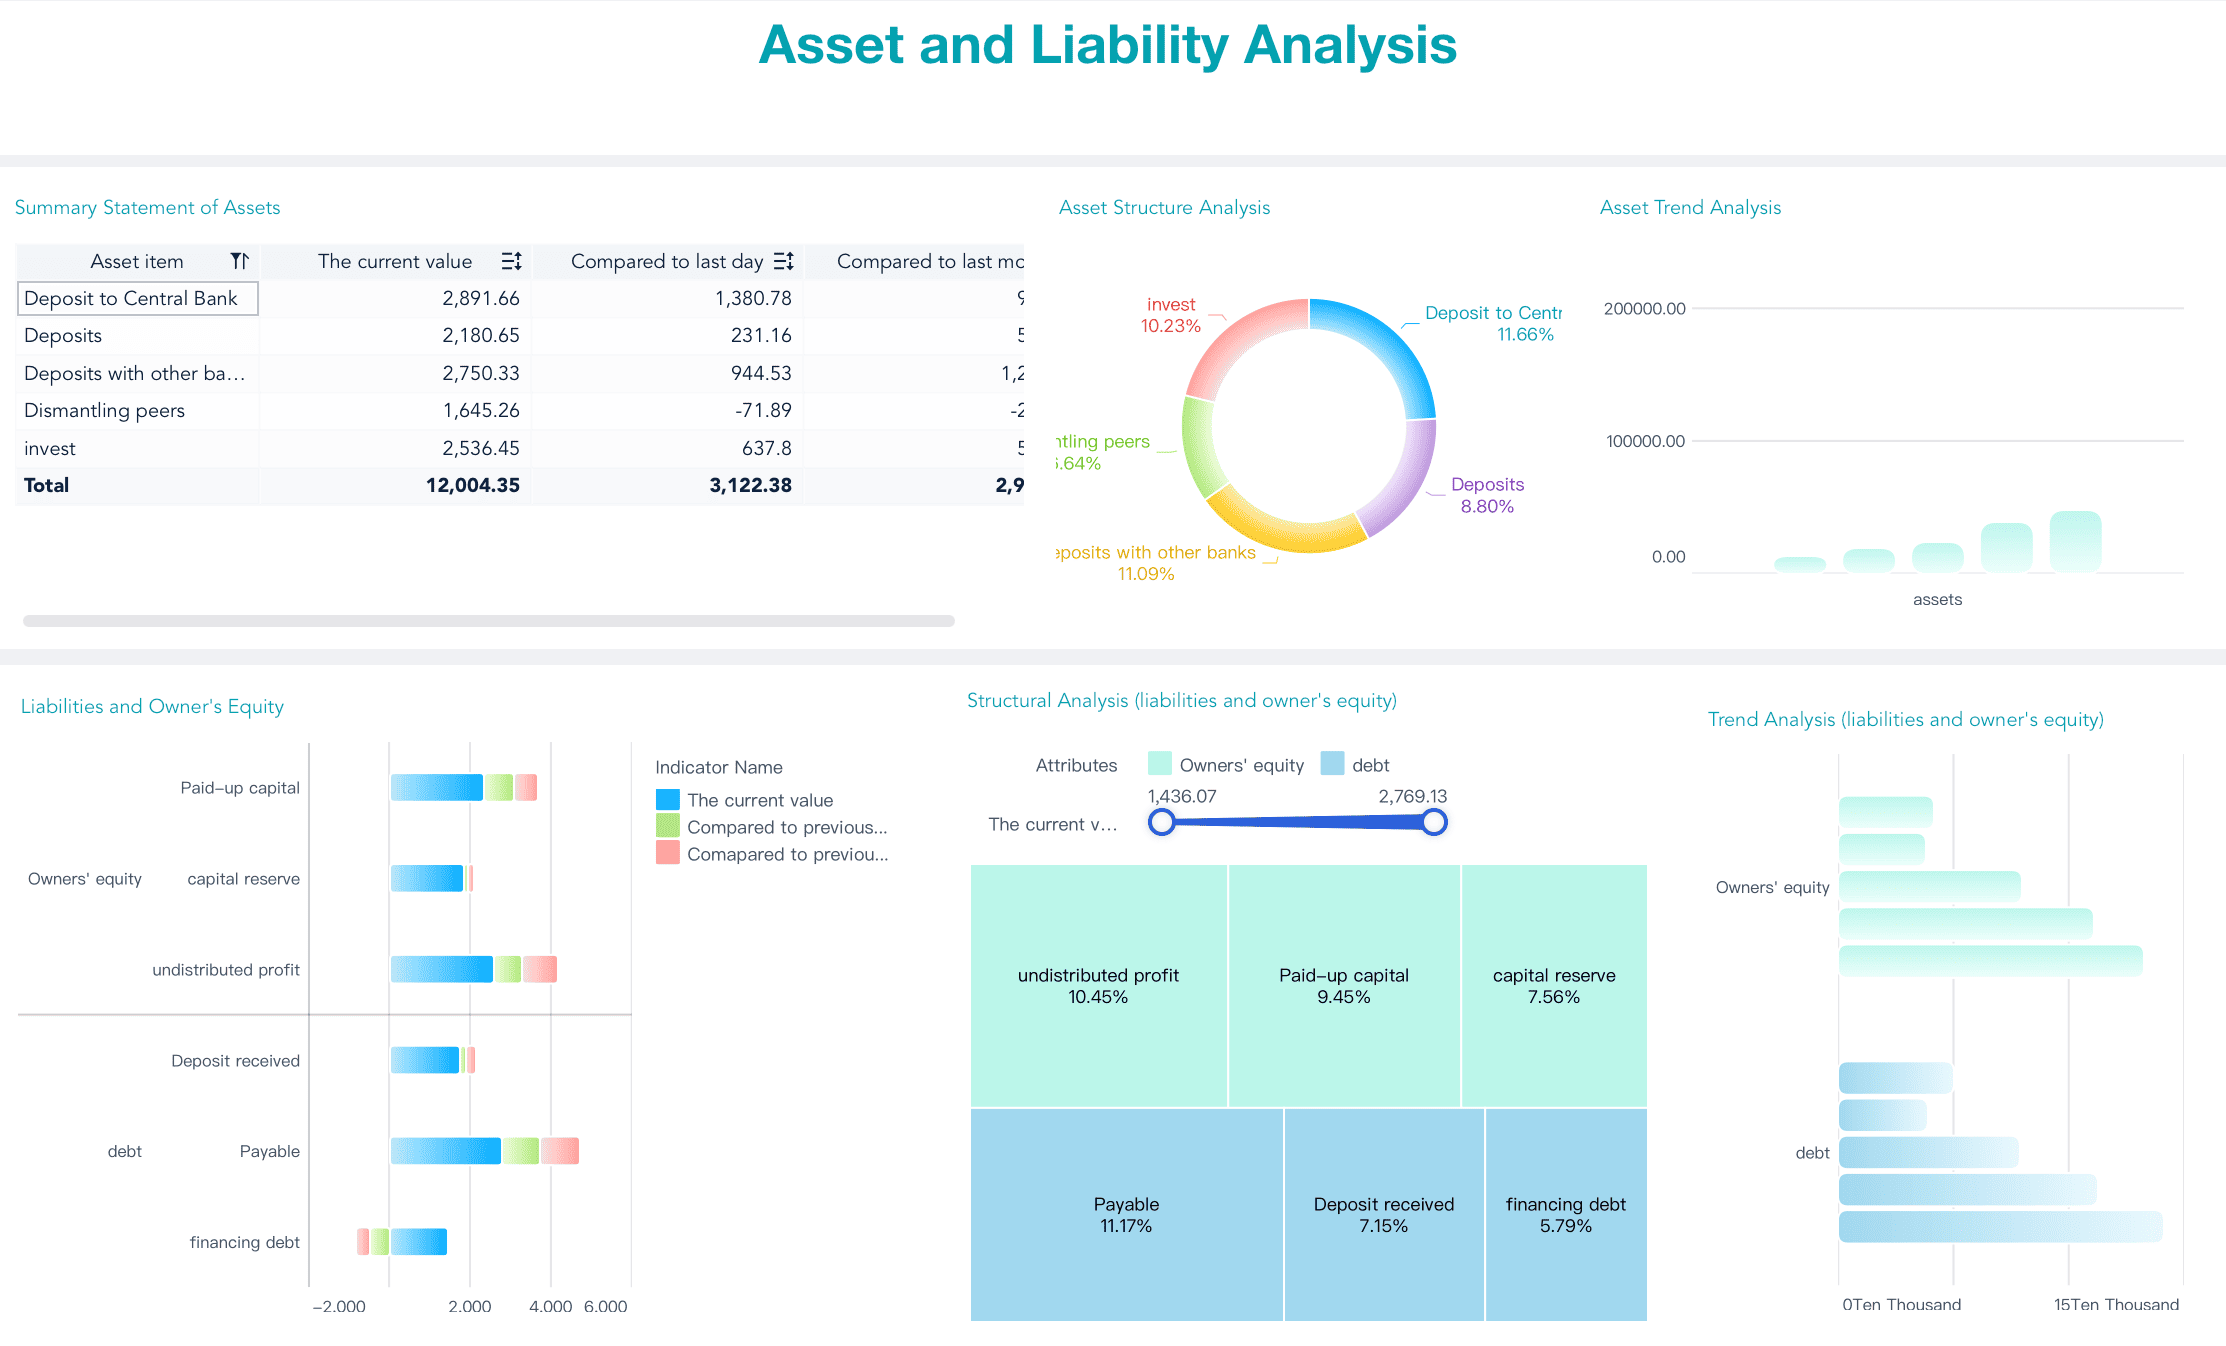
Asset Liability Analysis Dashboard Created By FineBI
Begin by reviewing the qualifications and certifications of potential data visualization consultants. Certifications in tools like Tableau or other visualization software indicate a consultant's proficiency. Tableau Consultant, an expert in data visualization and analytics, emphasizes the importance of a team with deep understanding and relevant certifications. These credentials assure you that the consultants possess the necessary skills to deliver effective solutions.
Assess Experience with Similar Projects
Next, assess the consultants' experience with projects similar to yours. Experienced consultants have likely encountered challenges akin to those you face, equipping them to provide tailored solutions. Data Consultant, an expert in data analysis and consultancy, notes that working with a team familiar with your industry enhances the quality of insights. Their past experiences enable them to design systems that align with your specific needs, facilitating better decision-making.
Check for a Proven Track Record
Finally, check for a proven track record. Request case studies or client testimonials to gauge the success of previous projects. A history of delivering actionable insights and facilitating data-driven decisions indicates reliability. Consultants with a strong track record demonstrate their ability to translate complex data into clear visual formats, crucial for effective decision-making.
By thoroughly evaluating expertise and experience, you ensure that the chosen data visualization consulting services can meet your needs. This careful selection process leads to more informed, data-driven decisions, ultimately driving your business forward.
Assess Industry-Specific Knowledge for Data Visualization Consulting Services
When selecting a data visualization consulting service, assessing their industry-specific knowledge is essential. Consultants familiar with your industry can provide more relevant solutions, addressing your unique challenges. For example, FanRuan’s FineBI and FineReport offer customizable features that cater to different sectors, helping businesses effectively visualize data for industry-specific decision-making.
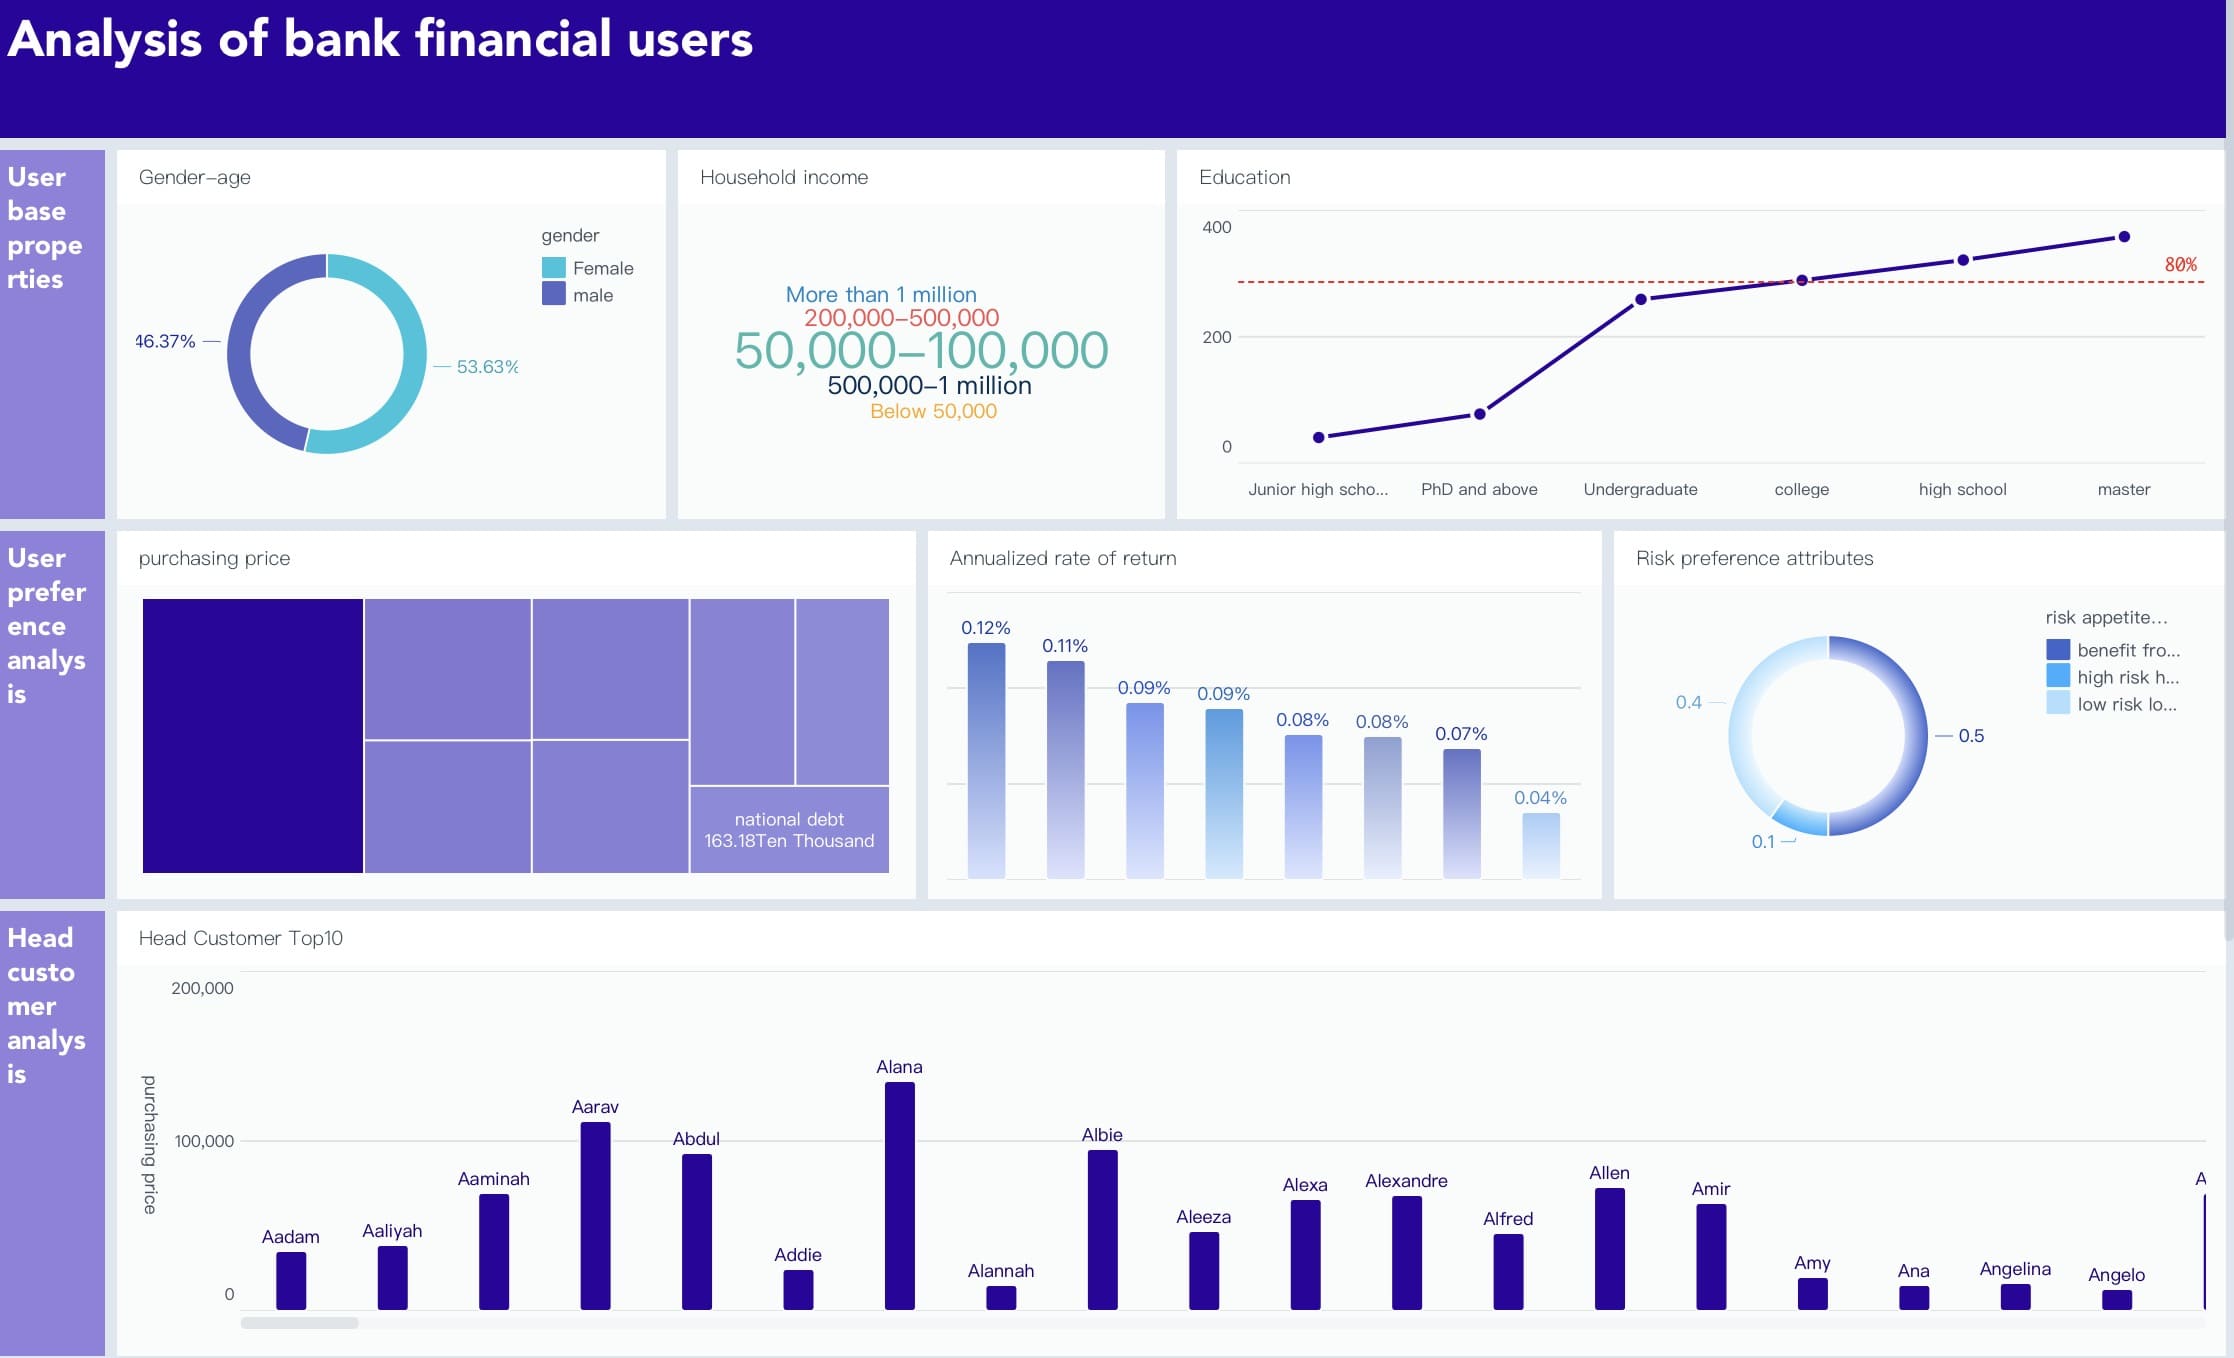
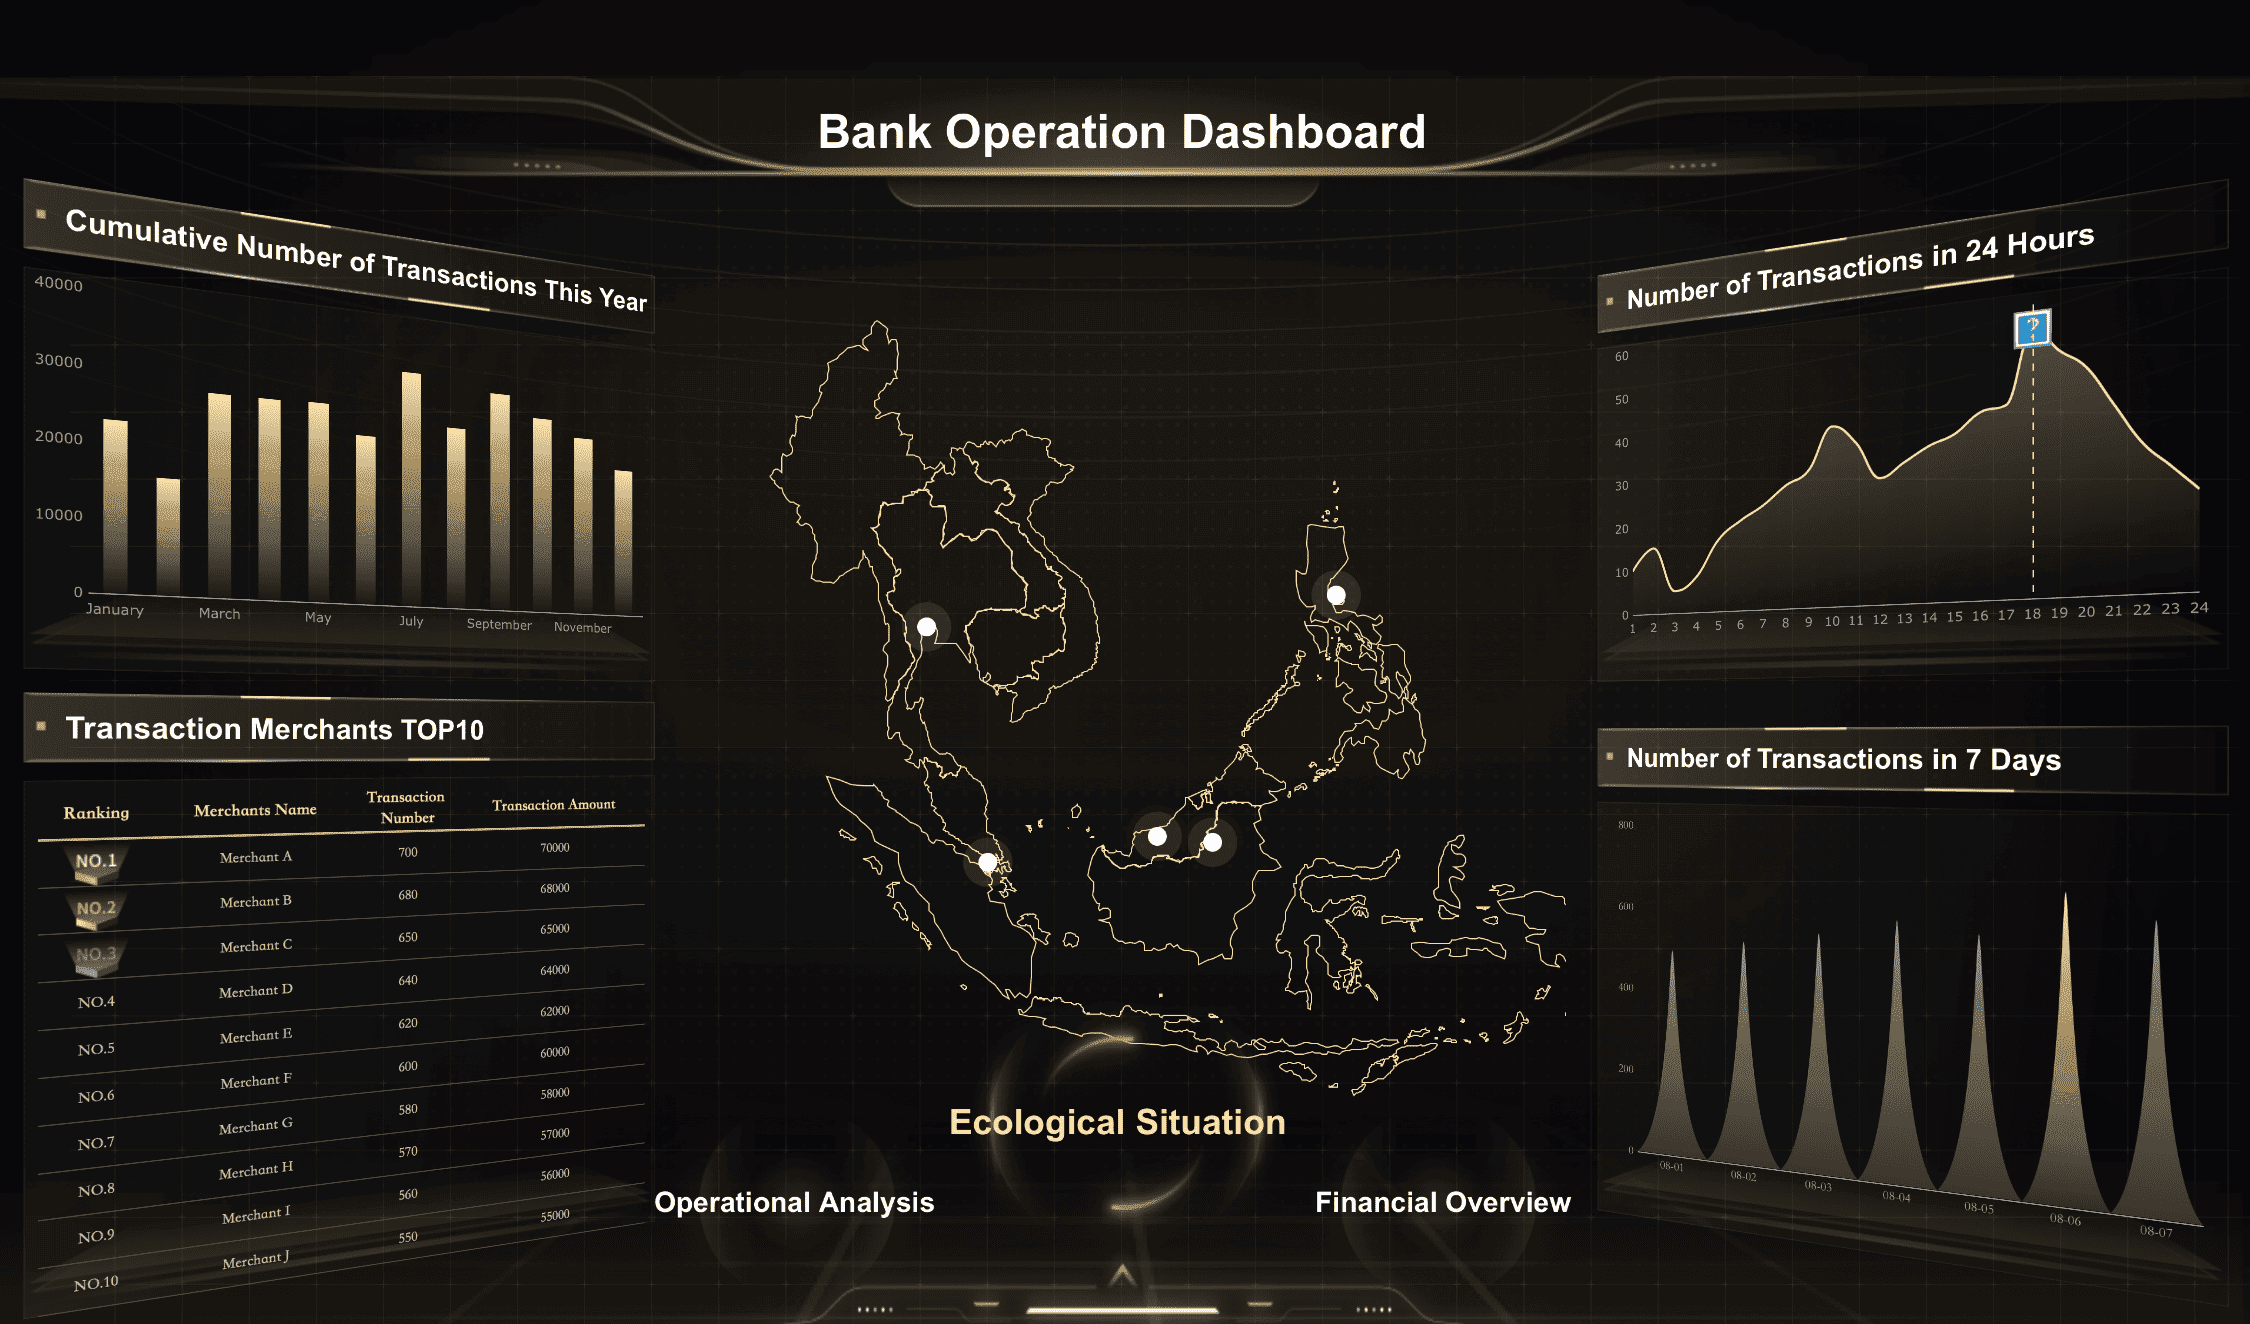
Analysis of Bank Financial Users Dashboard Created By FineBI
Identify Relevant Experience: Seek consultants with experience in your industry. Their familiarity with industry norms and practices allows them to create visualizations that resonate with your audience. For instance, a consultant with a background in healthcare will better understand the nuances of medical data, leading to more effective decision-making.
Evaluate Past Projects: Review the consultant's portfolio for projects similar to yours. This gives you insight into their ability to handle your specific problems. A proven track record in your industry indicates that they can deliver solutions that align with your business goals.
Networking and Learning: Consultants who actively network and learn from industry experts bring valuable insights to your project. Their connections can provide access to the latest trends and technologies, enhancing the quality of their services.
Evaluate Understanding of Industry Challenges
Assess Problem-Solving Skills: Determine if the consultants can address the specific problems your industry faces. Their ability to navigate these challenges is crucial for effective decision-making. A consultant who understands the regulatory environment in finance, for example, can help you visualize data in compliance with industry standards.
Industry-Specific Expertise: Look for consultants who demonstrate industry-specific expertise. This expertise ensures that they can translate complex data into clear, actionable insights. Their knowledge of industry challenges allows them to anticipate potential issues and provide proactive solutions.
Tailored Solutions: Ensure that the consultants offer customizable tools and solutions. This flexibility allows them to adapt their services to your unique data needs, enhancing the effectiveness of their visualizations.
By focusing on industry-specific knowledge, you ensure that the data visualization consulting service you choose can meet your needs. This careful selection process leads to more informed decision-making, ultimately driving your business forward.
Understand the Level of Support and Training Offered
When selecting a data visualization consulting service, it’s important to assess the level of support and training they offer. This ensures that your team can maximize the potential of the tools provided. For example, FanRuan’s FineReport and FineBI not only offer robust visualization capabilities but also come with comprehensive training and support, empowering your team for long-term success.
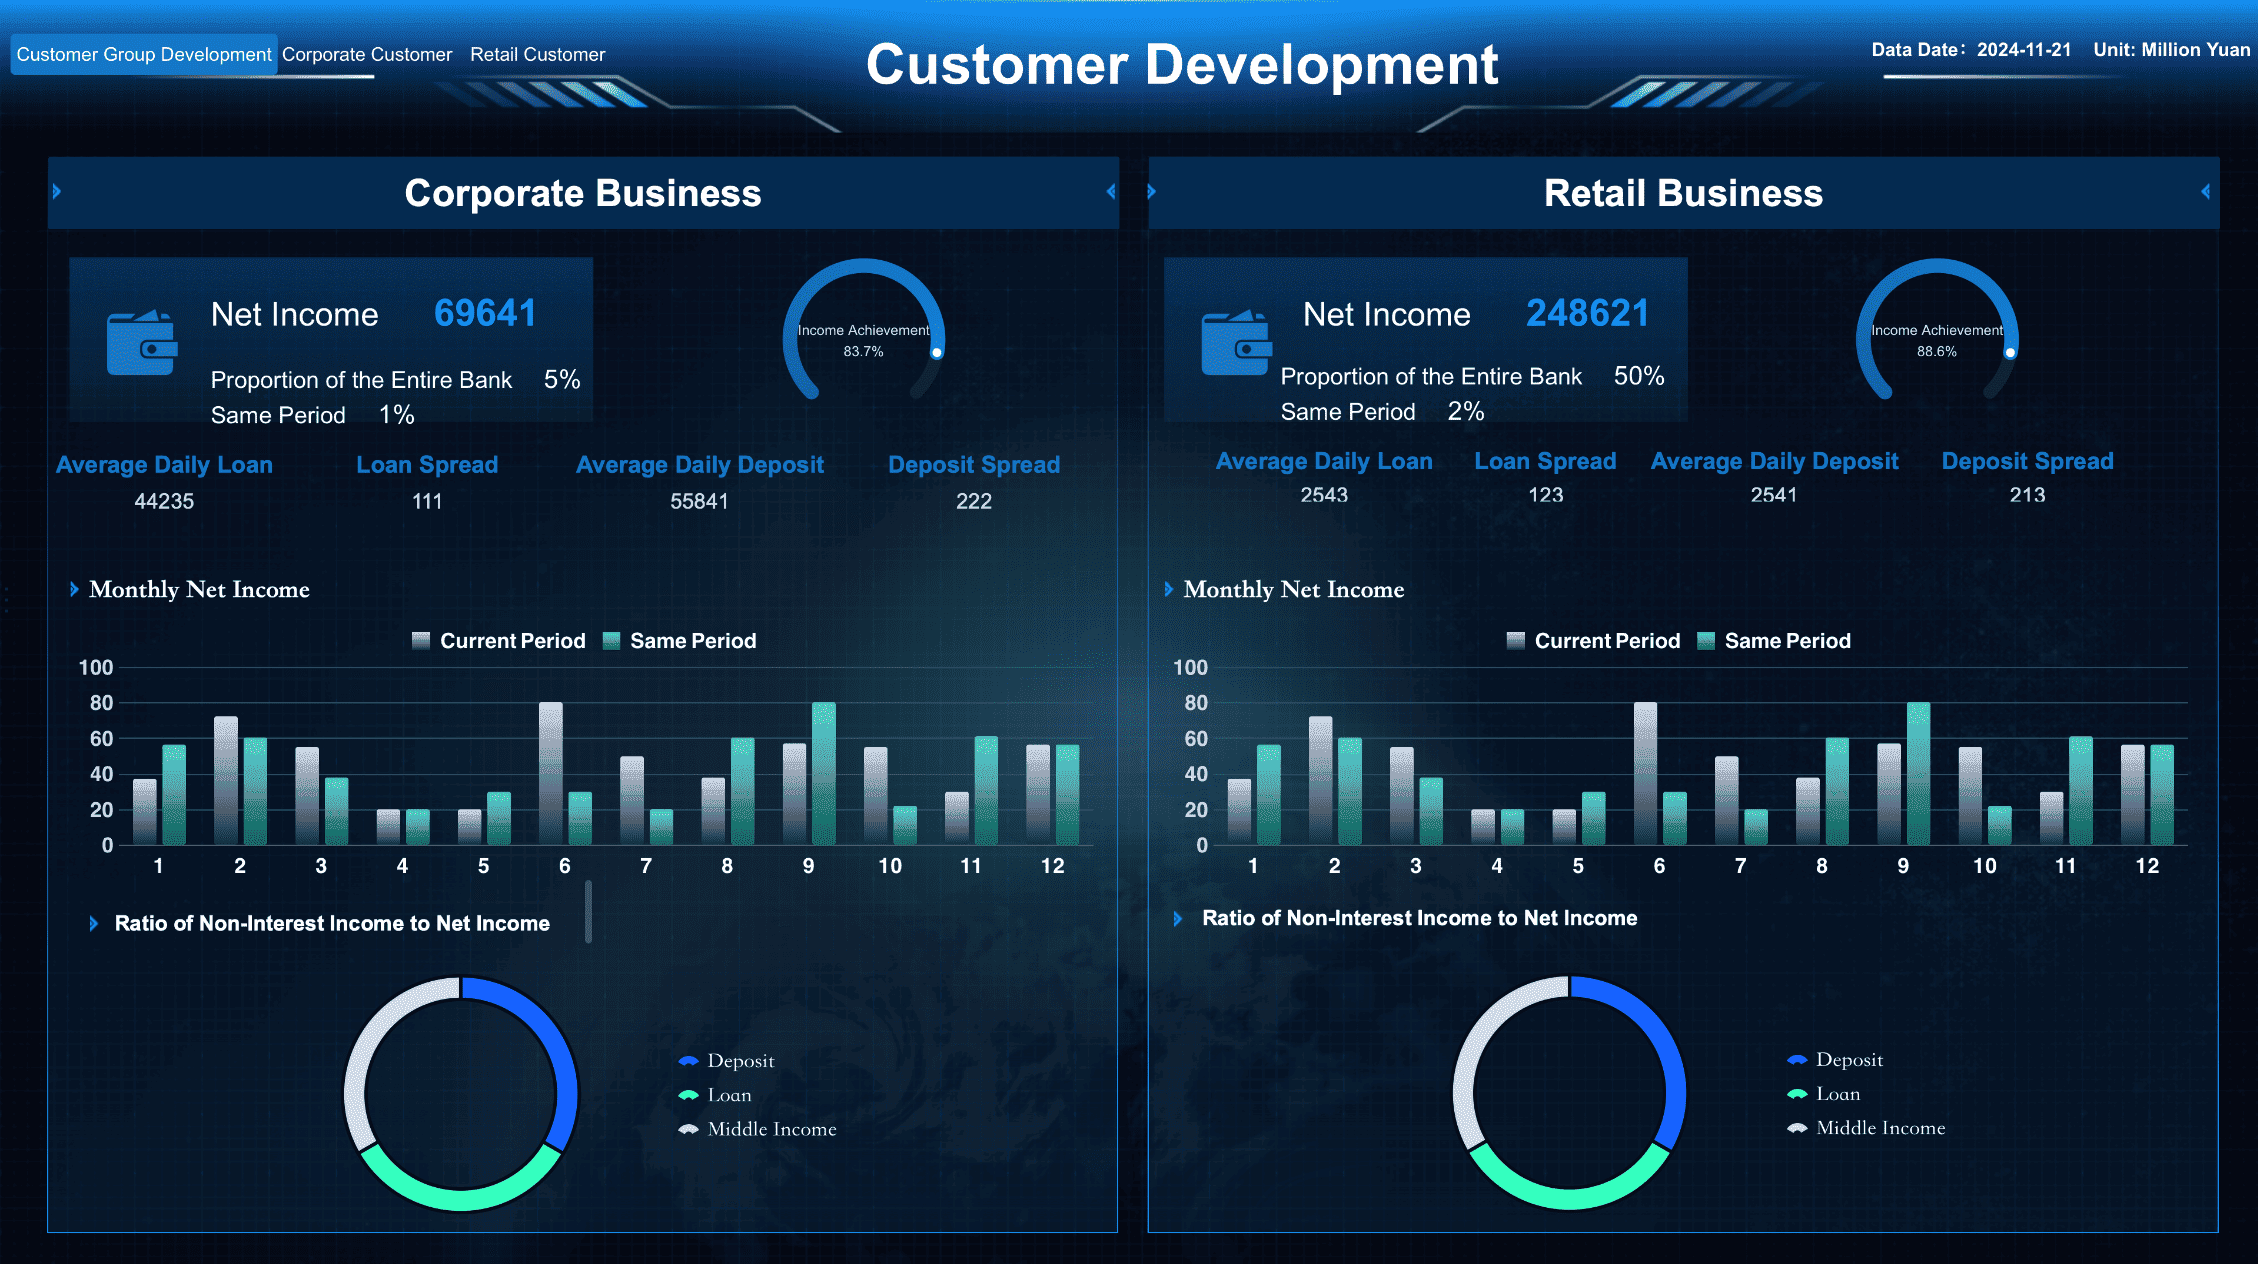
Customer Development Dashboard Created By FineReport
Continuous Assistance: Look for a consulting service that provides ongoing support. This support helps you address any issues that arise after implementation. It ensures that your data visualization tools remain effective and up-to-date.
Post-Implementation Services: Ask about post-implementation services. These services include troubleshooting, updates, and enhancements. They help maintain the effectiveness of your visualizations, ensuring that your decision-making process remains smooth and efficient.
Expert Guidance: Ensure that the service offers expert guidance. This guidance helps you optimize your workflows and understand your data better. With expert support, you can gain deeper insights into business trends and processes.
Evaluate Training Programs for Your Team
Comprehensive Training: Evaluate the training programs offered by the consulting service. Comprehensive training equips your team with the skills needed to create effective visualizations. It enhances their ability to make informed decisions based on data insights.
Tailored Programs: Look for training programs tailored to your organization's needs. Tailored programs address specific challenges your team faces. They ensure that your team can apply the best practices and techniques in data visualization.
Resource Availability: Check the availability of training resources. Resources such as manuals, tutorials, and workshops support continuous learning. They empower your team to explore and understand complex data landscapes, fostering a culture of informed decision-making.
By understanding the level of support and training offered, you ensure that your team can effectively utilize data visualization tools. This leads to improved decision-making, ultimately driving your business forward.
Review the Range of Data Visualization Consulting Services
When selecting a data visualization consulting service, it’s essential to explore the range of services they offer. This ensures that the service can meet your unique data needs and enhance your decision-making. FanRuan’s FineReport, FineBI, and FineVis offer a comprehensive suite of tools designed to cater to diverse visualization requirements, providing tailored solutions for businesses across industries.
Variety of Tools: Look for consulting services that offer a variety of visualization tools. Tools like Tableau and Power BI provide powerful capabilities for creating clear and actionable insights. These tools help you interpret key performance indicators (KPIs) effectively, making data analysis accessible to everyone, not just IT professionals.
Advanced Features: Consider the advanced features of the tools offered. Some tools provide interactive visual stories that transform your data into compelling narratives. These features enhance your ability to understand and analyze data, leading to better decision-making.
Customization Options: Ensure that the tools allow for customization. Customizable dashboards, reports, and infographics make your data easy to understand and tailor to your specific needs. This flexibility ensures that the visualizations align with your business goals and objectives.
Consider Additional Analytical Services
Comprehensive Analysis: Evaluate the additional analytical services provided by the consulting service. These services should enhance the creation, interpretation, and presentation of data visualizations. A comprehensive approach ensures that you gain deeper insights into your data, facilitating informed decision-making.
Expert Guidance: Look for services that offer expert guidance in data visualization and analytics. Consultants should help you build powerful reporting and analytics tools effortlessly. Their expertise ensures that you can leverage the full potential of your data, driving strategic growth.
Ongoing Support: Consider the level of ongoing support offered. Continuous assistance helps you address any issues that arise, ensuring that your data visualization tools remain effective. This support is crucial for maintaining the quality of your decision-making process.
By reviewing the range of data visualization services, you ensure that the chosen consulting service can meet your needs. This careful selection process leads to more informed decision-making, ultimately driving your business forward.
Evaluate Communication Skills for Data Visualization Consulting Services
When selecting a data visualization consulting service, evaluating their communication skills is essential. Effective communication allows consultants to present complex data insights clearly and persuasively, helping you make informed decisions. With tools like FanRuan’s FineReport and FineBI, consultants can create intuitive, easy-to-understand visualizations that enhance clarity and drive impactful discussions.
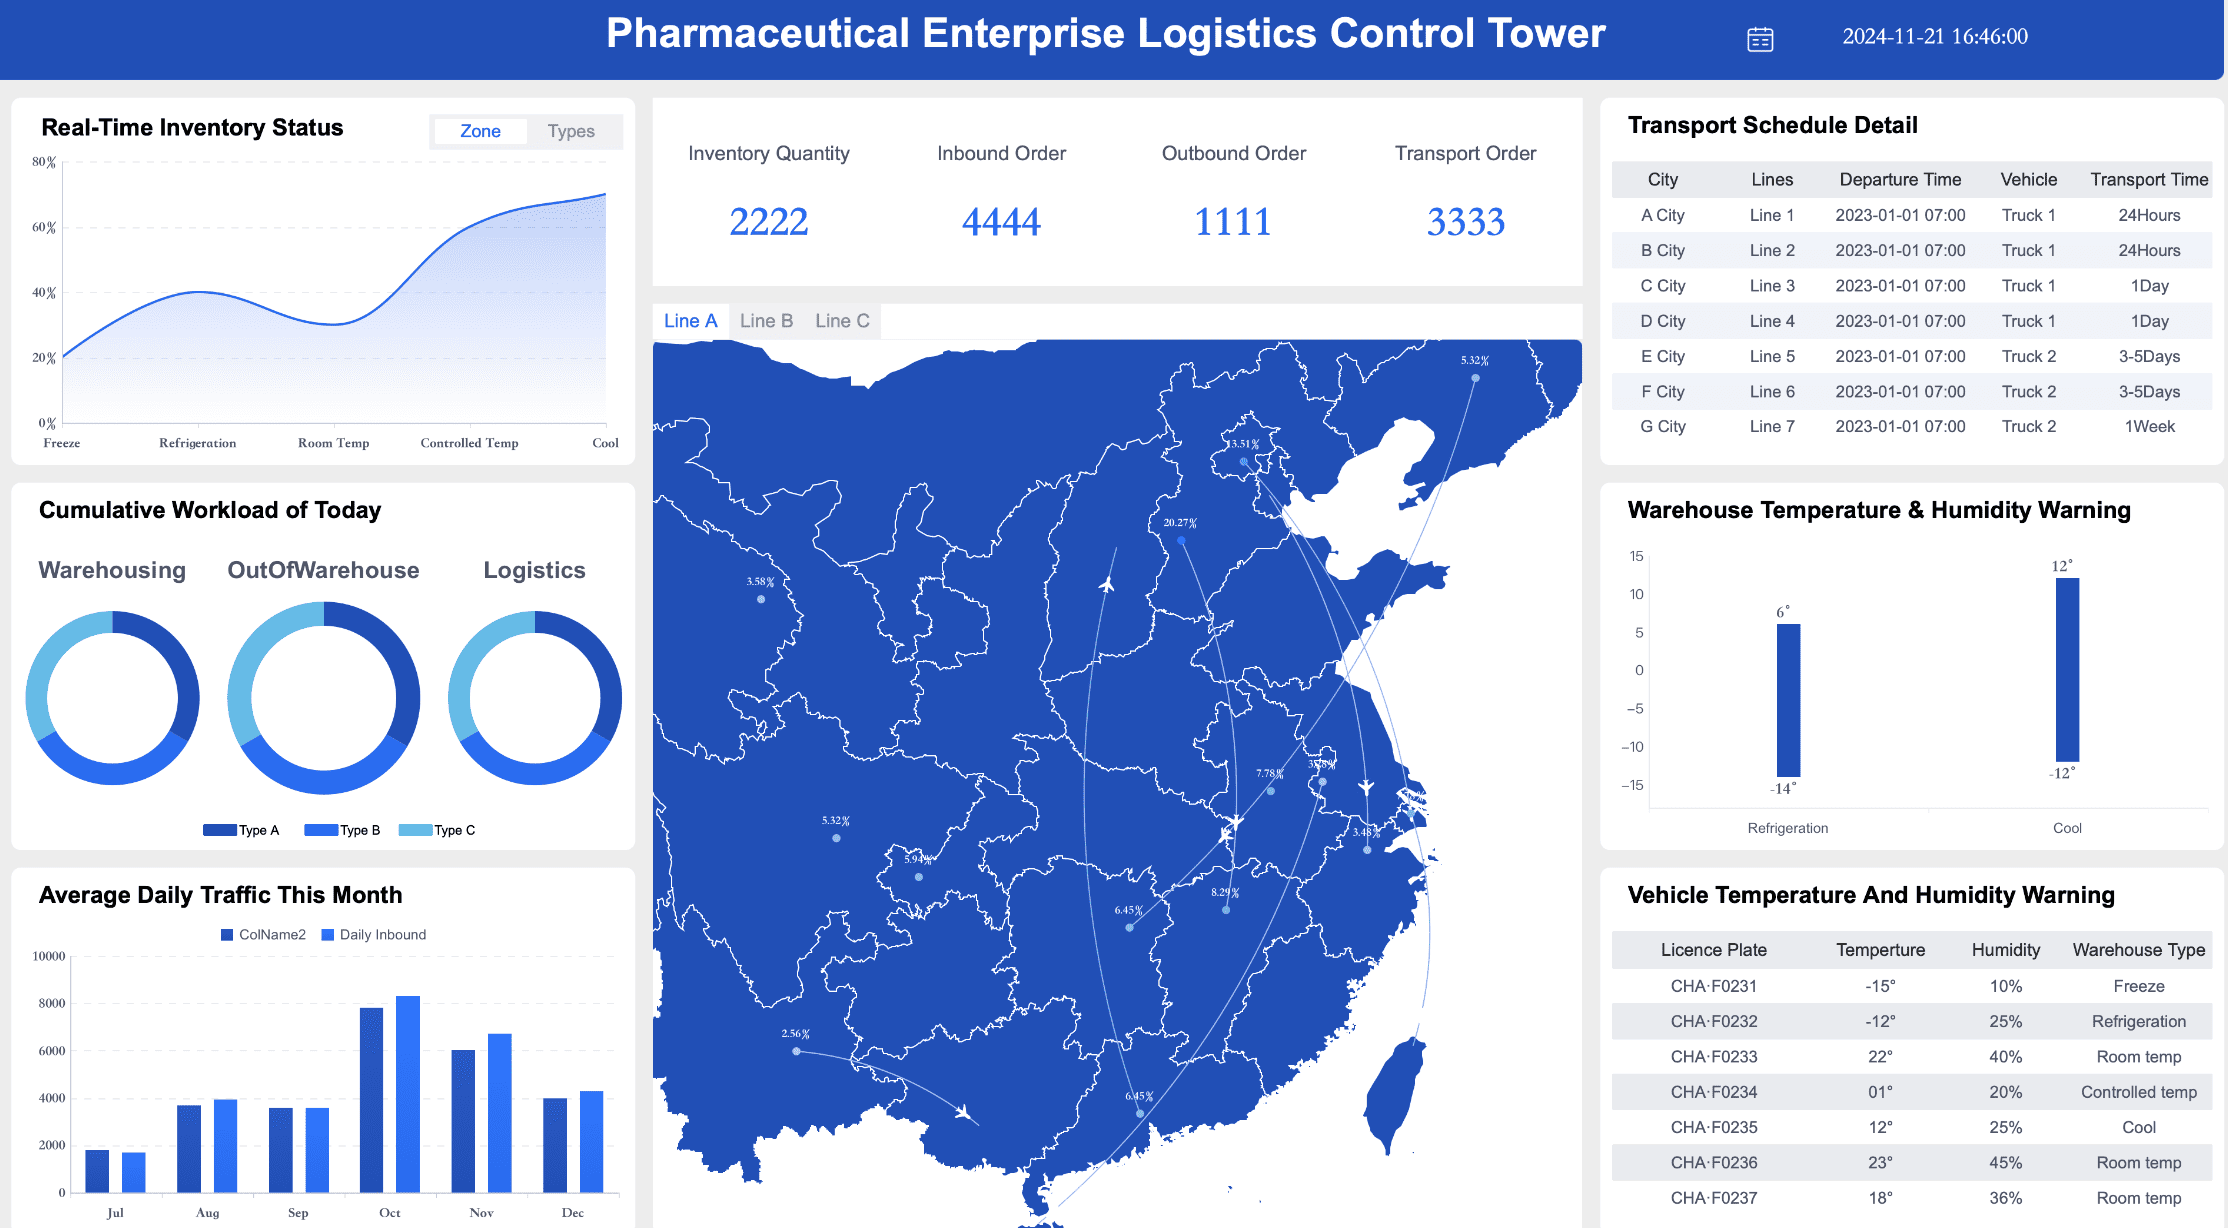
Pharmaceutical Enterprise Logistics Control Tower Dashboard Created By FineReport
Clarity in Communication: Look for consultants who communicate clearly. They should be able to explain data insights in simple terms, making it easy for you to understand and act on the information. Clear communication bridges the gap between data and business, ensuring that projects address real problems.
Responsiveness to Queries: Evaluate how responsive the consultants are to your queries. Prompt responses indicate their commitment to your project and their ability to provide timely insights. This responsiveness is crucial for maintaining the momentum of your decision-making process.
Active Listening Skills: Ensure that the consultants possess active listening skills. They should listen to your needs and concerns, allowing them to tailor their services to your specific requirements. Active listening enhances their ability to provide solutions that align with your business goals.
Importance of Regular Updates and Feedback
Regular Updates: Choose a consulting service that provides regular updates on the progress of your project. These updates keep you informed and allow you to make timely decisions based on the latest data insights. Regular communication ensures that the project stays on track and aligns with your strategic priorities.
Feedback Mechanisms: Look for consultants who encourage feedback. They should be open to your suggestions and willing to make adjustments based on your input. This collaborative approach enhances the quality of the final deliverables and ensures that the visualizations meet your expectations.
Engaging Presentations: Evaluate the consultants' ability to present data insights engagingly. They should use storytelling techniques to make the data more relatable and impactful. Engaging presentations inspire and persuade, driving informed decision-making within your organization.
By assessing communication skills, you ensure that the chosen data visualization consulting service can effectively convey insights. This careful evaluation leads to more informed decision-making, ultimately driving your business forward.
Analyze Case Studies and Client Testimonials of Data Visualization Consulting Services
When choosing a data visualization consulting service, analyzing case studies and client testimonials is essential. These real-world examples demonstrate how the service has successfully transformed data into actionable insights, improving decision-making. For instance, FanRuan's FineReport and FineBI have been widely used to deliver clear, insightful dashboards, enhancing business intelligence for various clients.
Explore Real-World Applications: Delve into case studies of the consulting service to see how they have successfully implemented data visualization solutions. For instance, Innowise's resources have demonstrated success through long-term collaboration, showcasing their reliability and expertise. Such stories reveal the practical impact of their services on businesses like yours.
Understand the Impact: Success stories often illustrate how data visualization has improved decision-making. Nick's workshops, for example, have inspired organizations to communicate data more effectively, leading to better decisions. These narratives provide a glimpse into the transformative power of effective data visualization.
Identify Key Takeaways: Each success story offers lessons that you can apply to your own business. Bill Wood from NASA emphasized the importance of clarity in decision-making, achieved through Nick's workshops. By learning from these experiences, you can better understand how to leverage data visualization for strategic growth.
Consider Client Feedback and Satisfaction
Gauge Client Satisfaction: Client testimonials offer direct insights into the satisfaction levels of previous clients. Katie Grotenhuis praised Nick's engaging presentations, which made data visualization fun and integral to their efforts. Positive feedback indicates a consulting service's ability to meet client needs effectively.
Evaluate Training and Support: Testimonials often highlight the quality of training and support provided. Simran Singh recommended Nick's workshop for its user-centered approach, which deepened comprehension and retention. This feedback helps you assess whether the service can equip your team with the necessary skills for effective decision-making.
Assess Long-Term Benefits: Look for testimonials that mention long-term benefits. Michel Dekker noted the inspiration and new ideas gained from Nick's courses, which enabled better data communication. Such endorsements suggest that the consulting service can deliver lasting value to your organization.
By analyzing case studies and client testimonials, you gain a comprehensive understanding of a consulting service's capabilities. This evaluation helps you make informed decisions, ensuring that the chosen service aligns with your business goals and enhances your decision-making process.
Consider Cost and ROI for Data Visualization Consulting Services
When selecting data visualization consulting services, it's essential to consider both cost and return on investment (ROI). This evaluation ensures that you choose a service that aligns with your budget while maximizing the benefits for your business. For example, FanRuan’s FineReport, FineBI, and FineVis offer cost-effective solutions with powerful analytics and visualization capabilities. These tools can help you streamline data processes, enhance decision-making, and ultimately drive better business outcomes, providing a solid ROI for your investment.
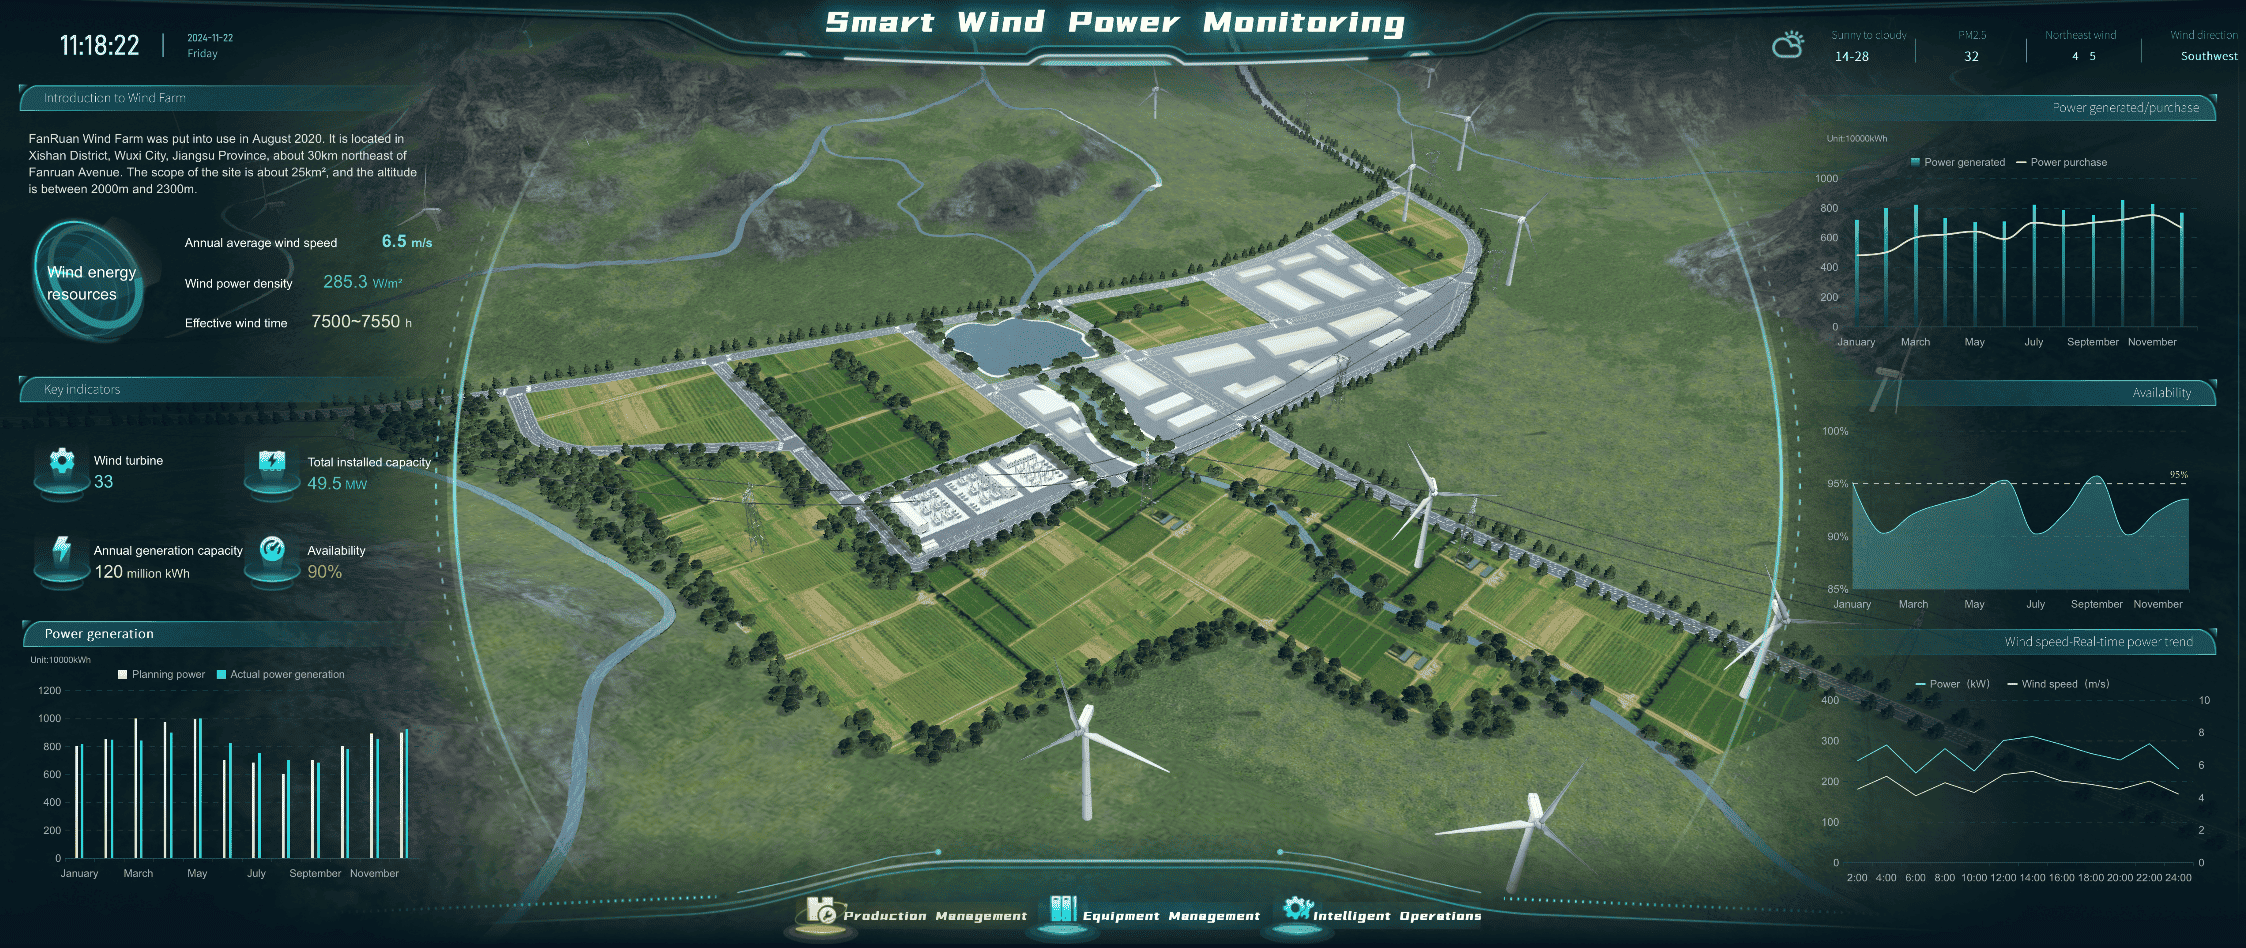
Smart Wind Power Monitoring Dashboard Created By FineVis
Understand Different Pricing Structures: Consulting services often offer various pricing models. Some charge a flat fee, while others may bill hourly. Understanding these structures helps you determine which model suits your financial plan. A clear pricing structure allows you to anticipate expenses and avoid unexpected costs.
Consider Software and Training Costs: Beyond the consulting fees, consider additional expenses such as software licenses and employee training. Consultants might recommend specific tools that require purchasing or upgrading. Training costs for new systems can also add up. Evaluating these factors ensures a comprehensive understanding of the total investment required.
Assess Long-Term Financial Impact: Look beyond immediate costs. Consider the long-term financial impact of the consulting service. Improved data insights and analytics capabilities can lead to better decision-making, ultimately enhancing business outcomes. Weighing these benefits against the initial investment provides a clearer picture of the service's value.
Evaluate Potential Return on Investment
Identify Expected ROI: Determine the expected ROI from the consulting service. This involves estimating the financial gains from improved insights and decision-making processes. A realistic ROI estimate helps you gauge the service's effectiveness in driving strategic growth.
Align with Business Goals: Ensure that the potential ROI aligns with your business goals. The insights gained should support your objectives, whether it's increasing sales, improving efficiency, or enhancing customer satisfaction. Alignment with goals ensures that the investment contributes to achieving desired outcomes.
Monitor and Measure Success: After implementing the service, continuously monitor and measure its success. Track key performance indicators (KPIs) to assess the impact on your business. Regular evaluation helps you determine if the service delivers the expected ROI and informs future decision-making.
By carefully considering cost and ROI, you ensure that the chosen data visualization consulting services provide value for your investment. This thoughtful approach leads to informed decision-making, ultimately driving your business forward.
Choosing the Right Data Visualization Consulting Services with FanRuan
Selecting the right data visualization consulting services is essential for improving your business's decision-making capabilities. FanRuan excels in this area, offering comprehensive solutions that transform raw data into clear, actionable insights. With tools like FineReport, FineBI, and FineVis, FanRuan empowers businesses to create interactive, customized visualizations that enhance data understanding and drive strategic growth. By partnering with FanRuan’s expert consultants, you can optimize your data processes and make more informed, timely decisions that align with your business goals.
Explore FanRuan's Expertise in Data Visualization Consulting Services
FanRuan has established itself as a prominent player in the data analytics landscape. With a focus on innovation and customer-centricity, FanRuan empowers businesses to harness the full potential of their data. The company has successfully implemented over 92,000 projects globally, serving more than 30,000 clients. This extensive experience ensures that FanRuan can provide tailored solutions that meet your unique data needs.
FanRuan's team of experts possesses deep knowledge in data visualization tools and techniques. They understand the importance of translating complex data into clear visual formats, which is crucial for effective decision-making. By choosing FanRuan, you gain access to a wealth of expertise that can help you navigate the complexities of data analysis and visualization.
Discover FineBI and FineVis for Enhanced Data Visualization Solutions
FineBI and FineVis are two powerful tools offered by FanRuan that can elevate your data visualization capabilities. FineBI is a self-service business intelligence software designed to empower users to connect, analyze, and share data across the organization. It transforms raw data into insightful visualizations, enabling you to track key performance indicators (KPIs), identify trends, and predict future outcomes. With FineBI, you can enhance your decision-making process by gaining deeper insights into your data.
FineVis, on the other hand, is an agile data visualization platform that unlocks the power of interactive charts and dynamic 3D visualizations. It provides customizable dashboards and real-time analytics, allowing you to optimize data insights and streamline decision-making. FineVis caters to a wide range of users, from beginners to advanced data analysts, making it a versatile choice for various sectors.
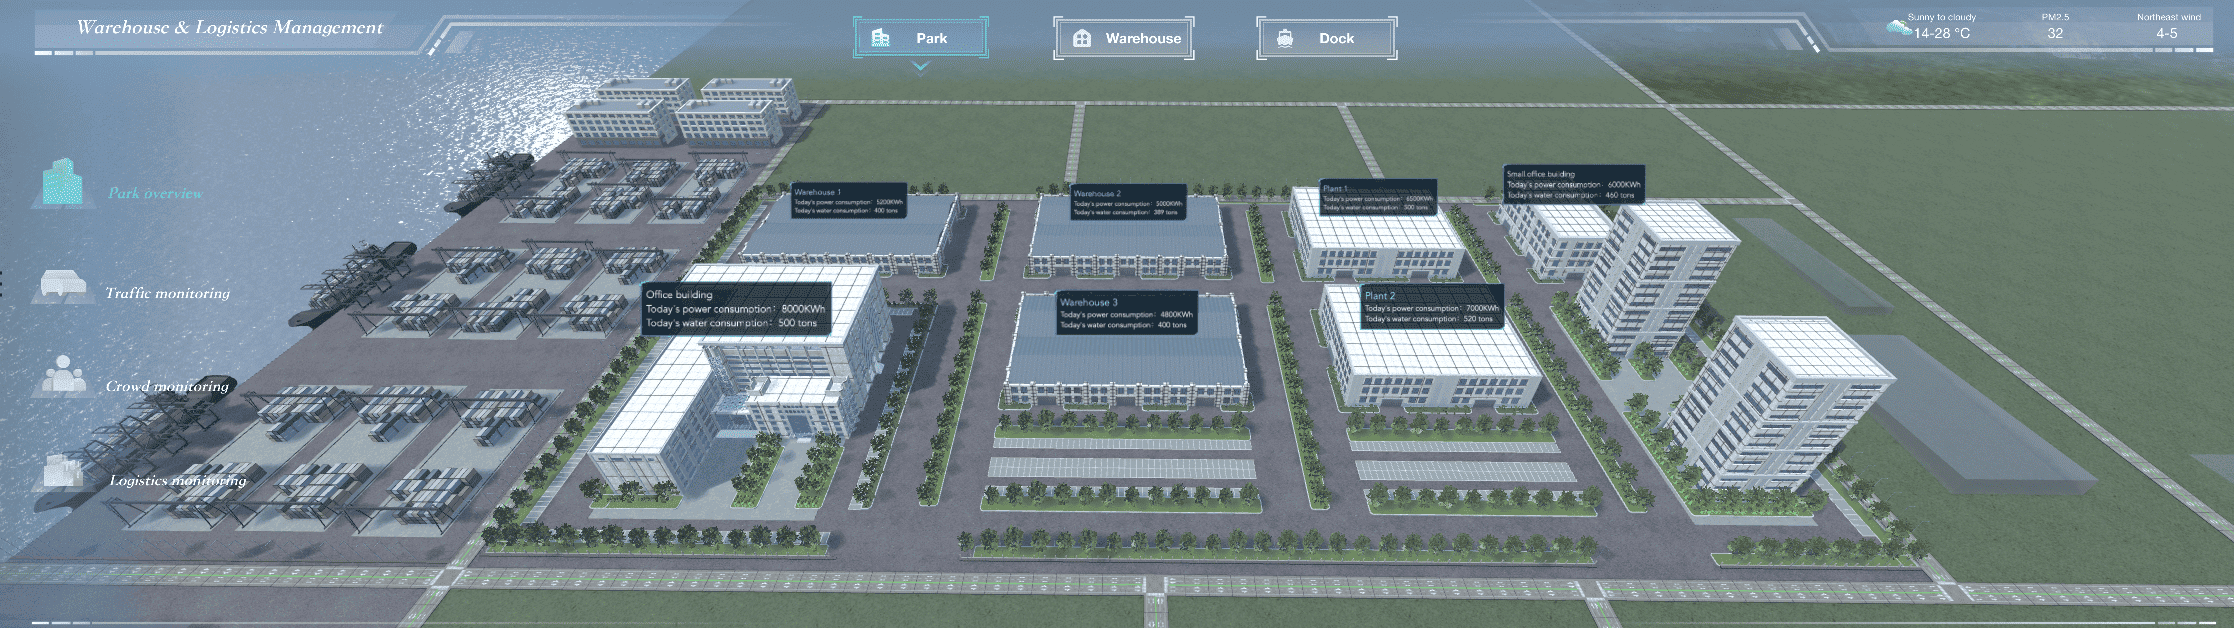
Warehouse & Logistics Management Dashboard Created By FineVis
By integrating FineBI and FineVis into your data strategy, you can create a comprehensive analytics platform that delivers actionable insights. These tools enable you to explore and understand complex data landscapes, fostering a culture of informed decision-making within your organization.
Tableau Consulting Service and Other Options
When considering data visualization solutions, you might explore various options, including Tableau consulting services, known for its advanced features in transforming complex data into clear visual insights. However, it’s essential to compare these services with alternatives like FanRuan’s FineReport, FineBI, and FineVis. These tools offer highly customizable, scalable solutions that can seamlessly integrate with your data infrastructure, providing enhanced flexibility and ease of use. Choosing the right tool depends on your specific business needs and the level of customization required.
Compare Tableau Consulting Service with Other Data Visualization Consultants
Expertise and Popularity: The tableau consulting service is renowned for its expertise in data visualization. It is a popular choice among businesses seeking to enhance their decision-making processes. Experienced tableau consultants bring a wealth of knowledge, ensuring that your data is presented in the most effective way possible. In contrast, other consultants like Luzmo and Holistics offer dynamic alternatives, particularly for embedded analytics.
Flexibility and Customization: While Tableau provides a comprehensive tableau consulting service, other tools like Power BI and Looker offer flexibility and customization. These alternatives might better suit companies with specific needs. For instance, Power BI is known for its strong analytical capabilities, making it a viable option depending on your business requirements.
Tailored Solutions: Some businesses prefer customized tableau consulting services to meet their unique data needs. This customization ensures that the visualizations align with your strategic goals. However, other consultants might offer more intuitive and tailored insights, which could be beneficial for certain industries.
Evaluate the Benefits of Different Data Visualization Tools
Advanced Visualization Capabilities: Tableau excels in providing advanced visualization features. Its ability to handle complex datasets makes it a preferred choice for many organizations. However, evaluating other tools like Luzmo and Holistics can reveal additional benefits, such as ease of integration and user-friendly interfaces.
Decision-Making Enhancement: The primary goal of any data visualization tool is to enhance decision-making. Tableau's robust features support this by offering clear and actionable insights. Yet, other tools might provide different perspectives or functionalities that better suit your decision-making style.
Industry-Specific Solutions: Consider the industry-specific solutions offered by different tools. While Tableau is versatile, other options might cater more specifically to your sector's challenges. For example, Looker provides tailored solutions that can address unique industry needs, potentially offering a competitive edge.
By comparing the tableau consulting service with other data visualization consultants, you can identify the best fit for your organization. This careful evaluation ensures that you choose a service that aligns with your business goals and enhances your decision-making process.
Selecting the right data visualization consulting services is crucial for transforming raw data into actionable insights. You should align these services with your business goals to enhance decision-making. Start by defining your requirements and evaluating potential consultants based on their ability to meet your specific needs. This approach ensures that you invest resources wisely, leading to increased ROI. By focusing on insights that support strategic objectives, you can drive your business forward. Take the time to evaluate your options, set realistic expectations, and track your progress over time for informed decision-making.
Click the banner below to experience FineBI for free and empower your enterprise to convert data into productivity!
Product Trial
FineReport
Pixel-perfect reports · Interactive dashboards · Easy data entry · Digital twins
Smarter product, pricing, and inventory management across retail sectors.
FAQ
What is the role of a data visualization consultant?
A data visualization consultant helps you transform raw data into visual formats that are easy to understand. They use various tools and techniques to create charts, graphs, and dashboards. These visuals aid in decision-making by highlighting trends and patterns in your data.
How do I choose the right data visualization tool?
The choice of tool depends on your specific needs. Consider factors like the complexity of your data, the level of interactivity required, and your team's technical skills. Popular tools include Tableau, Power BI, and FineBI. Each offers unique features that can enhance your decision-making process.
What should I expect from a data visualization consulting service?
Expect a comprehensive approach that includes data analysis, visualization design, and implementation. Consultants should provide ongoing support and training to ensure your team can effectively use the tools. This support enhances your ability to make data-driven decisions.
How can data visualization improve my business outcomes?
Data visualization simplifies complex data, making it easier to identify insights. By presenting data visually, you can quickly grasp information, leading to faster and more informed decision-making. This approach can improve operational efficiency and strategic growth.
What impact does data visualization have on decision-making?
Data visualization has a significant impact on decision-making. It allows you to see patterns and trends that might not be apparent in raw data. Visuals help you communicate insights effectively, leading to better decisions. According to a survey, 93% of institutions reported a positive impact on student learning and satisfaction through video tools, highlighting the power of visual aids in enhancing understanding.