Best reporting tools are advanced solutions that turn raw data into clear, interactive, and customizable reports and dashboards, enabling accurate performance tracking and informed decision-making.
Here are 10 best reporting tools you can try:
Businesses rely on the best reporting tools to drive growth, efficiency, and competitiveness. FineReport by FanRuan stands out among the best client reporting tools, offering robust reporting capabilities and seamless data integration. Companies choose these solutions to centralize data, uncover actionable insights, and support data-driven decision-making. Modern reporting tools deliver actionable insights by integrating data from multiple sources, enabling faster data-driven decisions and improved workflows. Adoption rates have surged, with 49% of companies using BI analytics in 2024 and SaaS-based reporting tools projected to reach 85% of business applications by 2025.
| Metric / Statistic | Value / Projection | Year / Period | Description |
|---|---|---|---|
| Increase in BI analytics utilization | 49% of companies | 2024 | Indicates growing adoption of BI and reporting tools |
| Percentage of business applications SaaS-based | 85% | 2025 (projected) | Shows dominance of SaaS apps in business environments |
| Mobile BI market CAGR | 15.3% | 2024-2032 | Rapid growth in mobile BI solutions |
Reporting tools serve as essential platforms for transforming raw data into actionable insights. These solutions enable organizations to generate static or interactive reports, offering a clear snapshot of historical and current performance. Businesses use data reporting tools to summarize financial and operational data, helping teams understand what has happened and where the company stands. The best reporting tools, including the best client reporting tools, support both standard and custom client reports, making them vital for financial reporting, compliance, and strategic planning.
Modern data reporting tools offer a wide range of features:
A comparison of the most widely used reporting tools among growing businesses in 2025 highlights their strengths:
| Reporting Tool | Key Features & Strengths | Target Users / Suitability |
|---|---|---|
| Tableau | Custom dashboards, CRM integrations, AI-driven insights | Enterprises, B2B teams |
| Power BI | Microsoft integration, real-time dashboards | Mid-large businesses |
| Domo | Real-time visualization, 1000+ data sources, mobile | Distributed teams |
| Looker | Embedded analytics, SQL modeling, Google Cloud integration | SaaS, data-driven organizations |
| Zoho Analytics | Affordable, CRM integration, role-based dashboards | Small to mid-market companies |
| Klipfolio | Real-time KPI tracking, pre-built templates | Small businesses |
Financial reporting tools play a critical role in business intelligence and growth. They allow organizations to present financial and operational data in a structured, transparent manner, which enhances investor confidence and supports capital acquisition. Well-designed client reporting tools help clients and stakeholders track key financial metrics such as revenue growth, net profit margin, ROI, and EBITDA. These metrics provide a clear view of business health and efficiency.
Data reporting tools also support better decision-making by enabling dynamic comparison and analysis of financial and operational data. Companies can use these tools to align social, environmental, and financial outcomes, ensuring that every decision supports both growth and responsibility. Effective reporting and analytics practices—such as organized layouts, visual aids, and tailored dashboards—strengthen stakeholder engagement and foster trust.
Tip: Businesses that leverage cloud-based business intelligence and advanced data visualization tools can access real-time insights, automate client reports, and drive continuous improvement. This approach ensures that clients receive timely, accurate, and actionable information, supporting long-term financial success.
Selecting the best reporting tools for business growth requires a careful evaluation of several essential factors. Companies should focus on integration, scalability, automation, and ease of use when comparing financial reporting tools and data reporting tools. These criteria ensure that organizations can manage financial data, track metrics, and create dashboards that support real-time reporting and data analysis.
Integration stands as a top priority for businesses seeking effective reporting. Leading data reporting tools connect directly with ERP, CRM, and other business systems using open APIs. This seamless integration prevents data silos and enables real-time data sharing across departments. FineReport by FanRuan excels in this area, offering over 500 data source connections and supporting both structured and unstructured data. The platform allows users to embed customizable dashboards and financial reports into daily workflows, ensuring that financial metrics and operational data remain accessible for analysis and decision-making.
Tip: Choose reporting tools that offer low-code integration and support for multiple data sources. This approach simplifies data preparation and enhances the value of financial reporting tools.
Scalability ensures that reporting solutions grow with the business. Top data reporting tools handle increasing data volumes, more users, and new data sources without sacrificing performance. FineReport supports large-scale financial data analysis, making it ideal for enterprises with expanding reporting needs. The platform manages big data sets and delivers real-time reporting, allowing organizations to monitor financial metrics and dashboards as their operations evolve.
| Scalability Feature | Description |
|---|---|
| Data Volume | Handles large and complex financial data sets |
| User Management | Supports more users as teams grow |
| Source Expansion | Integrates new data sources with ease |
Automation reduces manual workload and improves data accuracy. Modern financial reporting tools automate data collection, transformation, and report generation. FineReport enables scheduled reporting, real-time data updates, and automated distribution of financial dashboards. These features ensure that financial metrics remain current and reliable. Automation also accelerates data analysis, allowing teams to focus on strategic financial decisions rather than repetitive tasks.
Ease of use remains critical for adoption and productivity. The best data reporting tools feature intuitive interfaces, drag-and-drop report builders, and ready-to-use templates. FineReport offers an Excel-like designer, making it easy for users to create financial dashboards and reports without advanced technical skills. The platform supports interactive data analysis, enabling users to explore financial metrics and generate insights quickly. AI reporting tools further enhance usability by providing smart recommendations and automating complex data analysis tasks.
Note: User-friendly reporting tools reduce training time and empower teams to leverage financial data for better decision-making.
FineReport addresses all these criteria, making it a top choice for enterprises and growing businesses that demand robust financial reporting tools, advanced data analysis, and real-time reporting capabilities.
Website: https://www.fanruan.com/en/finereport
FineReport stands out among the best client reporting tools for 2025. This financial reporting software delivers pixel-perfect reporting, advanced multi-source integration, and mobile BI capabilities. FineReport features an Excel-like interface, reducing learning time for users. It supports custom financial reports, data import, and leverages big data technology for real estate and business chain management. The platform offers advanced visualization plugins, including 3D card animations, bullet maps, and dynamic water balloon charts, making financial data presentation engaging and clear.
| Aspect | Details |
|---|---|
| Distinguishing Features | Excel-analogous interface, custom reporting, multi-source integration, advanced security, big data support, 3D visualizations, mobile dashboards, and real-time reporting. |
| Pricing | Not explicitly detailed; 24/7 support via email and chat. |
| Ideal Use Cases | Government, large enterprises, and sectors needing detailed financial data exploration, communication management, and operational efficiency. |
FineReport supports both independent and integrated deployment, offering high performance and stable environments. It excels in automating financial reporting, scheduled distribution, and permission management. The platform is ideal for organizations that require a comprehensive financial reporting solution with customizable dashboards and robust analytics.
FineReport empowers clients to manage complex financial data, streamline reporting, and make informed decisions with real-time data and advanced analytics.
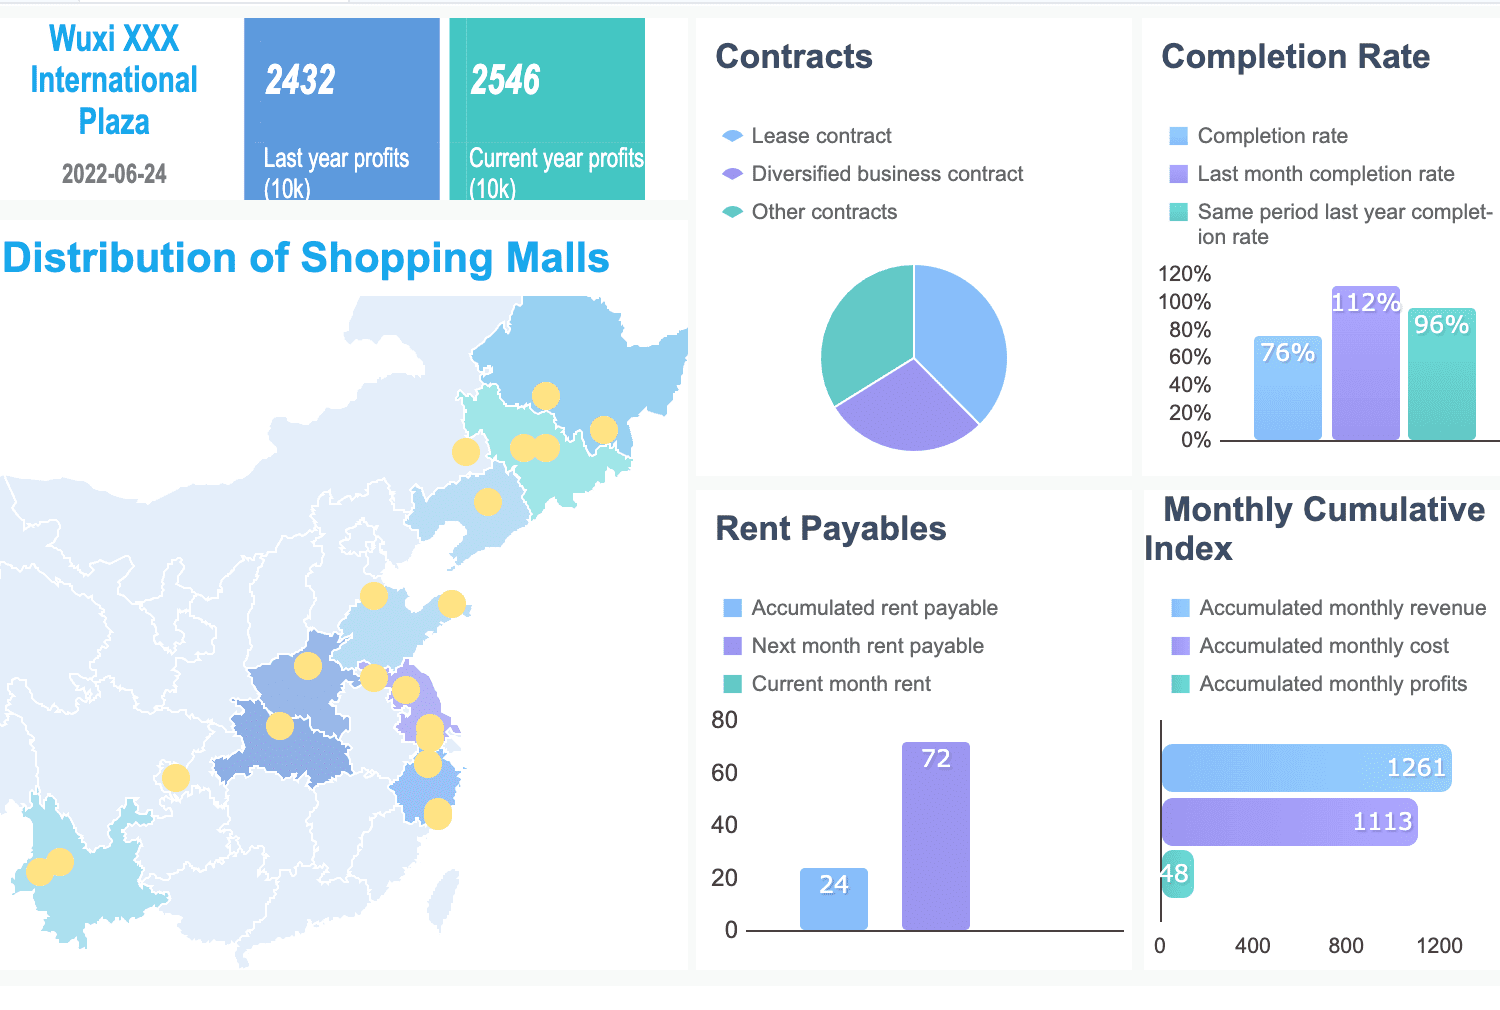
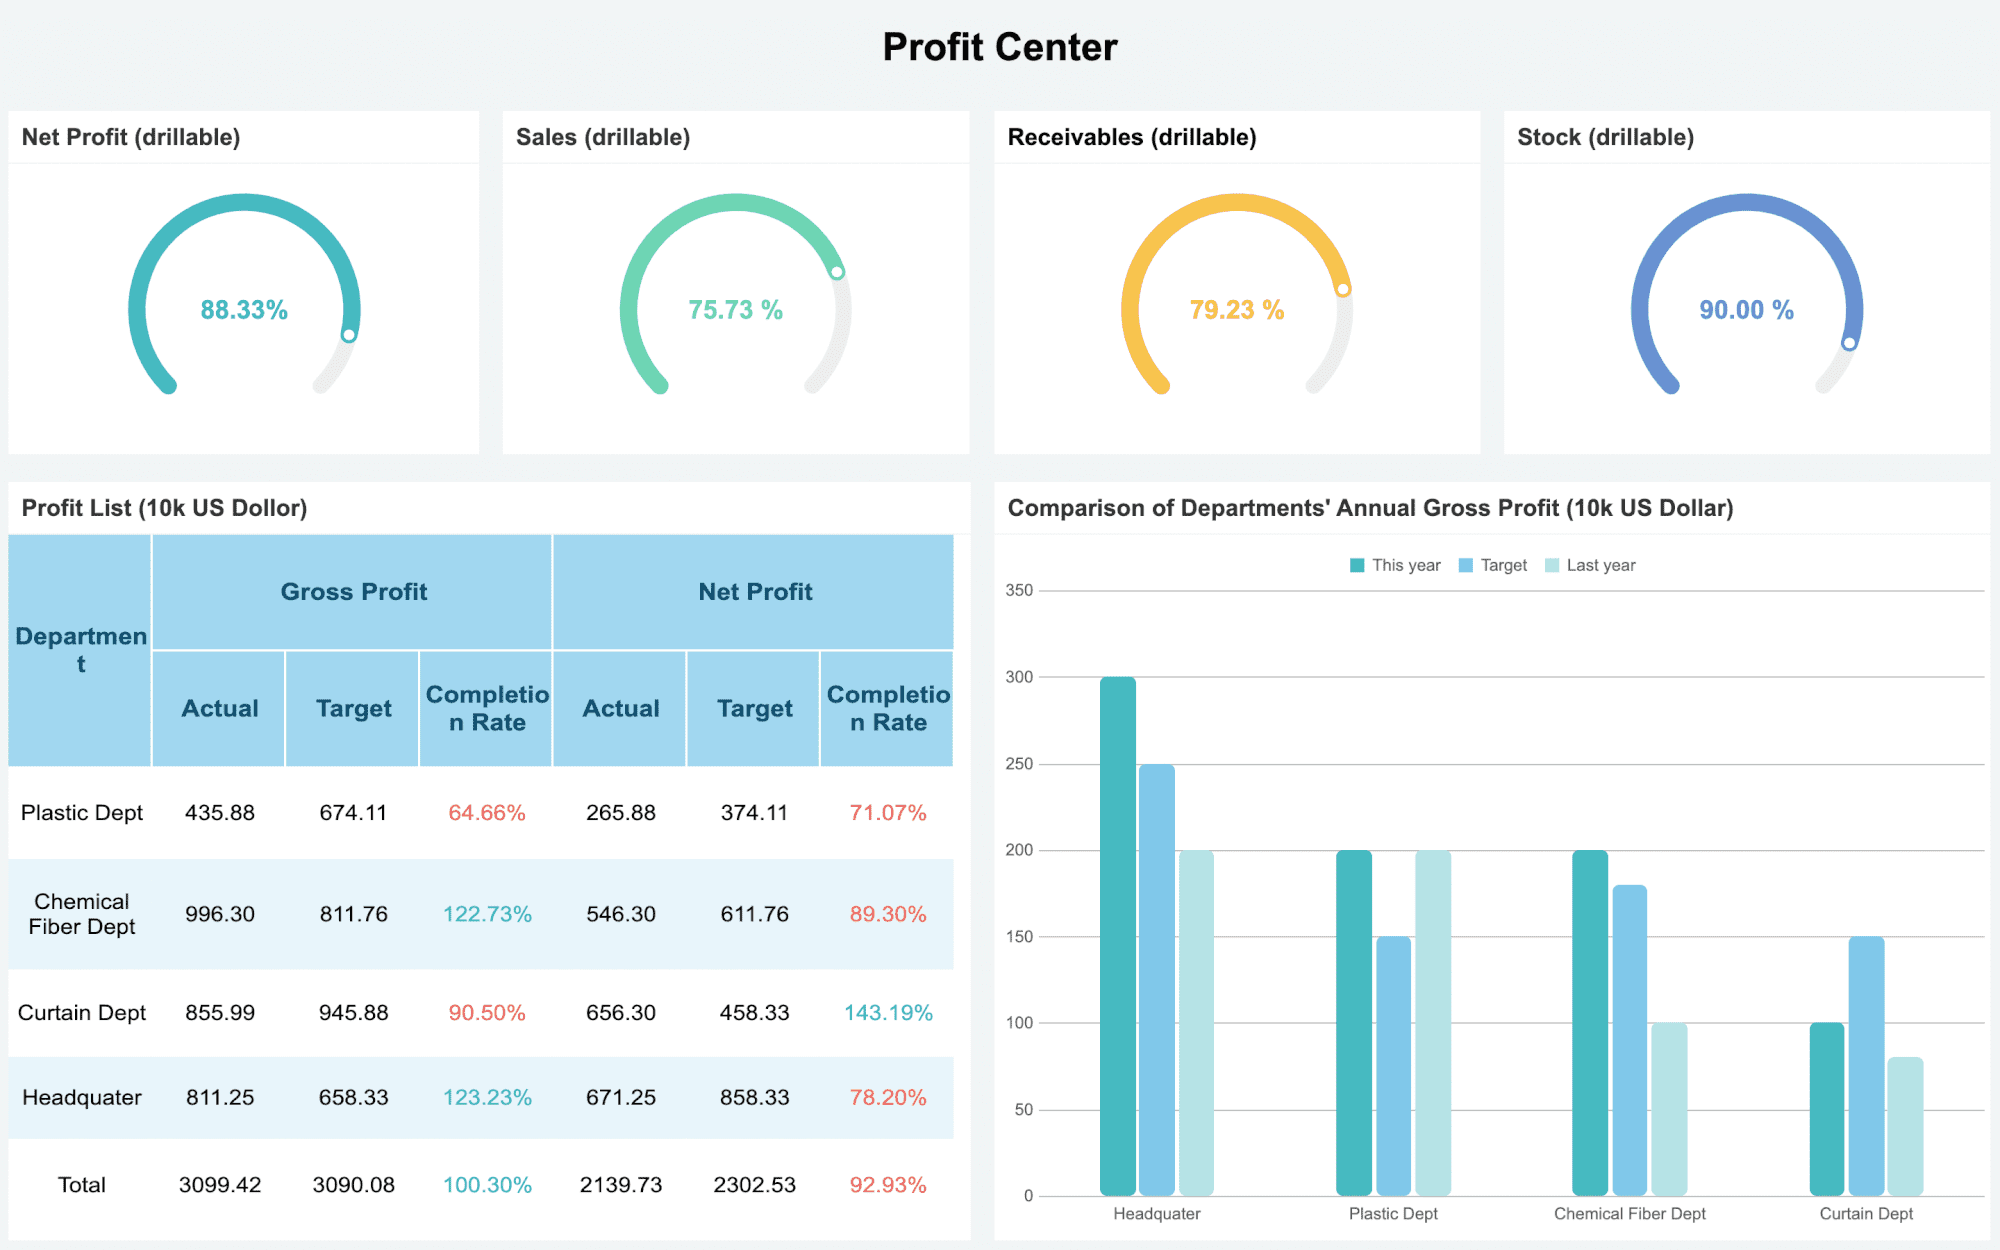
Below is a Hotel Group Management Dashboard created by FineReport.
Power BI, developed by Microsoft, remains a leading financial reporting software for businesses of all sizes. It integrates seamlessly with the Microsoft ecosystem, including Excel, SharePoint, and Teams. Power BI offers data transformation, natural language queries, custom visuals, and real-time data streaming. The platform supports role-based security, AI insights, and embedded analytics.

Website: https://www.microsoft.com/en-us/power-platform/products/power-bi
| Aspect | Details |
|---|---|
| Key Features | Data transformation, mobile access, custom visuals, real-time data, AI insights, collaboration tools, predictive analytics, and multi-language support. |
| Pricing | Free plan; Pro at $9.99/user/month; Premium Per User at $20/user/month; Premium capacity at $4,995/month. |
| Target Users | Small businesses to large enterprises, especially those using Microsoft products. |
| Pros | Cons |
|---|---|
| Extensive visualizations, strong integration, affordable pricing, mobile access, AI analytics, enterprise security | Steep learning curve for advanced features, Windows-centric, dataset size limits, complex licensing, technical dependencies |
Power BI suits organizations seeking scalable financial reporting tools with deep integration into Microsoft products. It supports both non-technical and advanced users, making it a flexible financial reporting solution.
Tableau continues to lead in financial reporting and analytics with its focus on AI-driven insights and interactive dashboards. Tableau Next introduces Agentic AI for smarter analytics, while semantic connectors integrate Salesforce Data Cloud models. The platform offers dynamic visualization upgrades, natural language querying, and improved dashboard styling.

Website: https://www.tableau.com/
| User Role | Monthly Price (Billed Annually) |
|---|---|
| Creator | $75 |
| Explorer | $42 |
| Viewer | $15 |
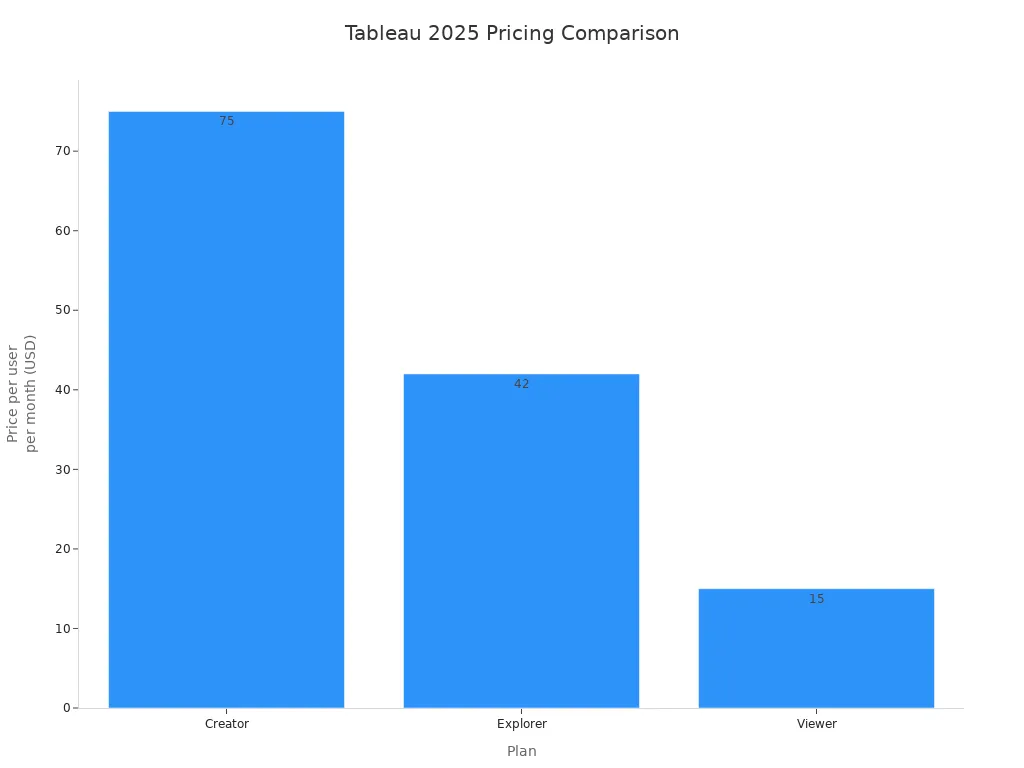
Tableau excels in user-friendly drag-and-drop dashboards, strong data integration, and advanced analytics. It supports predictive modeling, real-time data exploration, and powerful geographical visualizations. However, high pricing, limited automation, and complex formatting can challenge smaller organizations. Tableau fits enterprises needing advanced financial reporting software and interactive dashboards for deep financial analysis.
Looker, part of Google Cloud, offers a flexible platform for financial reporting and analytics. The free version supports Google-owned connectors, while the Pro version adds collaboration, automation, and enterprise-grade security. Looker Studio enables real-time reporting, customizable dashboards, and scheduled report delivery.

Website: https://lookerstudio.google.com/navigation/reporting
| Feature | Looker Studio Free | Looker Studio Pro ($9/user/month) |
|---|---|---|
| Data Connectors | Google-owned only | Expanded, third-party connectors extra |
| Collaboration | Single-user editing | Real-time multi-user editing, team workspaces |
| Report Delivery | Manual sharing | Automated and scheduled delivery |
| Security | Basic | Enterprise-grade |
| Support | Community forums | Priority and Google technical support |
| Automation | Manual refresh | Scheduled and automated updates |
| Customization | Basic templates | Advanced permissions and access controls |
| Mobile Access | View-only | Enhanced integration and editing |
Looker Studio is ideal for individuals, agencies, and enterprises needing flexible financial reporting tools. The platform’s modular pricing and add-on costs can increase expenses for larger teams. It excels in integration with Google platforms and supports a wide range of client reporting tools.
Qlik Sense delivers a robust analytics platform with self-service visualization, real-time data pipelines, and advanced AI/ML capabilities. The platform supports automated data integration, dashboard building, and predictive analytics. Qlik Sense offers flexible pricing based on users and data capacity.

Website: https://www.qlik.com/us/products/qlik-sense
| Analytics Platform Plans | Price | User Type | Data Capacity | Best For |
|---|---|---|---|---|
| Basic | Free | Limited functionality | Restricted | Getting started and basic exploration |
| Business | $30/user/month | Individuals, small teams | 25 GB fixed | Small teams with limited data needs |
| Enterprise | Custom pricing | Unlimited scaling | Starts at 50 GB, scalable | Large organizations with extensive data |
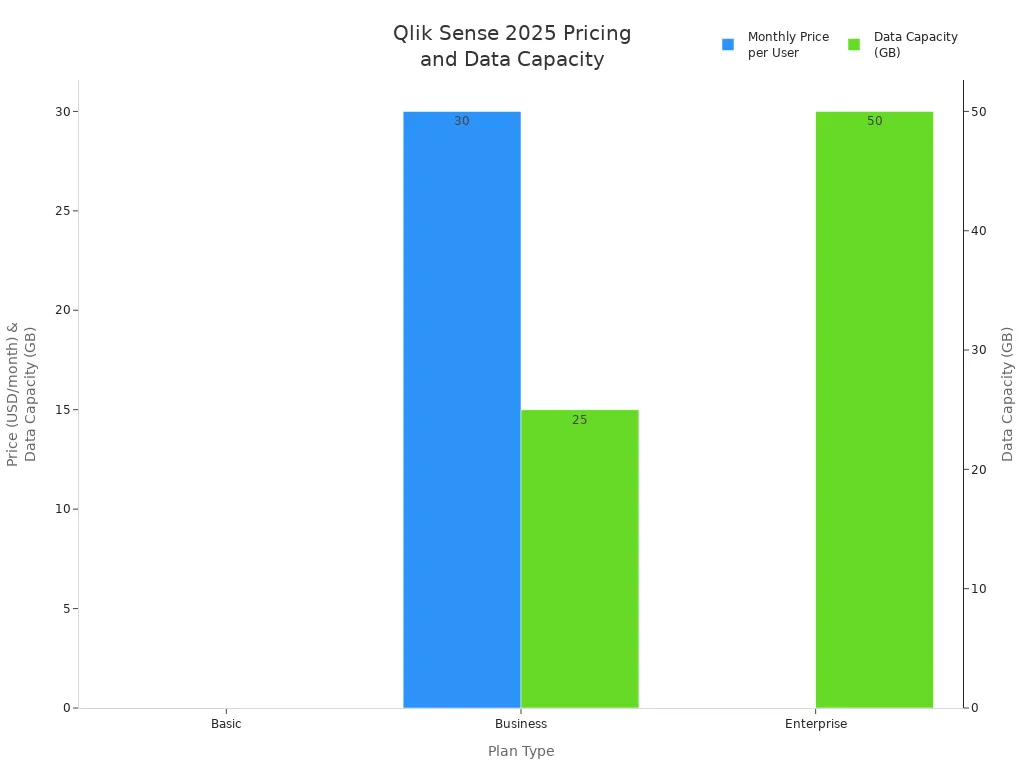
Qlik Sense stands out for interactive dashboards, conversational analytics, and flexible sharing options. It supports mobile BI and embedded analytics. High initial implementation costs and a steep learning curve may challenge some users. Qlik Sense fits organizations seeking advanced financial reporting software with strong data integration and real-time reporting.
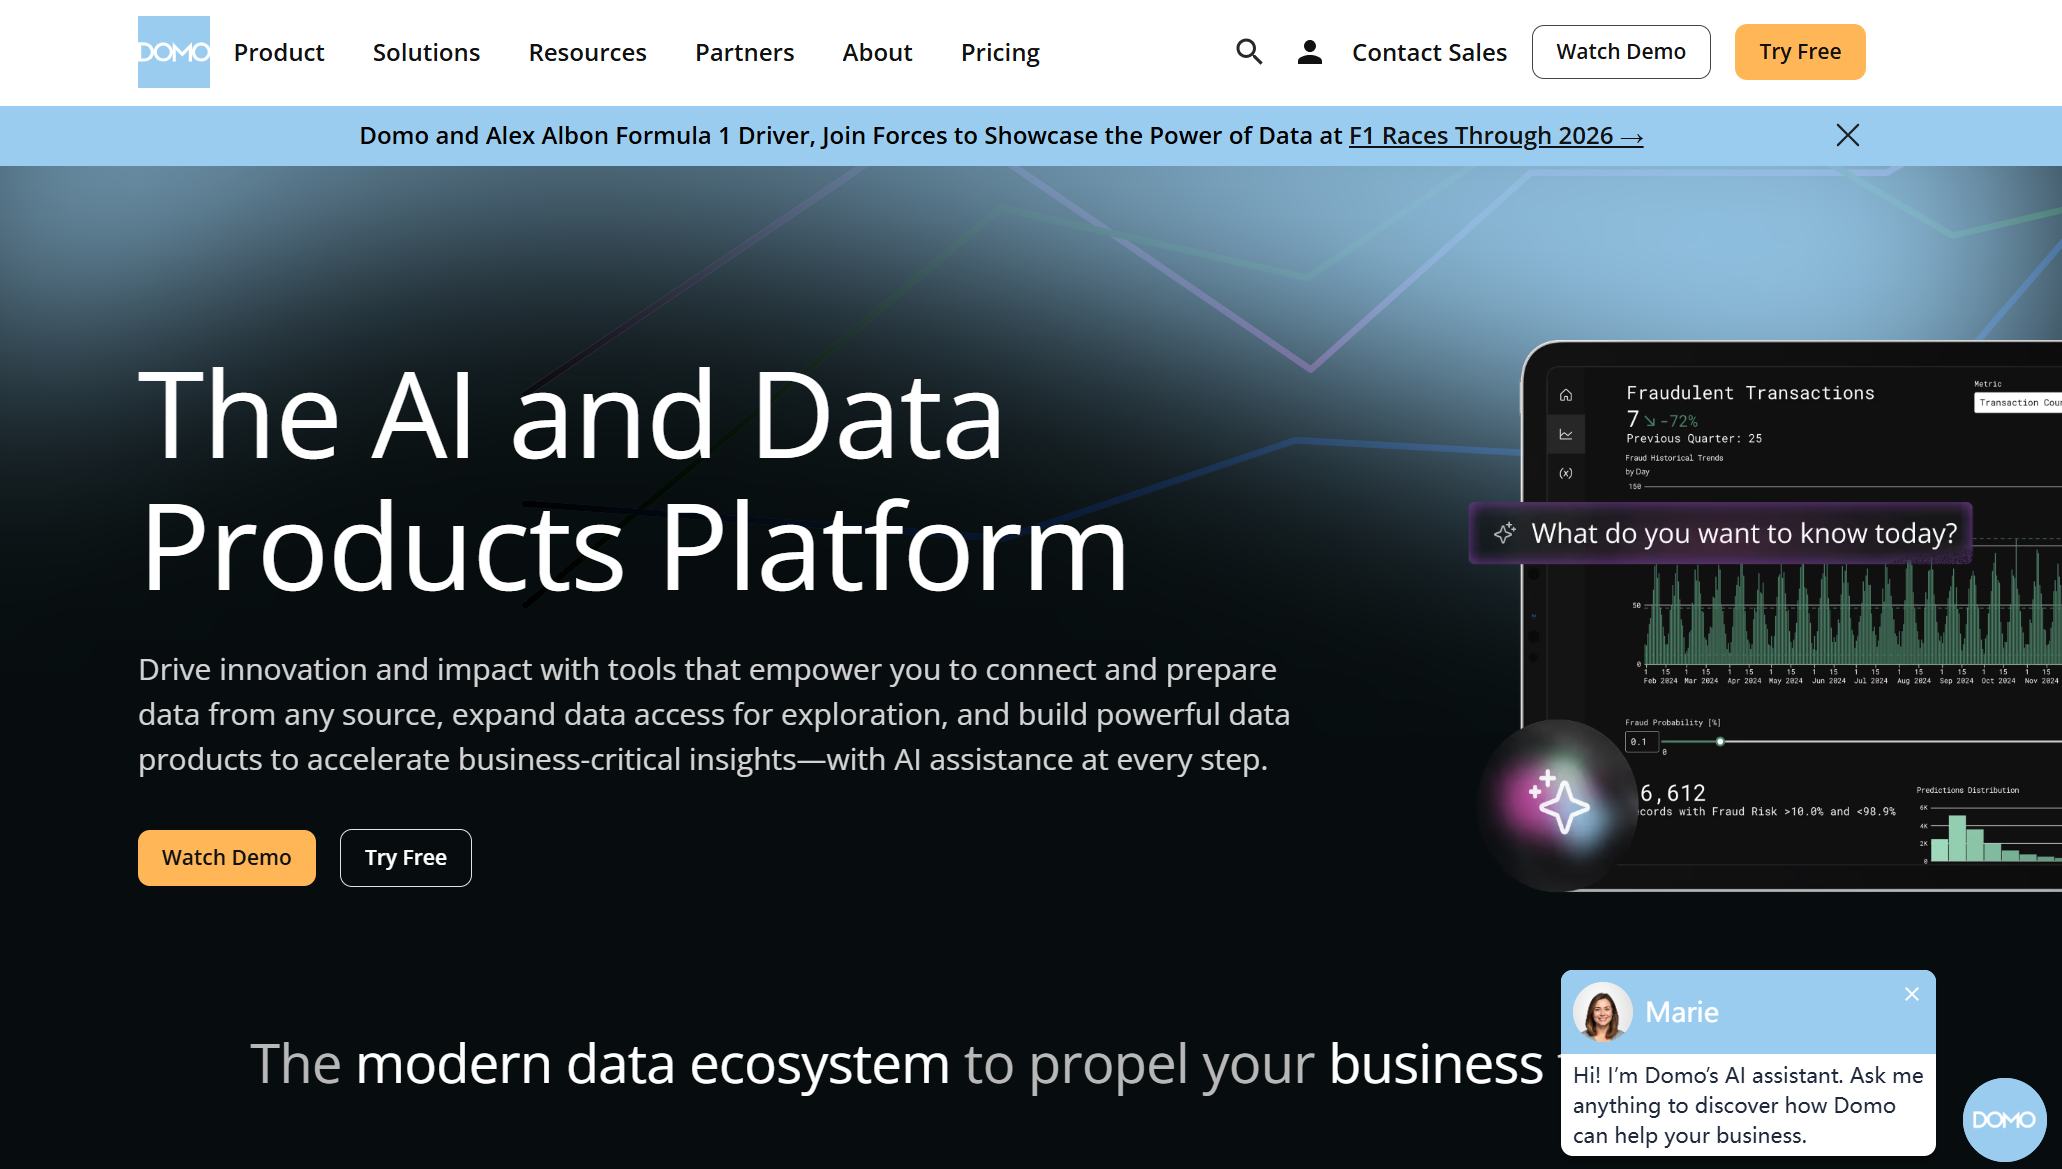
Domo provides a cloud-based financial reporting solution with beautiful, interactive dashboards and real-time data integration. The platform connects to over 1,000 data sources and supports low-code business app creation. Domo’s infrastructure ensures reliability and ongoing development.
Website: https://www.domo.com/
| Pros | Cons |
|---|---|
| Interactive dashboards, extensive integration, cloud flexibility, low-code automation, strong infrastructure | Expensive pricing, technical expertise required, mixed customer support reviews, some connector issues |
Domo is best for businesses needing real-time reporting, customizable dashboards, and robust analytics. The platform’s high cost and technical requirements may limit accessibility for smaller organizations.
Zoho Analytics offers a scalable financial reporting software solution with excellent data visualization, AI-powered insights, and strong integration with cloud applications. The platform features the intelligent assistant 'Zia', collaborative analytics, and fine-grained access control.

Website: https://www.zoho.com/analytics/
Zoho Analytics suits small to medium-sized businesses and departmental teams needing flexible financial reporting tools, customizable dashboards, and collaborative analytics.
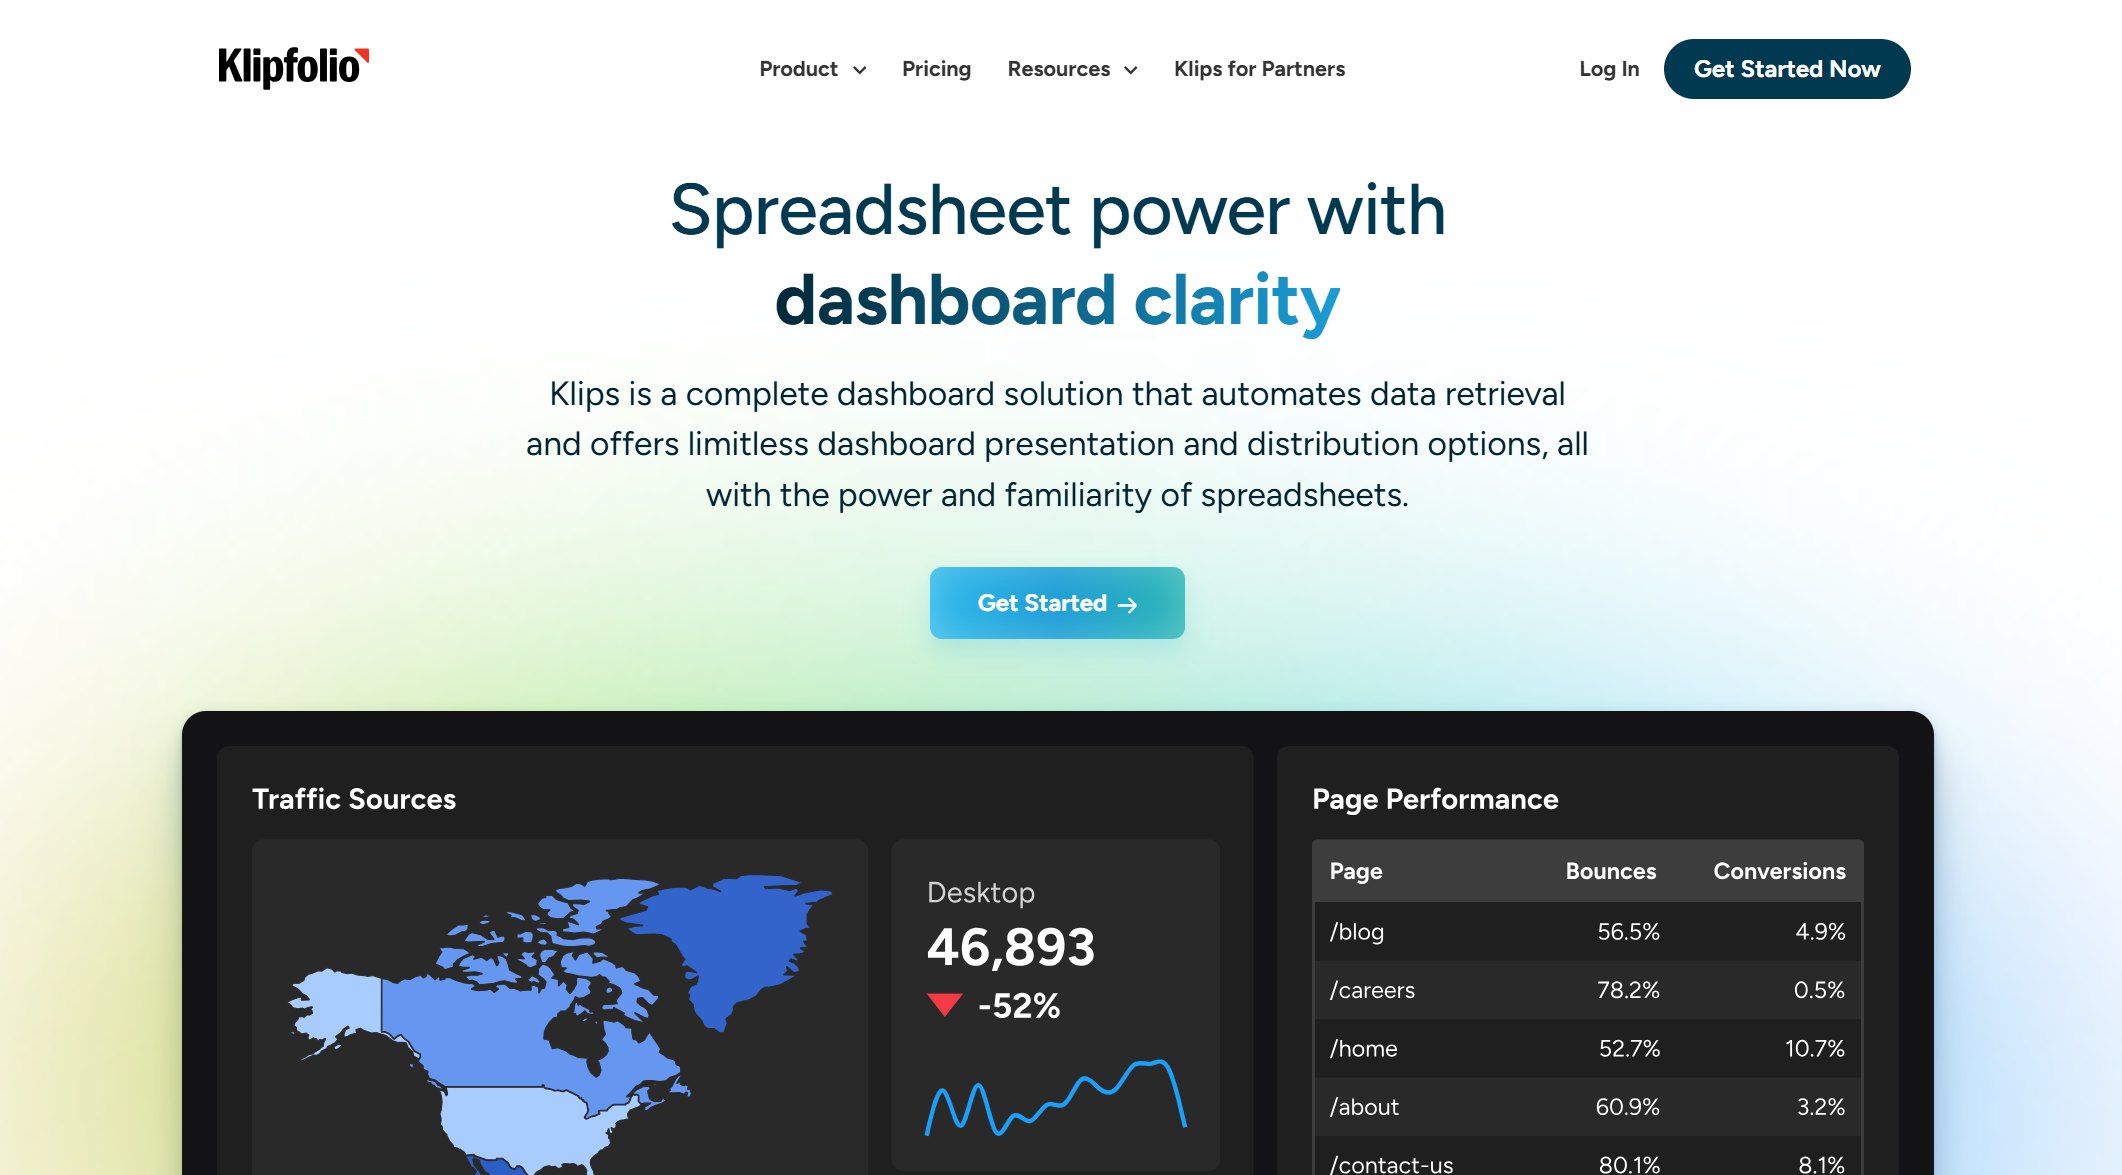
Klipfolio is a cloud-based financial reporting software platform focused on user-friendly dashboard creation and real-time data updates. The platform supports drag-and-drop dashboards, custom metric creation, and integration with a wide range of cloud services and databases.
Website: https://www.klipfolio.com/
Klipfolio offers a freemium version and paid plans starting at $56 per month (billed annually). The platform is ideal for businesses seeking easy-to-use client reporting tools, real-time reporting, and flexible integrations. Some users may experience a higher learning curve and slower performance with large datasets.
Supermetrics specializes in automating data collection from marketing platforms for financial reporting and analytics. The platform uses a modular, pay-per-destination pricing model, which can lead to higher costs as integrations scale.
Website: https://supermetrics.com/
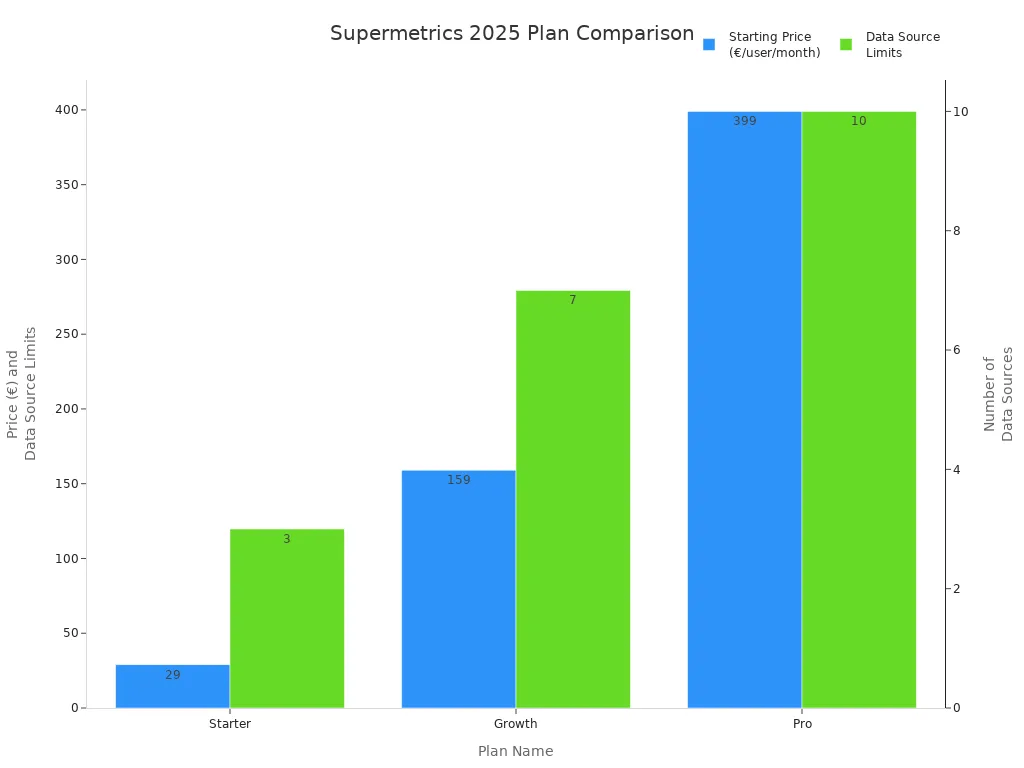
| Plan Name | Starting Price (€/user/month) | Key Features |
|---|---|---|
| Free Trial | Free (14 days) | Full platform access, export to Excel, Google Sheets, Power BI |
| Starter | €29 | One destination, up to 3 data sources, single user, weekly refresh |
| Growth | €159 | Up to 7 data sources, 2 users, daily refresh |
| Pro | €399 | One core destination, up to 10 data sources, 3 users, hourly refresh |
| Business | Custom pricing | Premium connectors, data warehouse integrations, unlimited users and sources |
Supermetrics is best for large companies and agencies managing multiple clients and accounts, needing automated client reports and financial reporting tools.
Databox delivers a cloud-based financial reporting solution with a vast library of metrics and KPIs, custom dashboards, and forecasting tools. The platform automates data collection, benchmarking, and report scheduling. Databox supports mobile access and real-time data monitoring.
Website: https://databox.com/
| Pricing Plan | Starting Price (per month) | Key Features |
|---|---|---|
| Free Plan | $0 | Basic features, limited integrations |
| Professional | $79 - $159 | Unlimited users, custom metrics, dashboards |
| Growth | $399 | Datasets, AI summaries, advanced filtering |
| Premium | $799 | Dedicated analyst, priority support, advanced security |
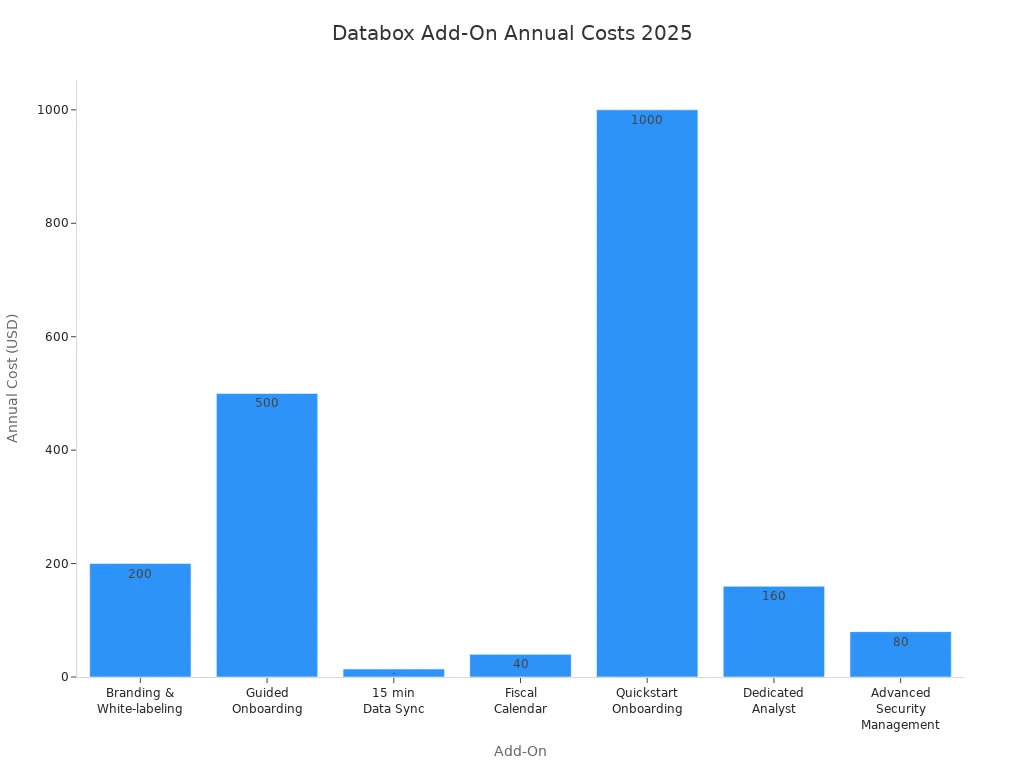
| Add-On | Description | Approximate Annual Cost (USD) |
|---|---|---|
| Branding & White-labeling | Customize account and reports | $200 |
| Guided Onboarding | Training and consulting | $500 |
| 15 min Data Sync | Faster data refresh | $14 |
| Fiscal Calendar | Align reporting with fiscal year | $40 |
| Quickstart Onboarding | Setup and training | $1000 |
| Dedicated Analyst | Ongoing support | $160 |
| Advanced Security Management | Enhanced security | $80 |
Databox is ideal for small teams and agencies needing quick access to financial metrics, real-time reporting, and customizable dashboards for client reporting.
The best reporting tools in 2025 empower organizations to manage financial data, automate client reports, and deliver actionable insights through customizable dashboards and real-time reporting. FineReport by FanRuan-en leads the way for enterprises and growing businesses seeking a comprehensive financial reporting solution.
The top reporting tools in 2025 offer a range of features that support business growth. The table below summarizes key capabilities:
| Tool | Data Integration | Custom Dashboards | Automation | Mobile BI | Advanced Visualization | Real-Time Reporting |
|---|---|---|---|---|---|---|
| FineReport | ✅ 500+ sources | ✅ | ✅ | ✅ | ✅ 3D, pixel-perfect | ✅ |
| Power BI | ✅ Microsoft | ✅ | ✅ | ✅ | ✅ | ✅ |
| Tableau | ✅ Wide | ✅ | Limited | ✅ | ✅ AI, 3D | ✅ |
| Looker Studio | ✅ | Limited | ✅ | ✅ | ✅ | |
| Qlik Sense | ✅ Broad | ✅ | ✅ | ✅ | ✅ AI/ML | ✅ |
| Domo | ✅ 1,000+ | ✅ | ✅ | ✅ | ✅ | ✅ |
| Zoho Analytics | ✅ 500+ | ✅ | ✅ | ✅ | ✅ AI-powered | ✅ |
| Klipfolio | ✅ Many | ✅ | ✅ | ✅ | ✅ | ✅ |
| Supermetrics | ✅ 60+ | ❌ | ✅ | ❌ | ❌ | ✅ |
| Databox | ✅ 130+ | ✅ | ✅ | ✅ | ✅ | ✅ |
Note: FineReport stands out with pixel-perfect reporting, multi-source integration, and advanced 3D dashboards.
Each tool brings unique strengths and some limitations. Here is a quick overview:
Pricing varies by tool and plan. The table below shows starting prices for popular options:
| Tool | Free Plan | Entry Paid Plan (per user/month) | Premium/Enterprise Pricing |
|---|---|---|---|
| FineReport | Demo | Contact Sales | Custom, based on requirements |
| Power BI | ✅ | $9.99 (Pro) | $20 (Premium), $4,995 (Capacity) |
| Tableau | ❌ | $15 (Viewer) | $75 (Creator), custom enterprise |
| Looker Studio | ✅ | $9 (Pro) | Add-ons for connectors |
| Qlik Sense | ✅ | $30 (Business) | Custom enterprise |
| Domo | ❌ | Contact Sales | Custom enterprise |
| Zoho Analytics | ✅ | $30 | Custom enterprise |
| Klipfolio | ✅ | $56 | Custom enterprise |
| Supermetrics | Free trial | €29 (Starter) | €399+ (Pro/Business) |
| Databox | ✅ | $79 (Professional) | $399+ (Growth/Premium) |
Tip: Always request a demo or trial to evaluate features and fit before making a decision.
Selecting the best reporting tools requires a clear understanding of business needs and client expectations. Companies must evaluate how each solution supports actionable insights and delivers value to both the organization and its clients.
Every business should start by identifying its core requirements. Teams must consider the types of reports needed, the volume of data, and the specific needs of each client. Some clients demand real-time dashboards, while others prefer scheduled reports. Companies should also assess integration with existing systems to ensure seamless workflows for clients. A tool that adapts to different client industries and reporting formats will provide greater flexibility.
Growth objectives shape the choice of reporting tools. Organizations planning to expand must select solutions that scale with increasing client numbers and data complexity. The right tool will support new client onboarding, handle larger datasets, and maintain performance as the client base grows. Businesses should look for features that enable actionable insights, helping clients make informed decisions as they scale.
Budget considerations play a significant role in tool selection. Companies must balance cost with the value delivered to clients. Some tools offer flexible pricing based on the number of clients or users, while others provide enterprise packages for large-scale operations. A clear budget plan ensures that the reporting solution remains sustainable as the client roster expands.
| Factor | Consideration Example |
|---|---|
| Cost Structure | Per client, per user, or flat fee |
| Value | Features that benefit each client |
| Scalability | Ability to add more clients easily |
Trying demos helps businesses understand how a tool fits their workflow and client needs. Companies should involve key stakeholders and even select clients in the demo process. Consulting with vendors provides clarity on integration, customization, and ongoing support. Reliable support ensures that clients receive timely assistance, minimizing disruptions. Strong vendor relationships help businesses deliver consistent, high-quality service to every client.
Tip: Always test reporting tools with real client data to evaluate performance and usability. Responsive support and clear documentation will empower teams to deliver actionable insights and data-driven decisions for clients.
Businesses seeking growth should prioritize reporting tools that deliver value to every client. FineReport by stands out for its scalability, integration, and user-friendly design. Each client benefits from real-time insights and customizable dashboards. The right tool helps a client track performance, automate reporting, and support decision-making. Companies must ensure that every client receives accurate data and actionable insights. A client-focused approach drives long-term success. Teams should involve the client in demos, review support options, and consult vendors. Every client deserves a solution that supports data-driven growth.

Top 10 Data Reporting Tools for Business Intelligence
10 Game-Changing Project Management Reporting Types!
The Best Open Source Reporting Tools for Your Business in 2025
Build Reporting and Visualization with Data Factory Solution

The Author
Lewis
Senior Data Analyst at FanRuan


