Looking for the best bi tools to help you make smarter decisions in 2026? Here are the top 10 picks that stand out for their innovation and impact:
- Microsoft Power BI
- Tableau
- FineBI
- Qlik Sense
- Google Looker
- SAP Analytics Cloud
- Domo
- Zoho Analytics
- ThoughtSpot
- Amazon QuickSight
You’ll notice that more companies are turning to these solutions, with the global adoption rate of bi tools among enterprises now at 26%. AI-powered and self-service platforms have changed the game. They help you get answers faster, automate routine tasks, and let you explore data on your own. This makes it easier to spot trends, predict what’s next, and act quickly—just what you need from the best bi tools in today’s fast-moving world.
Business Intelligence Tools Overview
What Are BI Tools?
You might wonder what bi tools actually do. Think of business intelligence tools as your digital assistants for making sense of data. These platforms help you collect, organize, and analyze information from different sources. With business intelligence software, you can turn raw numbers into clear reports, interactive dashboards, and easy-to-understand charts. Most modern bi tools let you drag and drop data, design custom dashboards, and even use your phone to check reports on the go.
Here’s what you can expect from today’s business intelligence tools:
- Create reports and dashboards to spot trends and patterns.
- Share insights with your team so everyone stays on the same page.
- Use real-time analytics to make decisions quickly.
- Design dashboards that fit each person’s role in your company.
- Tap into AI features for smarter, faster analysis.
Tip: Many bi tools now include features like data storytelling and augmented intelligence, making it easier for you to explain your findings to others.
Why BI Tools Matter
You need more than just data—you need answers. That’s where business intelligence tools come in. They help you see what’s happening in your business right now and predict what might happen next. When you use bi tools, you get timely and reliable information, which means you can make better decisions faster.
These tools also help you measure how well your team is doing. You can track performance, set goals, and see where you stand against competitors. Companies that use bi tools often find they gain a real edge in the market. They can spot problems early, react to changes, and stay ahead of the competition.
Note: Using business intelligence tools gives you the power to turn information into action, helping your business grow and succeed.
Benefits of Using BI Tools
Smarter Decision-Making
You want to make choices that move your business forward. With bi tools, you get access to reliable information from many sources. These platforms act like trusted advisors, turning complex data into clear answers. You can see hidden patterns and trends that help you decide what to do next. Dashboards let you compare sales, track performance, and spot problems before they grow. When you use bi tools, you can generate unlimited reports and adjust your strategy quickly. Here’s a quick look at how these tools help you make smarter decisions:
| Benefit | Description |
|---|---|
| Access to Diverse Data Sources | You can analyze information from different places all in one dashboard. |
| Real-Time Insights | You get instant updates, so you never miss a beat. |
| Interdepartmental Coordination | Teams work together better with shared dashboards and reports. |
Tip: When you have data on demand, you can act fast and stay ahead of the competition.
Enhanced Visualization
Data visualization changes the way you see your business. Instead of staring at rows of numbers, you get interactive visualizations that make everything clear. Dashboards use charts, graphs, and maps to show what’s happening right now. You can overlay marketing spend with sales revenue, combine information from different sources, and break down silos. Data visualization tools help you tell stories with your data, making it easier to share insights with your team. Research shows that visual information is processed faster and remembered longer, so your team stays informed.
- Data visualization transforms raw data into visuals you can understand and act on.
- Interactive visualizations increase transparency and help everyone see how decisions are made.
- Dashboards make it simple to adjust inventory, improve customer satisfaction, and boost revenue.
Real-Time Analytics
You need answers now, not later. Real-time analytics gives you the power to adapt to changes as they happen. Dashboards update instantly, showing you the latest trends and events. You can automate systems to respond to fast-moving situations, like supply chain disruptions or sudden spikes in demand. Real-time analytics helps you predict and prevent problems, keeping your business running smoothly.
- Real-time analytics lets you respond quickly to new opportunities or risks.
- Dashboards provide continuous updates, so you always know what’s going on.
- You can optimize business processes and improve customer satisfaction with up-to-date information.
Note: When you use bi tools with real-time analytics, you get a clear view of your business and can make decisions with confidence.
Choosing the Best BI Tools
Picking the right business intelligence tools can feel overwhelming. You want something that fits your needs, works with your data, and helps your team make better decisions. Let’s break down what you should look for when comparing options.
Ease of Use
You want a tool that feels easy from the start. Look for business intelligence software with a simple interface that helps you find answers fast. The best platforms let you create reports and dashboards without much training. They also offer interactive visuals, so you can explore your data in new ways. Here are a few things to check:
- The interface should make complex information clear.
- You should see lots of interactive and efficient visual options.
- Good training helps you and your team build your own reports.
- You should be able to answer questions quickly with an easy-to-use design.
Integration & Connectivity
Your data lives in many places. The best bi tools connect to all of them. Check if the platform supports your databases, cloud apps, and APIs. Here’s a quick table to help you compare:
| Feature | Description |
|---|---|
| Data Source Connections | Connects to hundreds of data sources, including cloud and on-prem. |
| Compatibility | Works well with SAP, Microsoft Office, and more. |
| Ease of Integration | Drag-and-drop tools make setup simple. |
| Customization | Lets you build custom reports and embed them anywhere. |
| Cloud Integration | Supports many cloud databases and warehouses. |
| API Support | Connects to lots of APIs and data sources. |
Visualization Features
You want your data to tell a story. Look for tools that offer a wide range of charts, graphs, and maps. Some platforms even use AI-powered bi tools to suggest the best visuals for your data. Here’s what matters:
| Feature | Description |
|---|---|
| Usability | Easy to learn and use for everyone. |
| Integration Capabilities | Works with your current data systems. |
| Advanced Analytics | Includes trend analysis and predictive features. |
| Customer Support | Offers help and has an active user community. |
Scalability
As your business grows, your tool should keep up. The best self-service bi tools scale to thousands of users and handle more data without slowing down.
| Feature | Description |
|---|---|
| Automated scaling | Grows with your teams and clients. |
| Change management | Makes updates easy without breaking custom setups. |
| Data warehouse flexibility | Lets you change your data warehouse without losing your dashboards. |
Collaboration
You don’t work alone. Business intelligence tools should make it easy to share dashboards, comment on reports, and work together in real time. Some cloud-based business intelligence platforms even let you sync data and chat right inside the dashboard.
- Automatic data syncing and APIs for building connectors.
- Personalized reports and dashboards for your team.
- Commenting and sharing features for easy teamwork.
Security & Compliance
You need to keep your data safe. Make sure your tool offers strong security features and follows data protection rules. Look for role-based access, encryption, and compliance with regulations.
Pricing
Every business has a budget. Pricing models vary, so compare what you get for the cost. Some tools offer free versions for small teams, while others use subscription plans based on features and users.
| Vendor | Pricing Model Description |
|---|---|
| Looker | Subscription costs depend on deployment, storage, features, and users. |
| MicroStrategy | Subscription-based, with pricing based on deployment and user needs. |
| Domo | Offers Standard, Enterprise, and Business Critical plans, all with custom pricing. |
| Power BI | Free plan, Pro at $10/user/month, Premium at $20/user/month, and variable pricing for embedded solutions. |
Tip: Always match the features you need with the price you pay. Self-service analytics and AI-powered features can boost your return on investment.
Choosing the right tool means thinking about your team, your data, and your goals. Take your time, try demos, and see which platform feels right for you.
Top 10 BI Tools for 2026
1.Microsoft Power BI
Overview
You probably know Microsoft Power BI as one of the most popular business intelligence software options out there. It stands out for its simplicity and intuitive design, making it easy for you to dive into data visualization and analytics. Power BI connects seamlessly with the Microsoft ecosystem, so if you already use Excel or Azure, you’ll feel right at home.

Website: https://www.microsoft.com/en-us/power-platform/products/power-bi
Key Features
- Seamless integration with Microsoft products like Excel and Azure
- User-friendly drag-and-drop interface
- Extensive library of ready-to-use visualizations
- Natural language query feature for intuitive data exploration
- Flexible pricing, including a free version
| Feature | Power BI | Other BI Tools |
|---|---|---|
| Integration with Microsoft Ecosystem | Yes | Varies |
| User-friendly Interface | Yes | Varies |
| Extensive Visualization Options | Yes | Varies |
| Natural Language Queries | Yes | Limited |
| Flexible Pricing | Yes | Varies |
Pros
- You can create detailed dashboards and reports quickly.
- The platform offers a wide range of data visualization options.
- Natural language queries make it easy to ask questions and get answers.
- Integration with Microsoft tools streamlines your workflow.
Cons
- Some advanced features may require premium licenses.
- Customization can be limited compared to some competitors.
2.Tableau
Overview
Tableau is a favorite among data professionals for its powerful data visualization capabilities. You can use Tableau to turn complex data into interactive dashboards that tell a story. It’s widely used across industries, from finance to healthcare, because it helps you see and understand your data in new ways.

Website: https://www.tableau.com/
Key Features
- Drag-and-drop dashboard creation
- Rich library of charts, graphs, and maps
- Real-time data connections
- Strong community and support resources
- Advanced analytics and forecasting tools
| Industry | Use Case Description |
|---|---|
| Financial Services | Better understanding of customer expectations and forecasting demand. |
| Retail and Consumer Goods | Improved operations and driving growth through data insights. |
| Healthcare | Enhanced patient care and operational efficiency using data analytics. |
Pros
- You can build interactive dashboards with ease.
- Tableau supports a wide range of data sources.
- The platform excels at data visualization and storytelling.
- Strong support for real-time analytics.
Cons
- Licensing costs can add up for larger teams.
- Some users find the learning curve steep at first.
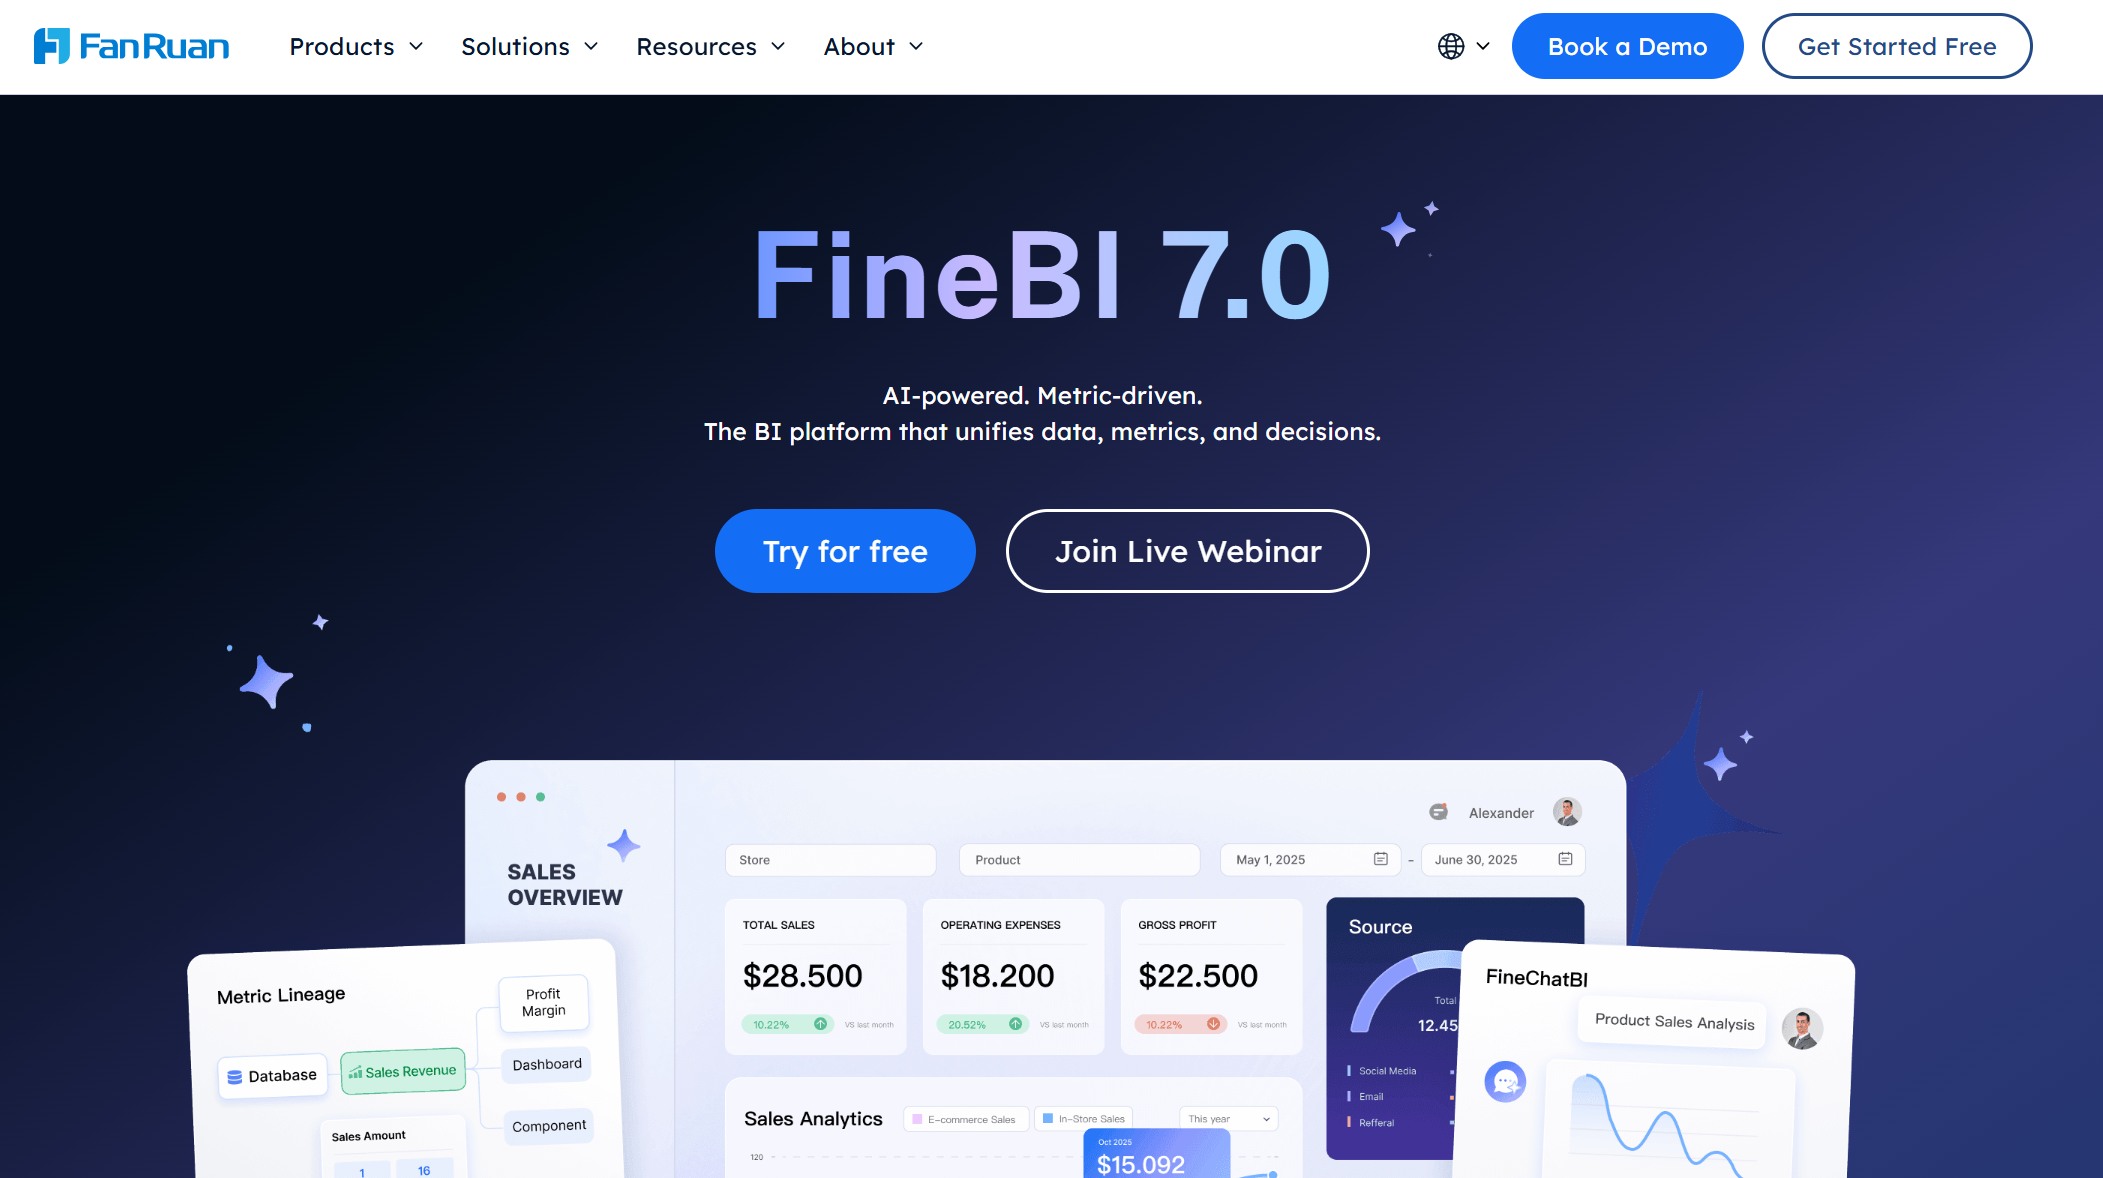
3.FineBI
Overview
FineBI is a next-generation business intelligence software designed for self-service analytics and AI-powered insights. You get a platform that empowers everyone in your organization, from business users to analysts, to create dashboards and explore data independently. FineBI stands out for its intuitive interface, robust data integration, and enterprise-grade governance.
Website: https://www.fanruan.com/en/finebi
Key Features
| Feature | Description |
|---|---|
| AI-assisted insights | Uses AI to surface insights you might miss on your own. |
| Natural language processing | Lets you ask questions in plain language and get instant answers. |
| Flexible self-service dashboards | Allows you to build and customize dashboards without technical skills. |
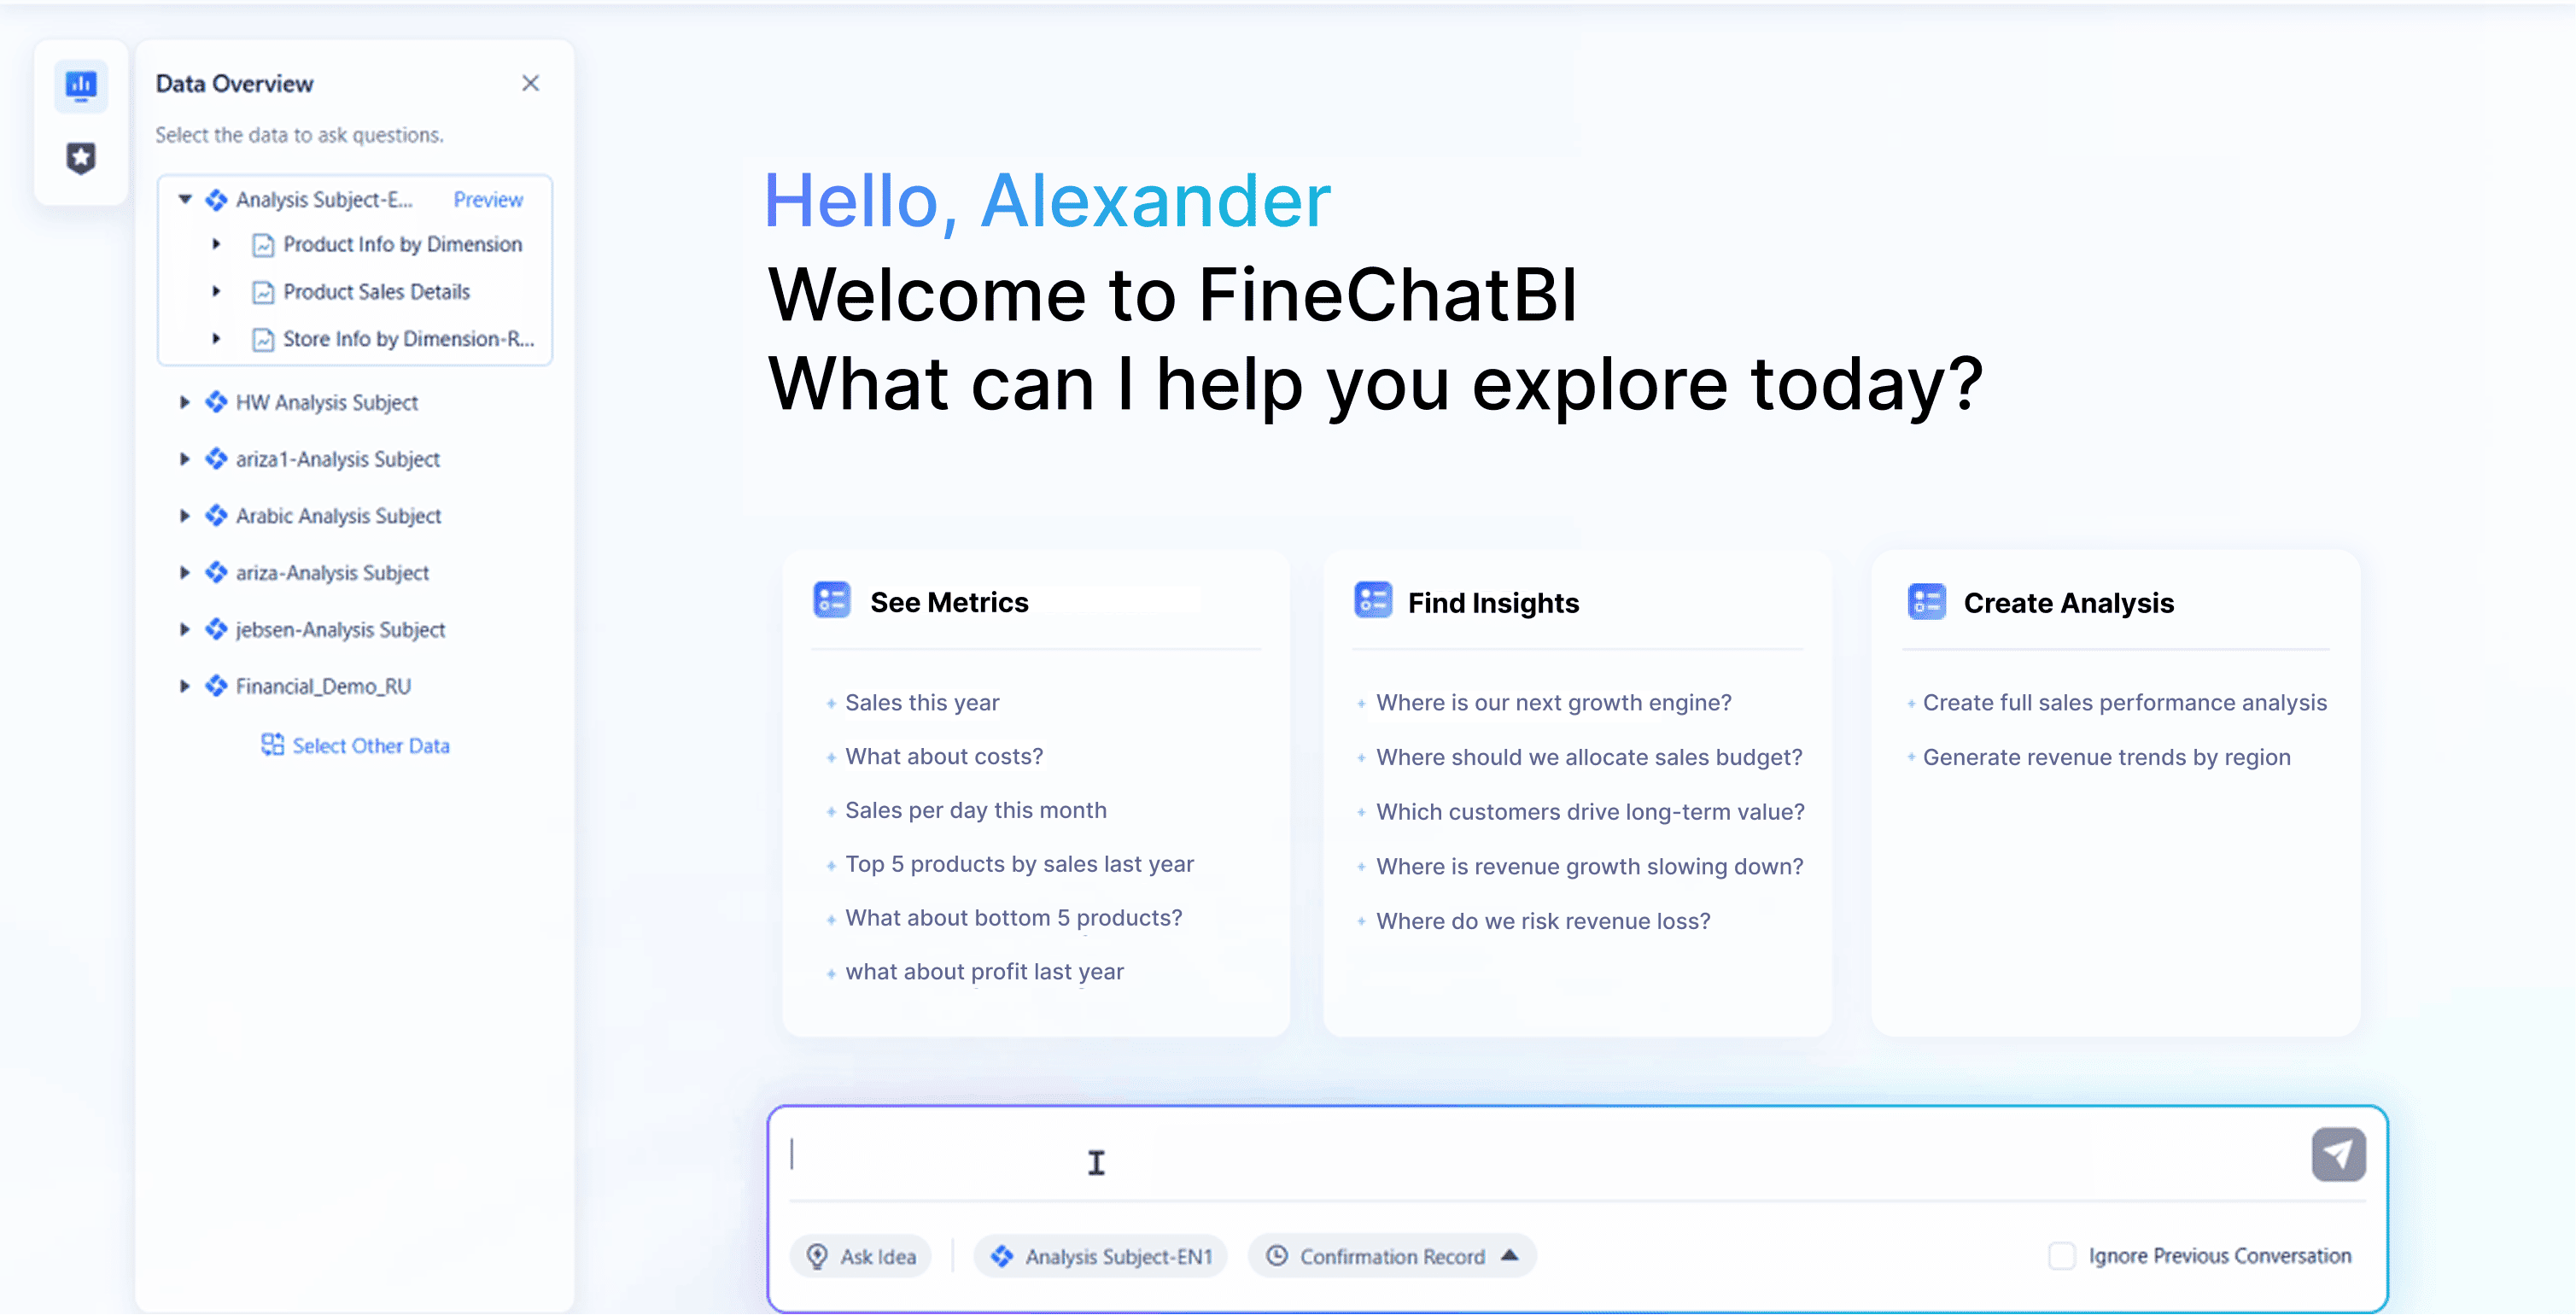
| FineChatBI | Enables conversational analytics for fast, interactive data exploration. |
| Real-time data integration | Connects to 60+ data sources, including big data, cloud, and APIs. |
| Enterprise-grade security | Offers role-based access, audit trails, and compliance features. |
| Advanced data visualization | Provides over 60 chart types and 70 styles for rich, interactive dashboards. |
| Collaborative features | Lets teams share, comment, and work together on dashboards. |
Pros
- You can create dashboards with drag-and-drop simplicity.
- AI-powered analytics and FineChatBI make data accessible for everyone.
- Real-time data integration keeps your dashboards up to date.
- Enterprise-grade security ensures your data stays protected.
- FineBI supports massive datasets and thousands of users at once.
- The platform offers flexible ETL/ELT for data preparation.
- You get a wide variety of data visualization options for every scenario.
- Collaboration tools help your team work smarter together.
Use Cases
FineBI shines across industries and business scenarios. Here are a few ways you can use it:
- Financial Services: UnionPay Data Services used FineBI to unify fragmented data, boosting system efficiency by 5% and improving customer value identification to 90%. Their teams now use dashboards for real-time credit card analytics and precise marketing.
- Manufacturing: Companies like A.O. Smith and Danfoss rely on FineBI for smart manufacturing, safety management, and real-time analysis. Dashboards help them monitor production, optimize supply chains, and improve quality control.
- Retail: FineBI enables retailers to track sales, manage inventory, and analyze customer behavior—all from interactive dashboards.
- Healthcare: Hospitals use FineBI to integrate clinical and operational data, improving patient care and resource allocation.
- Public Sector: Organizations leverage FineBI for unified data management, compliance, and transparent reporting.

Tip: FineBI’s self-service and AI-powered analytics help you reduce time-to-insight by 70%, making it one of the best bi tools for fast, informed decisions.

4.Qlik Sense
Overview
Qlik Sense is a modern business intelligence platform that focuses on interactive data visualization and associative analytics. You can explore your data freely, uncovering connections and trends that traditional tools might miss. Qlik Sense is popular in industries like healthcare and manufacturing for its operational analytics and quality control features.

Website: https://www.qlik.com/us/products/qlik-sense
Key Features
- Associative data engine for flexible exploration
- Drag-and-drop dashboard creation
- Real-time data updates
- Advanced analytics and predictive modeling
- Strong support for mobile and embedded analytics
| Industry | Application Areas |
|---|---|
| Healthcare | Operational analytics, quality control |
| Manufacturing | Operational analytics, quality control |
Pros
- You can explore data from multiple sources in one place.
- The associative engine helps you find hidden insights.
- Dashboards update in real time for up-to-date analysis.
- Qlik Sense supports a wide range of data visualization options.
Cons
- Some advanced features may require additional setup.
- Custom scripting can be complex for beginners.
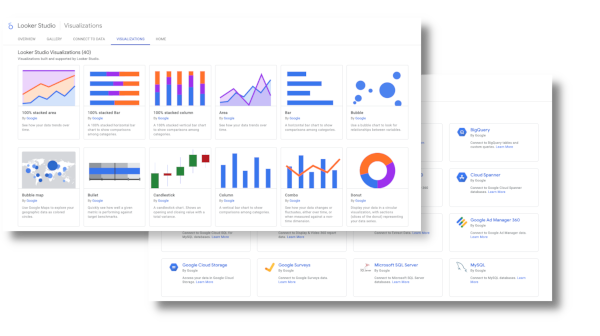
5.Google Looker
Overview
Google Looker is a cloud-based business intelligence tool that integrates tightly with Google Cloud services. You can use Looker to analyze data at scale, build dashboards, and leverage machine learning—all within the Google ecosystem.
Website: https://lookerstudio.google.com/navigation/reporting
Key Features
- Native integration with BigQuery for fast analytics
- Machine learning capabilities with Vertex AI
- Automation using Cloud Functions
- File-based ingestion and export with Google Cloud Storage
- Customizable dashboards and data models
- Looker integrates with BigQuery for fast SQL analytics.
- It utilizes Vertex AI for machine learning capabilities.
- Cloud Functions are employed for automation tasks.
- Looker connects with Google Cloud Storage (GCS) for file-based ingestion and data export.
Pros
- You can analyze massive datasets quickly.
- Looker’s integration with Google Cloud makes it easy to scale.
- The platform supports advanced analytics and automation.
- Dashboards are highly customizable and interactive.
Cons
- Pricing can be complex for smaller teams.
- Some features require Google Cloud expertise.
6.SAP Analytics Cloud
Overview
SAP Analytics Cloud brings analytics and planning together in a single cloud solution. You can move from insights to action without switching platforms. This tool is ideal for organizations that need strong data governance and advanced predictive analytics.
Website: https://www.sap.com/products/data-cloud/cloud-analytics.html
Key Features
| Key Differentiators | Description |
|---|---|
| Integration of Analytics and Planning | Combines analytics and planning in one platform for seamless transitions. |
| Advanced Predictive Analytics | Forecasts trends and optimizes resource allocation. |
| Strong Data Governance Features | Ensures data integrity and compliance for sensitive information. |
- Deep integration with SAP solutions
- Scenario simulation for better business outcomes
- Automatic plan generation from predictions
Pros
- You can plan, analyze, and act all in one place.
- Predictive analytics help you stay ahead of trends.
- Strong data governance keeps your information secure.
- Dashboards support real-time collaboration and reporting.
Cons
- Some features may require SAP ecosystem familiarity.
- Pricing can be higher for smaller organizations.
7.Domo
Overview
Domo is a cloud-native business intelligence platform built for real-time data access and collaboration. You can connect to over 1,000 apps and data sources, making it easy to bring all your information together. Domo’s mobile-first design ensures you always have access to your dashboards, wherever you go.
Website: https://www.domo.com/
Key Features
| Feature | Description |
|---|---|
| Real-time data access | Quick data fetching for analysis and visualization. |
| Outstanding integrations | Over 1,000 integrations with various apps and data sources. |
| User-friendly interface | Intuitive UI/UX that is easy for both internal teams and end-users. |
| Customizable dashboards | Users can create dashboards without needing tutorials. |
| Mobile-first design | Access data on the go using various devices. |
| Collaboration features | Teams can work together and create workflows for data analysis. |
| AI and machine learning | Features for natural language processing, data forecasting, and pattern recognition. |
| Pre-built apps and templates | A variety of workflows and templates available to inspire users. |
Pros
- You can access real-time data for faster decisions.
- Domo’s integrations make data collection simple.
- The interface is easy to use, even for beginners.
- Customizable dashboards let you tailor insights to your needs.
- Mobile access keeps you connected anywhere.
- Collaboration features streamline teamwork.
- AI tools provide advanced analytics and forecasting.
- Pre-built templates save you time.
Cons
- Advanced analytics may require additional setup.
- Pricing is customized and may vary by organization size.
8.Zoho Analytics
Overview
Zoho Analytics is a self-service business intelligence tool designed for small and medium-sized enterprises. You can blend data from multiple sources, create visual dashboards, and use AI-powered analytics to make smarter decisions.

Website: https://www.zoho.com/analytics/
Key Features
| Feature | Benefit |
|---|---|
| Self-service analytics | Empowers users to analyze data without needing extensive technical expertise. |
| Data integration | Combines data from various sources for comprehensive insights. |
| Visualization tools | Provides visual dashboards that enhance understanding of data trends and patterns. |
| Augmented analytics | Offers automated insights and predictions to support timely decision-making. |
| Pre-built reports | Saves time and resources by providing ready-to-use reports for quick analysis. |
| Cross-functional analytics | Delivers a 360-degree view of the business by blending data from different applications. |
| Data preparation and management | Ensures high-quality data for analysis through cleansing and transformation capabilities. |
| Conversational AI (Ask Zia) | Allows users to gain insights through natural language queries, making data access easier. |
| Automated contextual insights | Provides narratives that help in understanding data in context, enhancing decision-making. |
Pros
- You can analyze data without technical skills.
- Zoho Analytics blends data from many sources.
- Dashboards are easy to build and customize.
- Augmented analytics delivers automated insights.
- Pre-built reports help you get started fast.
- Conversational AI makes data access simple.
Cons
- Some advanced features may require higher-tier plans.
- Integration with certain third-party apps may need setup.
9.ThoughtSpot
Overview
ThoughtSpot is an innovative business intelligence platform that puts AI-powered analytics and natural language querying at your fingertips. You can ask questions in plain English and get instant answers, making data exploration easy for everyone.

Website: https://www.thoughtspot.com/
Key Features
| Feature | ThoughtSpot | Other BI Tools |
|---|---|---|
| AI-powered analytics | Yes | Varies |
| Natural language querying | Yes | Limited |
| Embedded analytics | Yes | Varies |
- AI-powered analytics capabilities
- Natural language querying
- Embedded analytics functionalities
Pros
- You can use AI to uncover insights quickly.
- Natural language queries make data exploration simple.
- Embedded analytics let you bring insights into any app.
- Dashboards are interactive and easy to share.
Cons
- Some features may require additional configuration.
- Pricing varies based on deployment.
10.Amazon QuickSight
Overview
Amazon QuickSight is a cloud-based business intelligence tool built on AWS infrastructure. You can scale from a handful of users to tens of thousands without worrying about servers or maintenance. QuickSight is fully managed and serverless, so you focus on building dashboards and analyzing data.
Website: https://aws.amazon.com/quicksuite/quicksight/
Key Features
- Fully managed, serverless platform
- Scales automatically to meet user demand
- Integrates with AWS data sources and services
- Real-time analytics and data visualization
- Pay-per-session pricing for cost efficiency
- Amazon QuickSight is fully managed, eliminating the need for users to manage infrastructure.
- It handles scaling internally to meet end-user demands.
- Users can grow their data from hundreds of megabytes to terabytes seamlessly.
- The service automatically scales to meet user demands.
Pros
- You can scale analytics effortlessly as your business grows.
- QuickSight integrates with AWS for seamless data access.
- Dashboards update in real time for up-to-date insights.
- Pay-per-session pricing keeps costs predictable.
Cons
- Some advanced features may require AWS expertise.
- Customization options may differ from other platforms.
Note: With so many options, you can find the best bi tools for your needs—whether you want self-service analytics, AI-powered insights, or enterprise-grade dashboards. Each platform brings unique strengths to the table, helping you unlock the full power of data visualization and smarter decision-making.
AI-Powered BI Tools in 2026

Key Trends
You might notice that ai-powered bi tools are changing how you work with data. These tools bring new trends that make analytics easier and more powerful for everyone. Here are some of the biggest trends you’ll see in 2025:
- More people want to use data, even if they aren’t experts. Data democratization is on the rise.
- You can now run advanced, detailed analyses with less effort than ever before.
- Getting insights and sharing them happens much faster.
- You can customize your analytics to fit your industry or business needs.
- Tools are easier to use, so anyone can explore data without special training.
- Handling large datasets is simple because these tools scale up as you grow.
- AI is transforming business practices, making analytics smarter and more efficient.
- Reporting gets easier and faster with the help of ai-powered bi tools.
Tip: If you want to stay ahead, keep an eye on how ai-powered bi tools are making analytics more accessible and flexible.
Benefits of AI Integration
When you use ai-powered bi tools, you unlock a whole new level of business intelligence. These tools do more than just crunch numbers—they help you see patterns, predict trends, and make better decisions. Here’s a quick look at how AI integration boosts your analytics:
| Benefit | Description |
|---|---|
| Automating data processing | AI handles complex data, finding trends you might miss. |
| Accessibility for non-technical users | You can ask questions in plain language and get answers, no coding needed. |
| Enhanced forecasting accuracy | AI spots patterns, so your predictions about customers and markets get sharper. |
| Rapid response to market changes | You react quickly because AI processes data fast. |
| Consistency in decision-making | AI gives you reliable analysis, so your choices stay steady. |
| Reducing human error | AI works with high precision, cutting down on mistakes. |
| Broad business needs support | AI helps with everything from automating tasks to engaging customers. |
| Enhancing competitive advantage | AI insights help you invest smarter and create better experiences for your customers. |
You don’t have to be a data scientist to get value from ai-powered bi tools. These platforms make it easy for you to find answers, act quickly, and keep your business moving forward. If you want to get the most out of your data, now is the time to explore what ai-powered bi tools can do.
Self-Service BI Tools for Business Users
Empowering Non-Technical Teams
You don’t need to be a data expert to get value from self-service bi tools. These platforms put the power of analytics right in your hands. With easy-to-use dashboards and drag-and-drop features, you can explore data, create reports, and find answers without waiting for IT. This means you can make decisions faster and feel more confident about your choices.
Self-service business intelligence empowers business users to independently explore data, generate insights, and create reports via user-friendly tools.
Let’s look at how self-service bi tools help non-technical teams:
| Benefit | Description |
|---|---|
| Simplified Data Analysis | Non-technical teams can analyze data easily, enabling quicker decision-making and greater collaboration across departments. |
| Self-Service Analytics | Users can explore and visualize data without needing IT assistance. |
| Real-Time Decision Making | Access to data in real time allows for quick and confident actions. |
| Engagement with Outcomes | Non-technical staff become more engaged with business outcomes when they can explore data independently. |
| Democratized Data Access | Empowers business users to independently explore data, generate insights, and create reports. |
| Evidence-Based Decisions | Establishes a data-driven culture where everyone can make informed decisions. |
You get to ask your own questions and see the results right away. This boosts your engagement and helps your team work together better.
Collaboration & Accessibility
Self-service bi tools make teamwork simple. You can share dashboards, comment on reports, and work with others in real time. Everyone stays on the same page, no matter where they are. These tools also work on different devices, so you can check your data at your desk or on your phone.
- Non-technical staff can explore data independently.
- Increased engagement with business outcomes.
- Enhanced collaboration across departments.
You don’t have to wait for someone else to pull a report. You can access the information you need, when you need it. This makes your team more agile and helps you respond quickly to changes. With self-service bi tools, you build a culture where everyone uses data to make smart choices. That’s how you turn information into action and keep your business moving forward with the best bi tools available.
FanRuan Solutions & Customer Success
Industry Solutions
You want a solution that fits your business. FanRuan gives you a full suite of bi tools for every industry. FineBI and FineDataLink help you connect, clean, and analyze data from many sources. You can build dashboards, track KPIs, and share insights with your team. These tools work for manufacturing, retail, healthcare, finance, and more. You get real-time analytics and easy data integration, so you can make smart choices fast.

FanRuan has helped over 30,000 clients in more than 20 industries. Companies use these solutions to improve decision-making and drive growth.
Here’s a quick look at how FanRuan supports different industries:
| Industry | Description |
|---|---|
| Manufacturing | Monitor production, optimize supply chains, and improve safety management. |
| Retail | Track sales, manage inventory, and analyze customer behavior. |
| Healthcare | Integrate clinical and operational data for better patient care. |
| Finance | Analyze risk, boost customer engagement, and support digital banking. |
| Public Sector | Manage compliance, unify data, and improve reporting. |
Customer Stories
You might wonder how these solutions work in real life. Many companies have seen big changes after using FanRuan. For example, UnionPay Data Services used FineBI to unify their data and boost system efficiency by 5%. They improved customer value identification to 90%. Bifido Foods used FanRuan to connect data from different sales channels and product lines. They built interactive reports and made faster decisions.
- You can create, analyze, and display reports with FineBI.
- Business teams run their own BI analysis without waiting for IT.
- Managers adjust dashboards and indicators to fit their needs.

By mastering FineBI, you can build dynamic dashboards that help your business act on insights in real time. These tools make analytics simple and powerful for everyone.
Quick Comparison Table
You have seen a lot of details about each BI tool. Sometimes, you just want a quick way to compare them side by side. This table gives you a snapshot of what each platform offers. Use it to spot the features that matter most to you.
| BI Tool | Self-Service | AI-Powered | Data Integration | Visualization | Scalability | Collaboration | Security & Compliance |
|---|---|---|---|---|---|---|---|
| Power BI | ✅ | ✅ | ✅ | ✅ | ✅ | ✅ | ✅ |
| Tableau | ✅ | ✅ | ✅ | ✅ | ✅ | ✅ | ✅ |
| FineBI | ✅ | ✅ | ✅ | ✅ | ✅ | ✅ | ✅ |
| Qlik Sense | ✅ | ✅ | ✅ | ✅ | ✅ | ✅ | ✅ |
| Looker | ✅ | ✅ | ✅ | ✅ | ✅ | ✅ | ✅ |
| SAP Analytics | ✅ | ✅ | ✅ | ✅ | ✅ | ✅ | ✅ |
| Domo | ✅ | ✅ | ✅ | ✅ | ✅ | ✅ | ✅ |
| Zoho Analytics | ✅ | ✅ | ✅ | ✅ | ✅ | ✅ | ✅ |
| ThoughtSpot | ✅ | ✅ | ✅ | ✅ | ✅ | ✅ | ✅ |
| QuickSight | ✅ | ✅ | ✅ | ✅ | ✅ | ✅ | ✅ |
Tip: Every tool in this list checks all the boxes for core features. What sets them apart is how easy they are to use, how well they fit your business, and the extra touches like AI chat or mobile dashboards.
When you look at this table, ask yourself:
- Which features do you need every day?
- Do you want more AI help or stronger self-service?
- How important is real-time data or mobile access for your team?
You can use this table as a starting point. Try out demos or free trials. See which tool feels right for you and your team. The best BI tool is the one that helps you work smarter, not harder.
Final Tips for Selecting BI Tools
Choosing the right analytics platform can feel like a big decision, but you can make it easier with a few smart moves. Start by thinking about your team’s daily needs. What problems do you want to solve? Which features matter most to you? Write down your must-haves and nice-to-haves. This list will help you stay focused when you compare options.
Try out free trials or demos whenever possible. You get a real feel for how each tool works. Invite your team to test them, too. Sometimes, a platform looks great on paper but feels clunky in practice. Pay attention to how easy it is to connect your data, build dashboards, and share insights.
Tip: Ask yourself, “Can I answer my business questions quickly with this tool?” If the answer is yes, you’re on the right track.
Don’t forget about support and training. Good customer service can save you time and frustration. Look for platforms with active user communities, helpful tutorials, and responsive support teams.
Here’s a quick checklist to guide your final decision:
- Does the tool fit your budget?
- Can you scale as your business grows?
- Is your data secure and compliant?
- Will your team actually use it?
- Does it work well with your current systems?
You want a solution that grows with you, not one you’ll outgrow in a year. The best bi tools help you turn data into action, making your work easier and your decisions smarter. Take your time, ask questions, and trust your instincts. You’ll find the right fit for your business.
Choosing the right bi tools can change how you run your business in 2025. You get faster answers, better teamwork, and smarter decisions. AI-powered and self-service platforms like FanRuan FineBI help you unlock real value from your data. Want to get started? List your needs, try out a few demos, and talk with your team. You’ll find the best fit for your goals.


FAQ

The Author
Lewis
Senior Data Analyst at FanRuan
Related Articles

Environmental Reporting Software Comparison: ESG Platforms vs BI Reporting Tools for Enterprise Teams
Environmental $1 helps enterprises collect, manage, analyze, and present environmental data such as emissions, energy, water, waste, and related sustainability metrics. If you are evaluating this category, you are likely
Yida Yin
Jul 02, 2026

Best Ad Hoc Reporting Tools in 2026: Pros, Cons, Pricing, and Best Use Cases
$1 tools are designed to help business users answer specific questions on demand instead of waiting for a scheduled report or a custom build from IT. If your team needs to quickly check why sales dipped, compare regional
Yida Yin
Jul 02, 2026

Best KPI Reporting Software for 2026: 10 Tools Compared for Dashboards, Reports, and KPI Tracking
If you are searching for kpi $1 , you are likely trying to solve one of three problems: you need a better way to track business performance, you want clearer dashboards and reports for stakeholders, or you need a platfor
Yida Yin
Jun 29, 2026