Looking for the best free BI tools to power your business in 2025? You have many choices when searching for the best free BI tools. Here are the top 10 open-source business intelligence and data visualization tools for 2025:
These open-source business intelligence platforms offer strong data visualizations, interactive dashboards, and flexible freemium plan options. Many users rate Microsoft Power BI and FineBI as top picks for their user-friendly design and advanced features.
Recent reports show that 90% of companies using AI in the best business intelligence tool make decisions faster and cut operational costs by 20%.
| Metric | Value/Insight | Year/Source |
|---|---|---|
| BI adoption impact | 27% faster decision-making | TechJury, 2025 |
| Employees using BI | 26% in 2025 | TechJury, 2025 |
Explore which business intelligence tools match your needs and goals.
Business intelligence tools help you collect, manage, and analyze your company’s data. These tools focus on turning historical data into actionable insights. You can use business intelligence software to monitor real-time operations, create dashboards, and generate reports. Many tools also support benchmarking, performance management, and data mining. They often work with data stored in data warehouses or data marts, making it easier to spot trends and improve business processes.
Here are the main criteria that define the best free business intelligence tools in 2025:
| Criteria Category | Description |
|---|---|
| User Interface (UI) | Clean, easy to navigate interface for quick access to features. |
| Usability | Simple onboarding and ease of use for all team members. |
| Integration | Connects with popular apps and software for smooth workflows. |
| Value for Cost | Delivers strong benefits without high expenses. |
| Data Discovery | Helps you find patterns and inconsistencies in your data. |
| Real-time Analytics | Organizes and analyzes data instantly for timely insights. |
| Data Visualization | Lets you create charts and graphs to present information clearly. |
| Adaptable Dashboards | Customizable dashboards to track key metrics. |
| Notifications | Sends alerts when important data changes happen. |
Business intelligence tools stand out from other data analytics solutions because they focus on descriptive analytics and improving business operations. While other data analytics tools may handle raw or unstructured data, BI tools help you understand past events and make data-driven decisions for your company’s future.
You need business intelligence tools to make data-driven decision-making part of your daily routine. These tools give you real-time visibility into your operations. For example, a large retailer used BI dashboards to spot a drop in winter jacket sales. The company quickly launched a new collection and adjusted marketing, which led to a 22% increase in sales and less unsold inventory.
Business intelligence software improves decision-making by providing clear, data-driven insights. You can automate reports, enhance forecasting, and identify risks or opportunities faster. BI tools help you avoid mistakes like relying only on gut feelings or missing early warning signs in your data.
Tip: Using business intelligence tools can boost productivity, improve forecasting, and help you respond quickly to market changes.
Research shows that integrating business intelligence software with your existing systems increases reliability and performance. BI also supports organizational learning and innovation, which leads to better business outcomes over time. When you use data visualization and data analytics, you empower your team to make smarter, data-driven decisions every day.
You want to know what makes each tool unique. The table below shows user ratings and highlights for some of the most popular open-source business intelligence and data visualization tools in 2025:
| Tool Name | User Rating | Key Features and Notes | Freemium Plan Details |
|---|---|---|---|
| Microsoft Power BI | 5.0 | User-friendly, real-time data, interactive dashboards, strong visualizations | 60-day free trial, paid plan |
| FineBI | 4.9 | Self-service analytics, open-source, interactive dashboards, enterprise-grade | Free community edition |
| Metabase | 4.8 | Open-source, easy setup, interactive dashboards, data visualizations | Free and paid plans |
| Apache Superset | 4.7 | Open-source, advanced data visualizations, flexible integrations | Free, open-source |
| KNIME | 4.7 | Open-source, workflow automation, strong data reporting tools | Free, open-source |
| Lightdash | 4.6 | Open-source, modern data visualizations, interactive dashboards | Free and paid plans |
| Redash | 4.6 | Open-source, query editor, interactive dashboards, data visualizations | Free and paid plans |
| Jaspersoft Community Ed. | 4.5 | Open-source, customizable reports, data reporting tools | Free community edition |
| BIRT | 4.5 | Open-source, strong data visualizations, flexible reporting | Free, open-source |
| Looker Studio | 4.5 | Cloud-based, interactive dashboards, easy data visualizations | Free, Google account needed |
You can use these open-source business intelligence tools to create interactive dashboards, automate data reporting tools, and share data visualizations across your team. Many of these platforms support a freemium plan, so you can start with no cost and scale as your needs grow. Open-source options like Metabase, Apache Superset, and KNIME give you flexibility and control. FineBI stands out for its self-service analytics and enterprise features, while Microsoft Power BI leads in user ratings and ease of use.

When you compare business intelligence tools, you want to see how each one fits your needs. The table below gives you a quick look at the main features, strengths, and limitations of the top free and open-source business intelligence tools in 2025.
| Tool Name | Key Features | Strengths | Limitations |
|---|---|---|---|
| FineBI | Self-service analytics, real-time data, drag-and-drop dashboards | Enterprise-grade, easy for all users, strong data integration | Advanced features may require learning time |
| Power BI | AI-powered dashboards, Microsoft integration, drag-and-drop | Affordable, great for Microsoft users, strong AI | Weak NoSQL support, Windows-only authoring |
| Metabase | Open-source, interactive dashboards, easy setup | Simple to use, quick deployment | Limited advanced analytics |
| Apache Superset | Open-source, advanced visualizations | Flexible, supports many data sources | Steeper learning curve |
| KNIME | Open-source, workflow automation | Strong data processing, visual workflows | Interface can feel complex |
| Lightdash | Open-source, modern dashboards | Fast, good for dbt users | Fewer integrations than others |
| Redash | Open-source, SQL query editor | Great for SQL users, easy sharing | Basic visualization options |
| Jaspersoft CE | Open-source, customizable reports | Flexible reporting, strong export options | Setup can be technical |
| BIRT | Open-source, flexible reporting | Good for developers, strong customization | Not as user-friendly for beginners |
| Looker Studio | Cloud-based, interactive dashboards | Easy for Google users, free to start | Limited data source support |
You can see that open-source business intelligence tools give you flexibility and control. FineBI stands out for its self-service analytics and enterprise features, while Power BI is best for those already using Microsoft products.
You will find that each business intelligence software has its own strengths and weaknesses. FineBI gives you a user-friendly experience with enterprise-level data integration. You can connect to many data sources and create dashboards without coding. Power BI offers strong AI features and works well if you use Microsoft 365 or Azure. However, it does not support NoSQL databases well and only lets you author reports on Windows.
Open-source business intelligence tools like Metabase and Apache Superset let you customize your analytics. They are great if you want control and flexibility. Some tools, such as KNIME and Redash, focus on workflow automation and SQL queries. These work best for technical users. Jaspersoft Community Edition and BIRT give you strong reporting options, but they may require more setup.
When you choose business intelligence tools, look for agility, easy data communication, and support for self-service analytics. FanRuan’s FineBI leads in these areas. The company has a strong reputation for innovation and customer support. FineBI helps you bridge the gap between IT and business teams, making data-driven decisions easier for everyone.
FineBI by FanRuan gives you a powerful self-service business intelligence platform that works for organizations of all sizes. You can use FineBI if you run a small business, a startup, a nonprofit, or even a large enterprise. The tool stands out for its easy-to-use interface, strong data integration, and enterprise-grade features. You can create interactive dashboards, perform data visualization, and blend data from multiple sources without writing code.
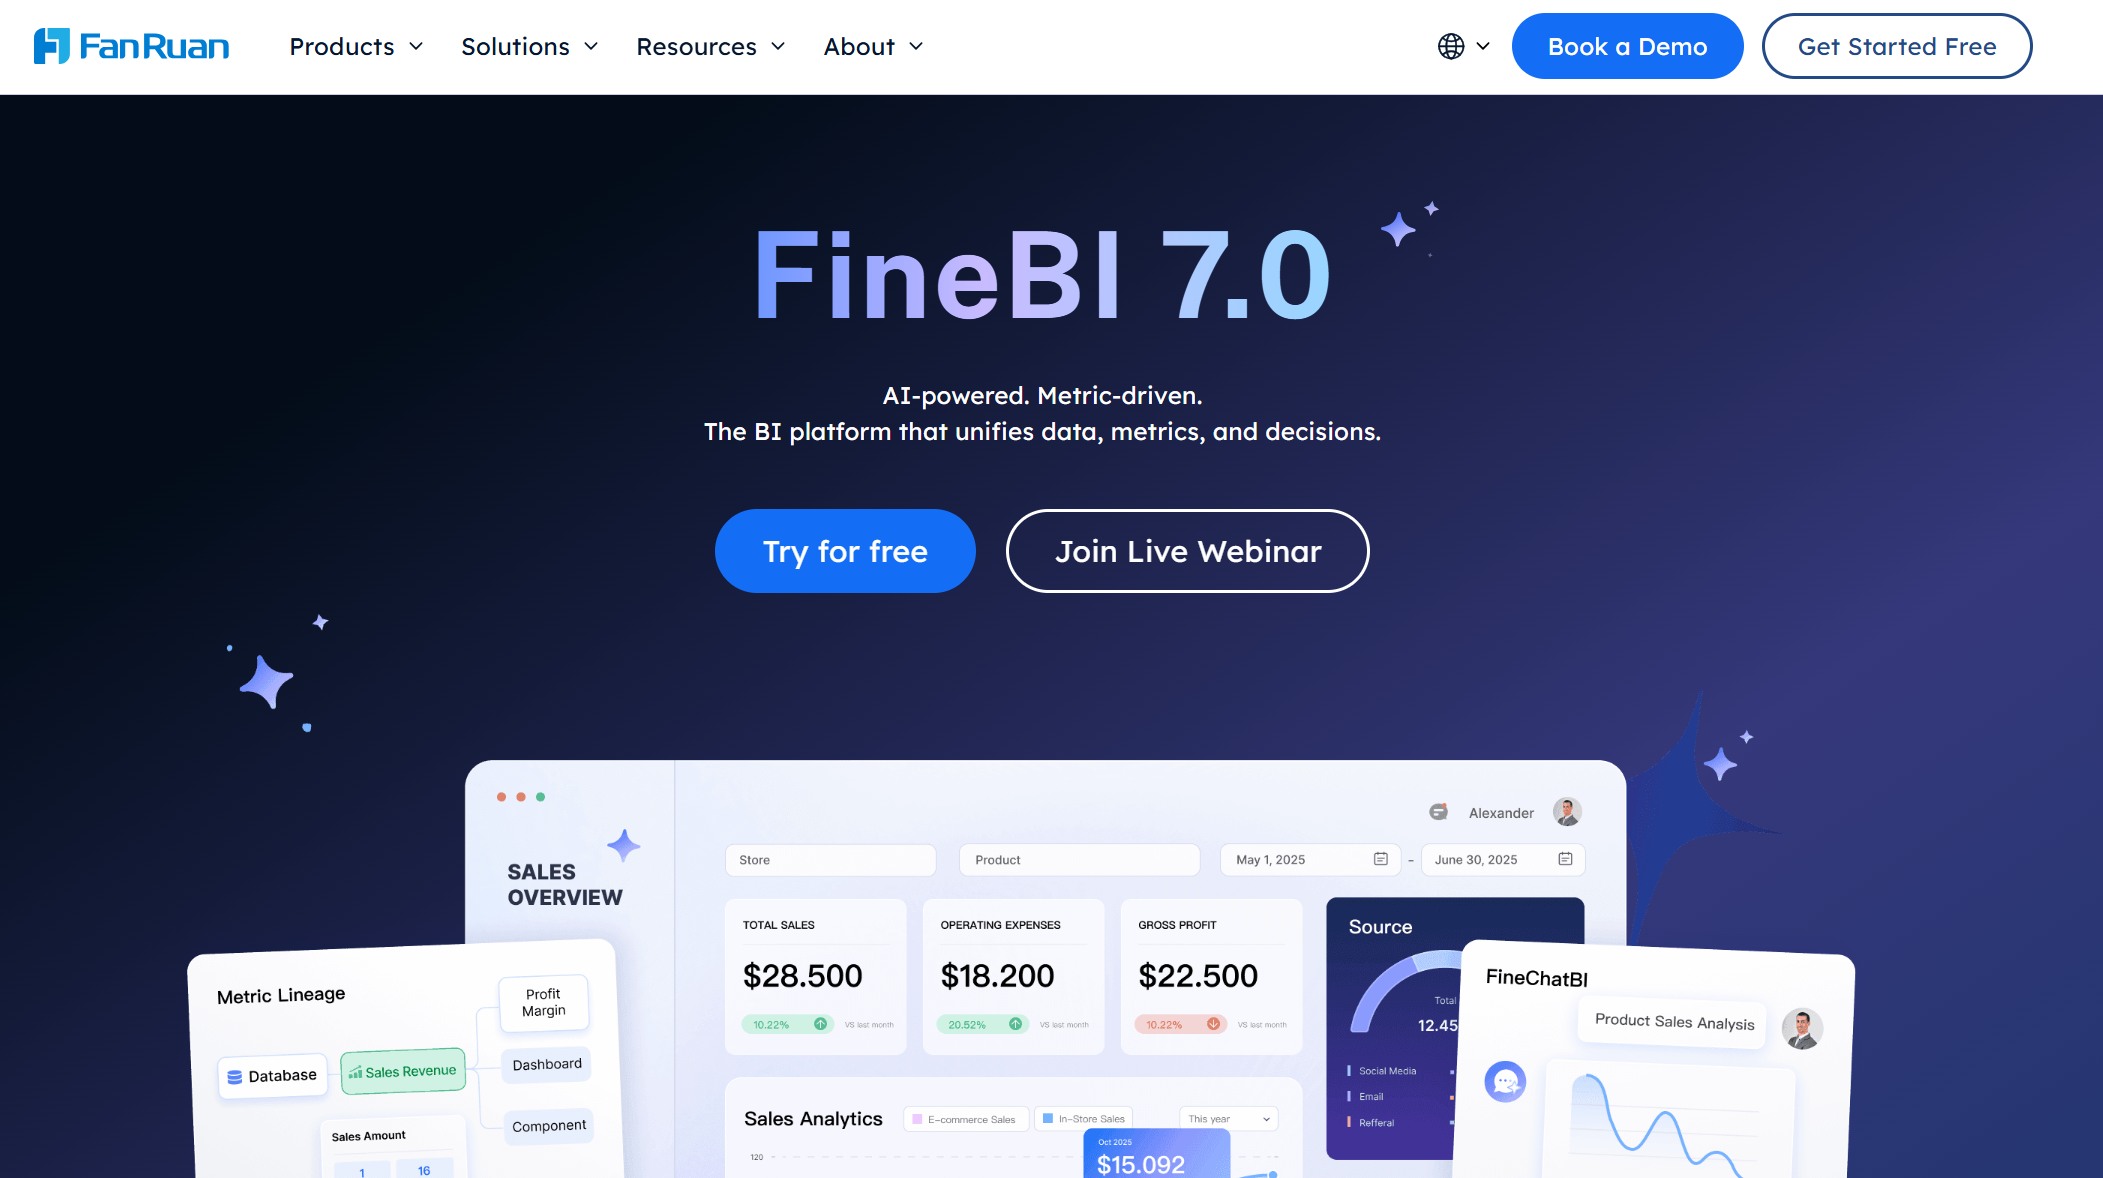
Website: https://www.fanruan.com/en/finebi
You will find FineBI especially useful if you want to empower business users to explore data independently. The platform supports high-volume processing, predictive analytics, and advanced reporting tools. You can collaborate with your team, set up performance metrics, and use strategic planning features. FineBI also offers natural language generation, trend indicators, and benchmarking tools. If you need customizable dashboards or want to track key performance indicators, FineBI delivers.

FineBI offers a free Personal Edition for individual users who want to explore its data analytics capabilities. For organizations seeking advanced features, collaboration tools, and technical support, the Enterprise Edition is available as a paid solution. This flexible licensing model allows users to get started at no cost and scale up as their business needs grow.
Note: You must register to unlock all features. Without registration, you can only preview dashboards and components. Features like task scheduling, group authority control, and real-time engines require a license.
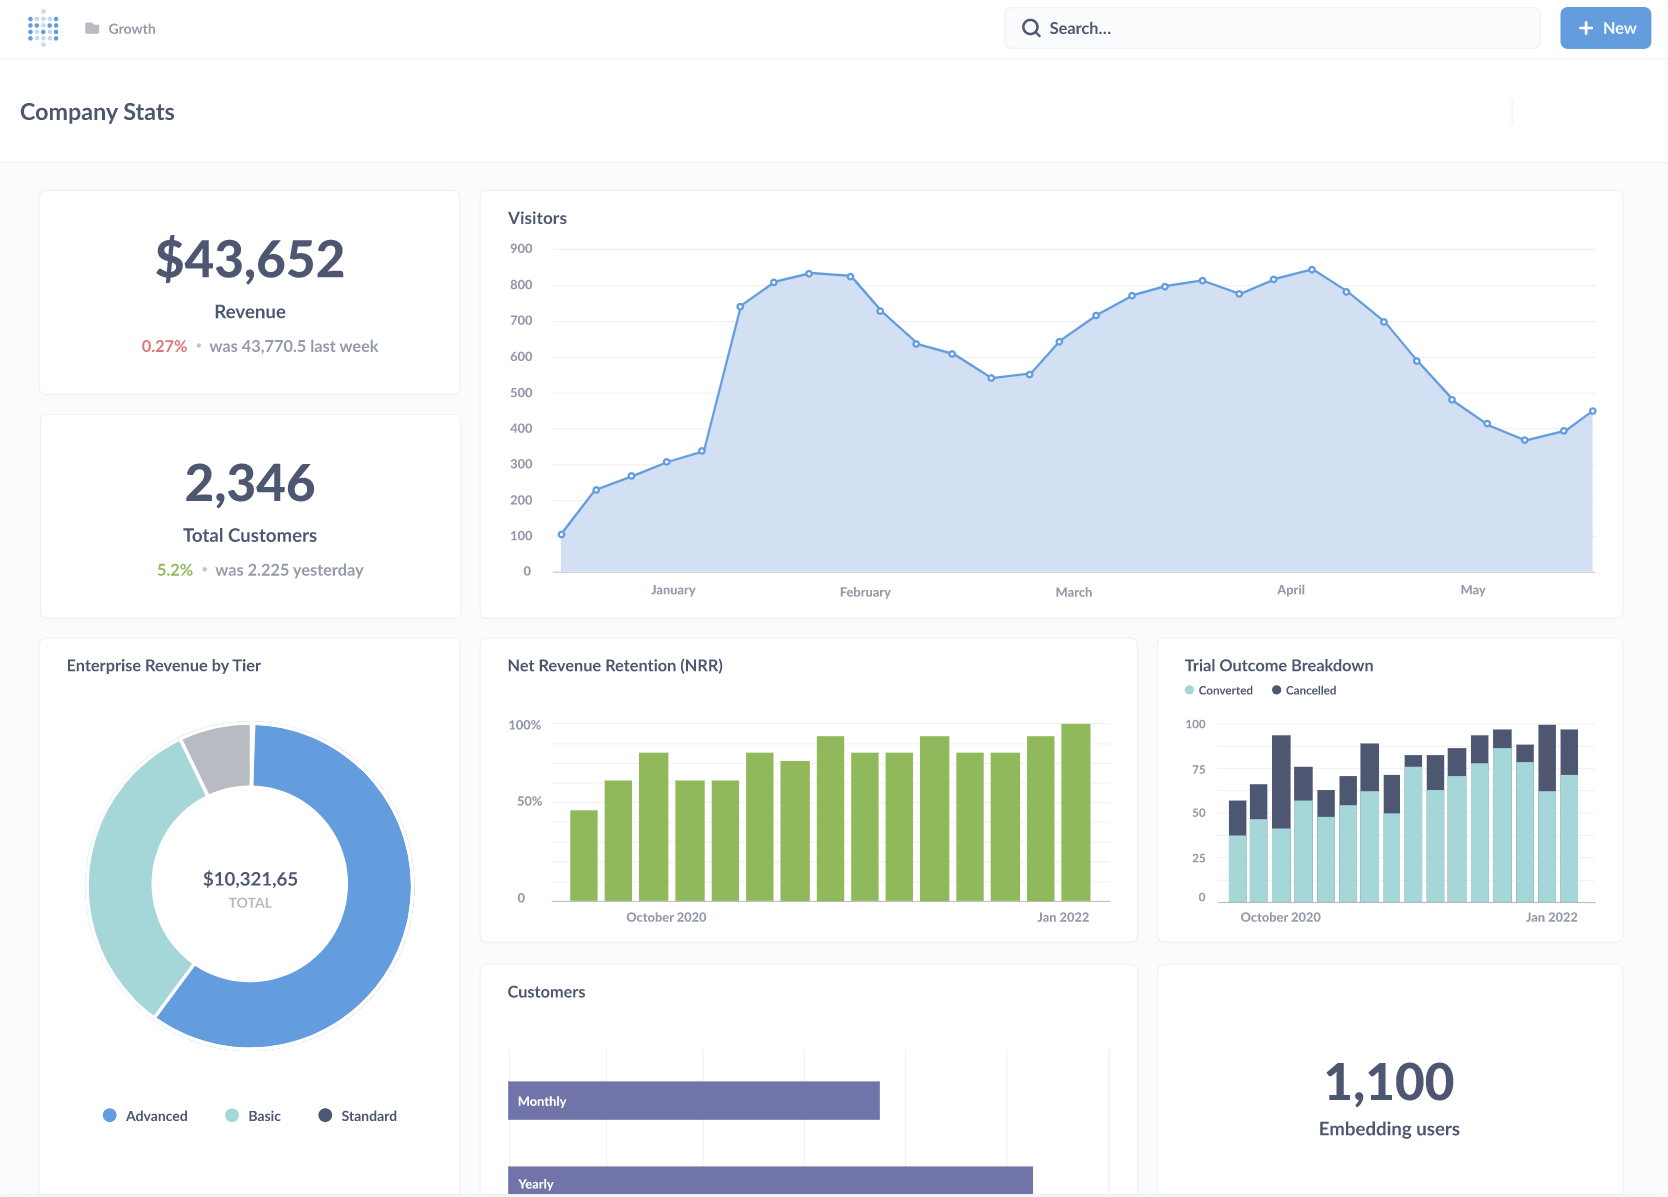
Website: https://www.metabase.com/
Metabase is an open-source business intelligence tool that works well for small to medium businesses and startups. You can use Metabase if you want a user-friendly interface that supports both non-technical users and SQL experts. The platform lets you build interactive dashboards, filter data, and drill down into details. You can connect to a wide range of databases, including MySQL, PostgreSQL, MongoDB, and cloud data warehouses.
| Key Features | Potential Drawbacks |
|---|---|
| User-friendly interface for all skill levels | Limited advanced analytics capabilities |
| Broad database compatibility | Basic dashboard customization options |
| Customizable interactive dashboards | Performance issues with large datasets |
| Scheduled email reports | Minimal built-in data transformation tools |
| Role-based security | Some technical skill needed for setup |
| Flexible deployment (cloud or self-hosted) | Security features may not meet strict compliance |
Metabase makes data visualization simple, but you may find its dashboard customization and advanced analytics features limited. If you need complex statistical modeling or strict compliance, you might want to consider other options.
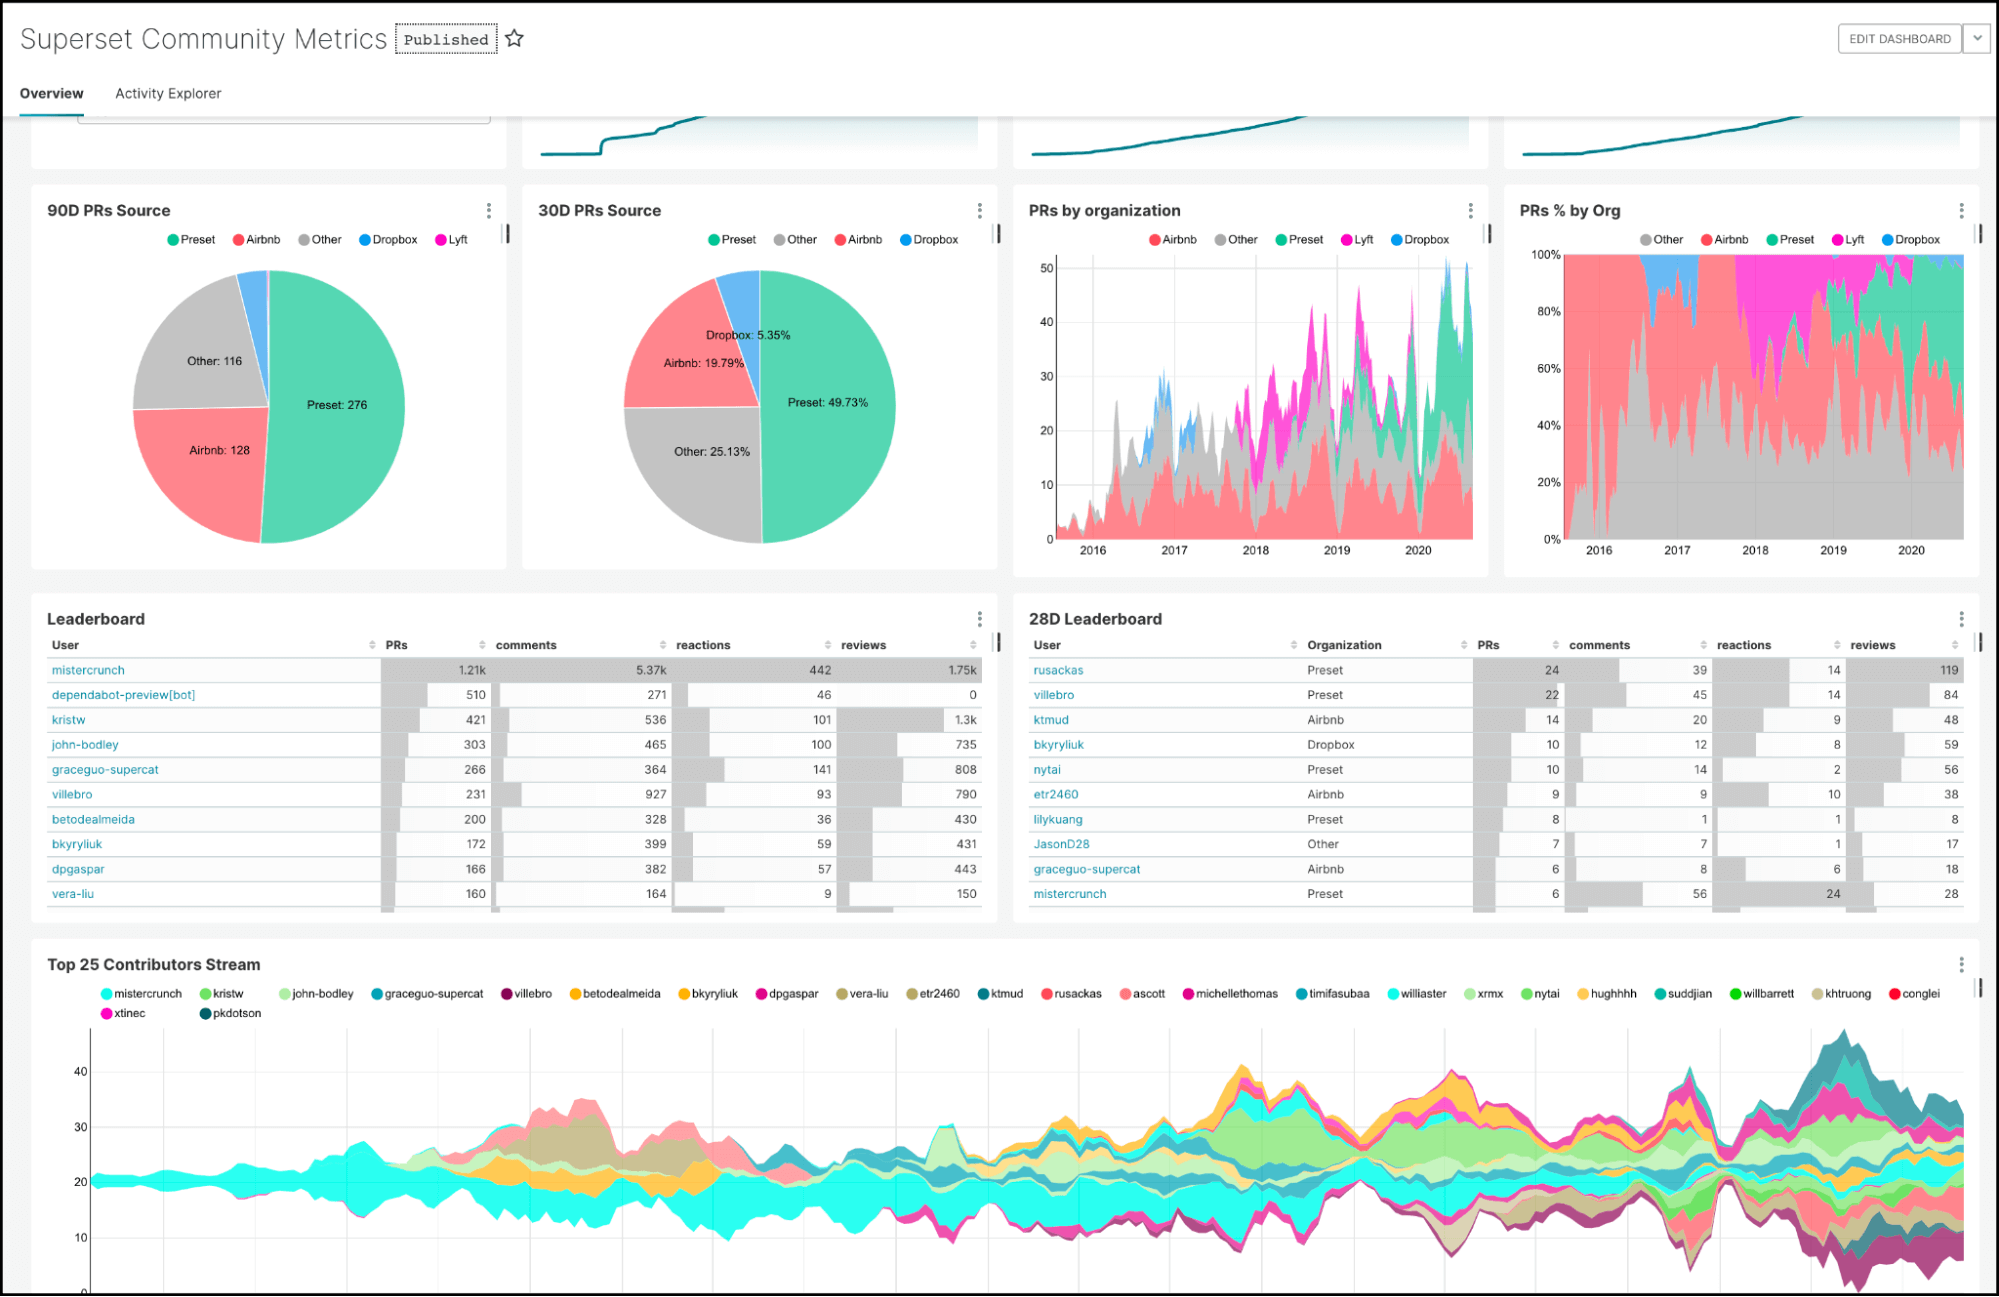
Website: https://superset.apache.org/
Apache Superset is an open-source platform designed for organizations that need flexibility and scalability. You can deploy Superset on-premises, in the cloud, or in hybrid environments. The tool excels at handling large datasets and offers a wide variety of visualizations. Superset supports integration with multiple SQL databases and allows you to customize dashboards for different business needs.
However, you may face a steep learning curve if you lack SQL skills. Superset relies on third-party connectors for some data sources, and its mobile experience is less responsive. Real-time collaboration features are limited, and you may need extra effort for setup and maintenance.
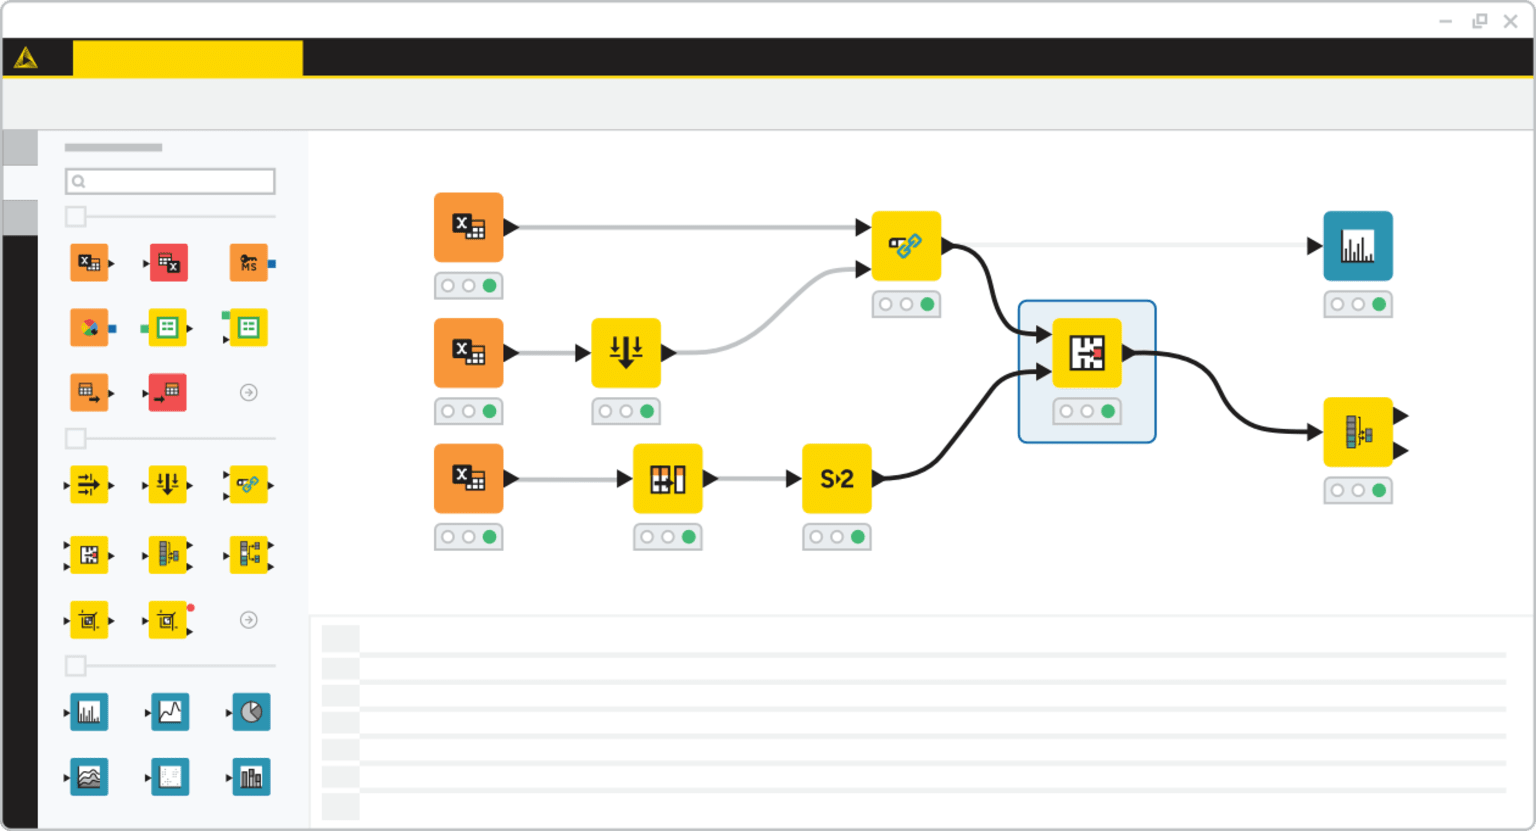
Website: https://www.knime.com/
KNIME is an open-source, flexible platform favored by researchers, data scientists, and technical teams. You can use KNIME if you want to build custom data pipelines, integrate with languages like Python or R, and leverage a strong plugin ecosystem. The tool is ideal for academic projects, prototyping, and production workflows.
You should know that advanced enterprise features such as scheduling, collaboration, and workflow sharing require the paid KNIME Server. The node-based interface can be complex for non-technical users, and collaboration features are limited in the free version.
Lightdash is an open-source BI tool built for developers and analytics teams who use dbt. You can define metrics and dimensions in code, which helps maintain version control and consistency. Lightdash offers a simple interface with core charts, dashboards, and the ability to drill into SQL queries.
Website: https://www.lightdash.com/
Lightdash may not offer as many visualization options or UI polish as mature BI tools. The mobile experience is less optimized, and you need a dbt project to unlock its full potential. Community support is available for the open-source version, while commercial support comes with the paid plan.
Redash is an open-source platform that works best for teams who rely on SQL queries and need quick access to data visualizations. You can use Redash to connect to various data sources, write SQL queries, and create interactive dashboards. The tool is popular among data analysts and technical users who want to share insights quickly.
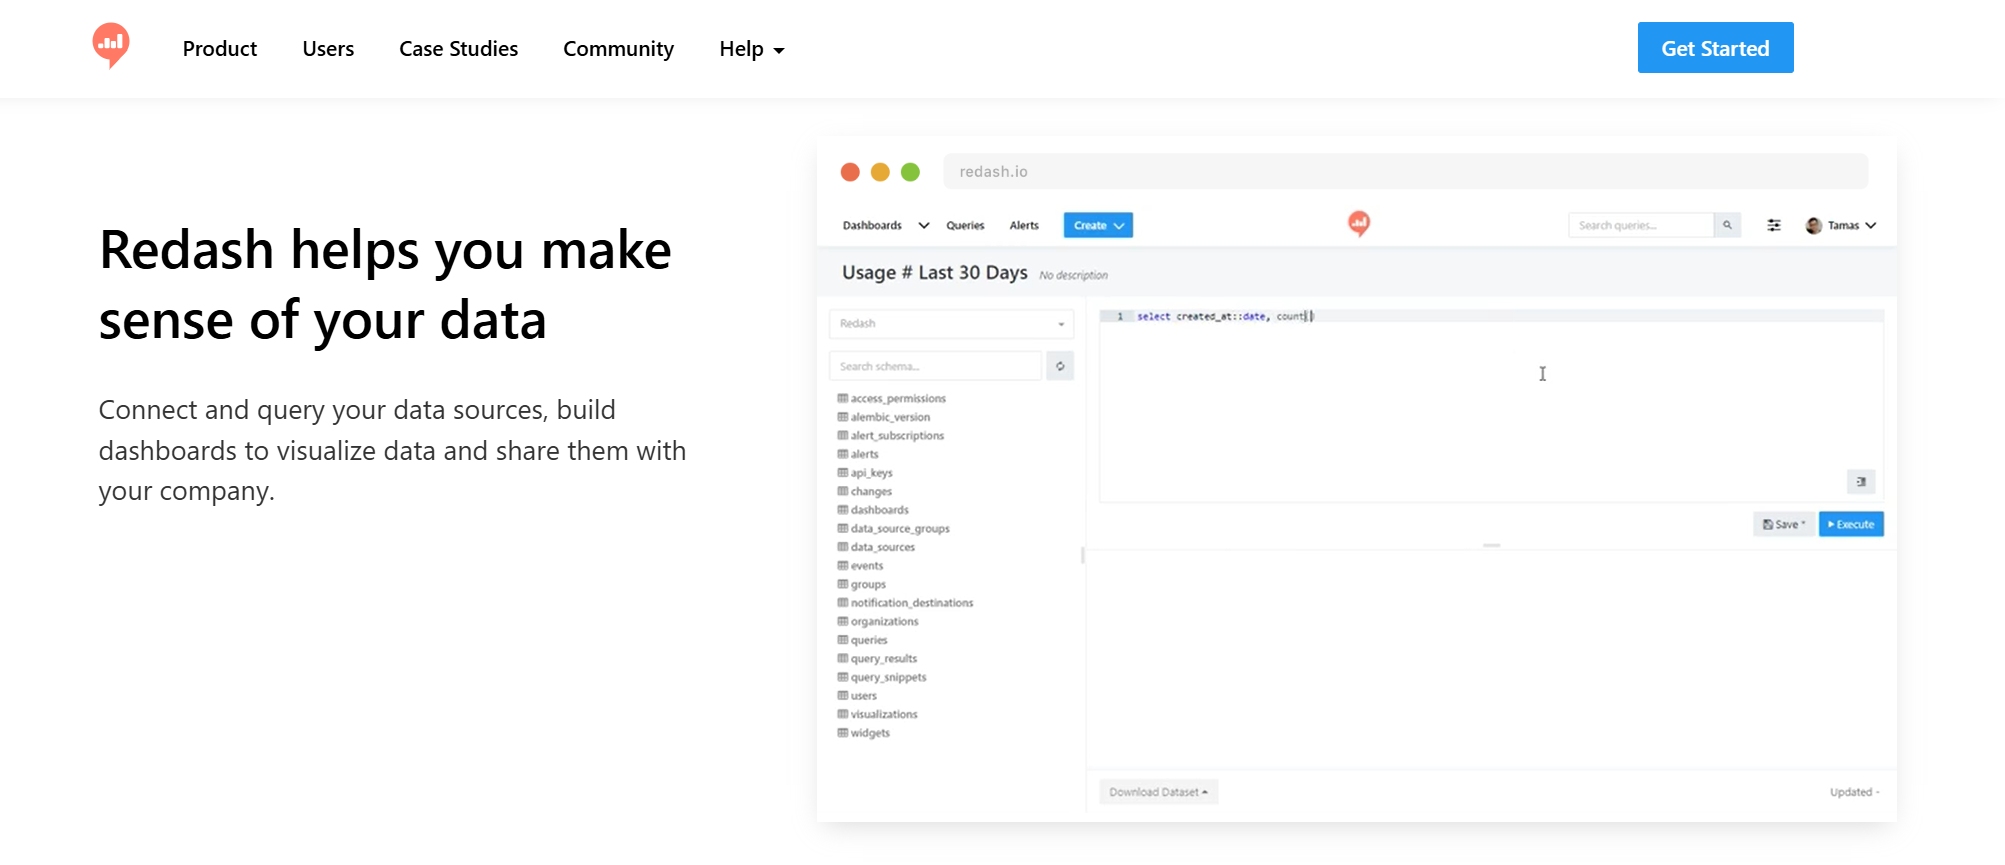
Website: https://redash.io/
You may find that Redash offers basic visualization options compared to other tools. Advanced analytics and collaboration features are limited, so it is best suited for teams with technical skills who need straightforward reporting tools.
Jaspersoft Community Edition is an open-source business intelligence tool that helps you generate static and dynamic reports, create dashboards, and manage ETL processes. You can use Jaspersoft if you want a flexible, cost-effective solution that integrates with multiple data sources. The platform supports real-time data visualization and is suitable for organizations that want to avoid vendor lock-in.
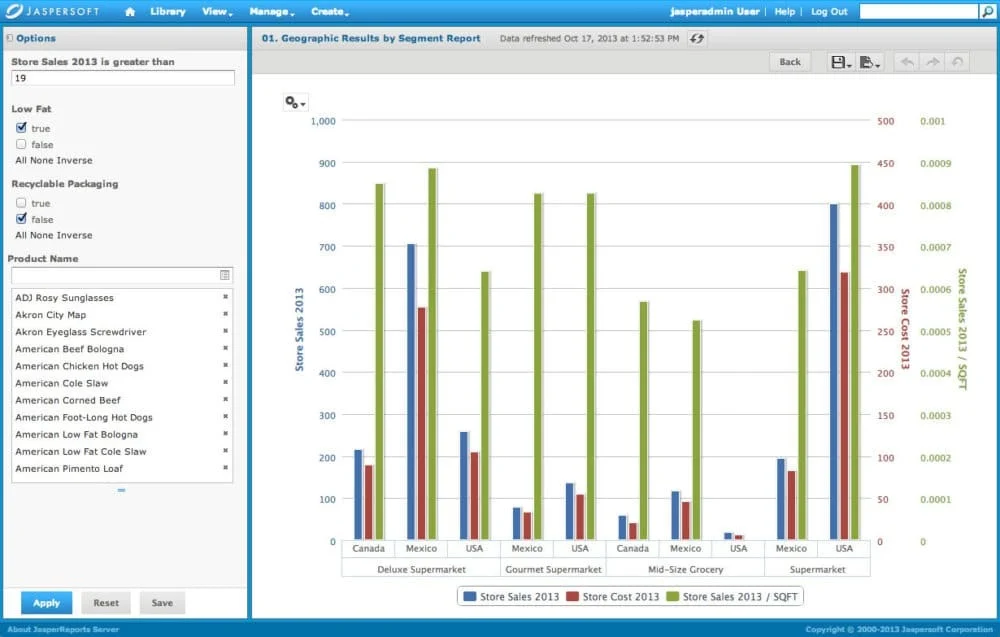
Website: https://www.jaspersoft.com/
Jaspersoft is easy to deploy and works for both technical and non-technical users. You can customize the tool to fit your needs and benefit from a wide range of reporting tools. However, you will rely on community support, which may lead to slower issue resolution. Integration with existing systems can be complex, and users familiar with proprietary BI tools may need extra training.
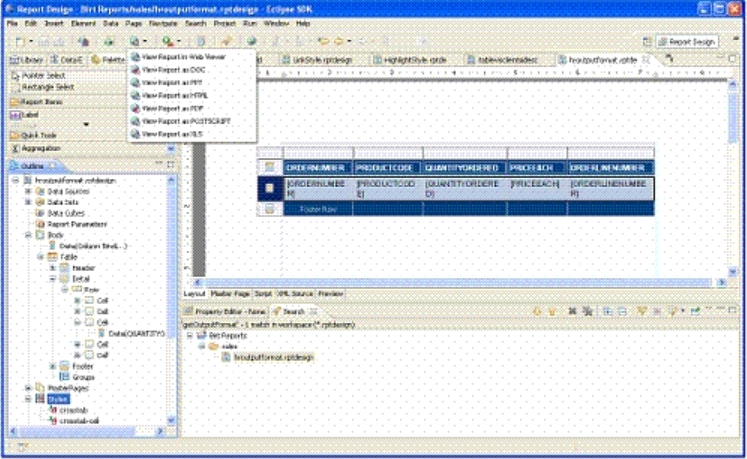
Website: https://eclipse-birt.github.io/birt-website/
BIRT is an open-source reporting platform based on Eclipse IDE. You can use BIRT to create strong data visualization tools, such as charts and graphs, that help you identify trends and patterns. The platform supports multiple data sources and provides built-in report templates, so you can build custom reports without deep programming skills.
Upgrading embedded BIRT installations can be more difficult than stand-alone versions. Some features may be missing in embedded setups, and support usually comes from the application vendor. Installing BIRT as a standalone tool can also be challenging for some users.
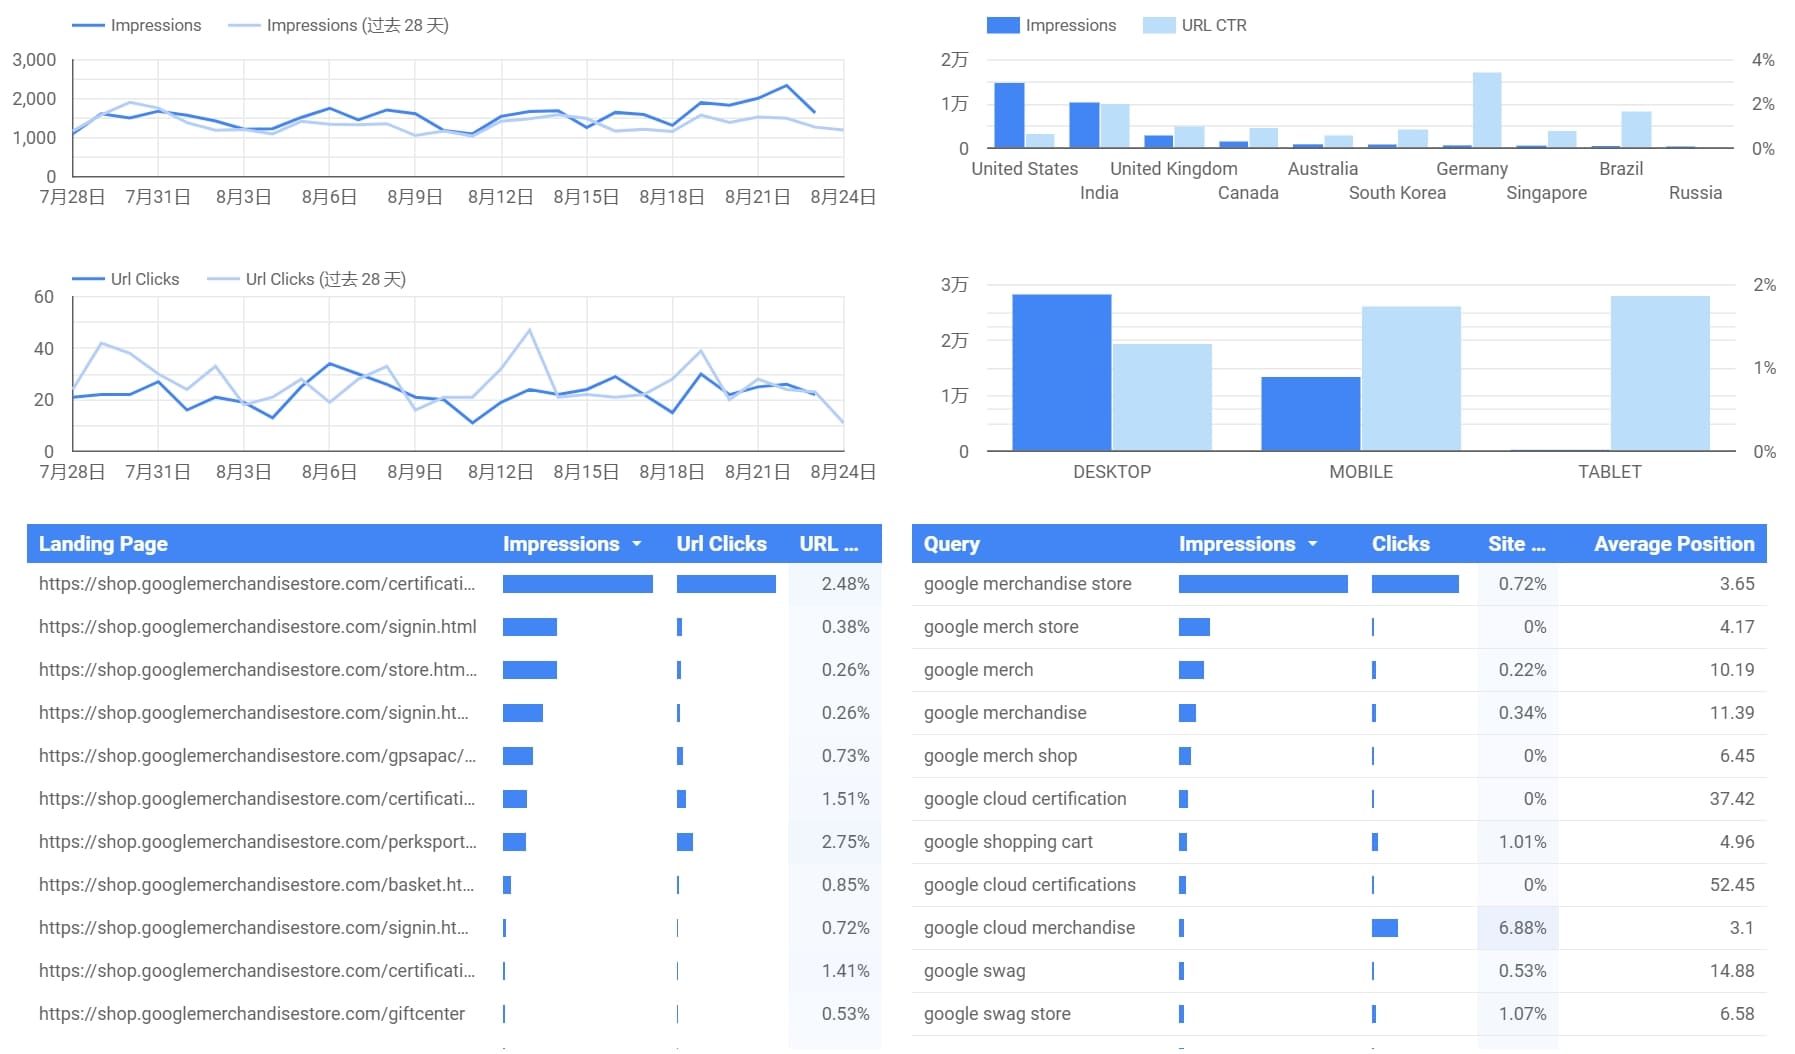
Website: https://lookerstudio.google.com/navigation/reporting
Looker Studio (formerly Google Data Studio) is a free, cloud-based BI tool that works well for small teams and simple reporting needs. You can use Looker Studio to create interactive dashboards and data visualizations using a drag-and-drop web interface. The platform offers a robust library of report templates and access to over 800 data connectors.
| Key Benefits | Potential Drawbacks |
|---|---|
| Easy-to-use web interface | User interface can be buggy with large datasets |
| Diverse report templates | Data blending limited to 5 sources |
| Collaboration and sharing features | Row limits restrict large data processing |
| Secure and HIPAA-compliant | Limited customer support for free users |
| Seamless integration with Google platforms | Bugs and performance issues with large datasets |
Looker Studio is best for teams that need quick, customizable dashboards and easy sharing. You may encounter limitations with large datasets, data blending, and advanced analytics. Free users have limited support, and the interface can become less intuitive with complex projects.
![]()
Website: https://www.microsoft.com/en-us/power-platform/products/power-bi
Microsoft Power BI Free (Desktop) is a popular choice for individuals and small businesses who want to create reports and visualizations without upfront costs. You can use Power BI to build interactive dashboards, connect to various data sources, and perform data analytics. The platform offers strong integration with the Microsoft ecosystem, making it ideal if you already use Office 365 or Azure.
However, you cannot share or collaborate on reports unless others have Pro or Premium licenses. Data refresh rates and real-time streaming are limited, and integration with non-Microsoft systems can be challenging. The interface may feel bulky for some users, and advanced security features are restricted in the free version.
When you choose business intelligence tools, you need to look at several important factors. Ease of use should come first. You want a tool that lets you build dashboards and reports without needing advanced technical skills. Integration is also key. The best tools connect to many data sources, so you can see all your company’s information in one place. Scalability matters if your business is growing. Some tools handle thousands of users and large data sets, while others work best for small teams.
Support and security are also important. You should pick a tool that offers strong data protection and meets regulations like GDPR or HIPAA. Automation features, such as scheduled data refreshes and alerts, help you get actionable insights without extra work. Device-independence lets you access dashboards from any device, which is useful for remote teams.
Here is a table that compares integration and scalability across different categories of business intelligence tools:
| BI Tool Category | Data Source Integration Capacity | Real-time Analytics Level | API/Customization Access | Scalability Features |
|---|---|---|---|---|
| Enterprise Solutions | Unlimited | Advanced | Full API access | Supports thousands of concurrent users, fast queries |
| Mid-Market Tools | 20-50 sources | Standard | Limited API access | Suitable for mid-sized companies, moderate scaling |
| Cost-Effective/Free | 10-20 sources | Basic | Basic customization | Limited scalability, designed for small organizations |
Tip: Cloud-based business intelligence platforms often offer flexible scaling and easy integration with other cloud services.
You should match your choice of business intelligence tools to your company’s goals and resources. If you need to connect many data sources, manage large data sets, and support many users, enterprise solutions or advanced freemium plan options work best. For smaller teams or startups, a freemium plan with basic integration and reporting features may be enough.
FineBI is a great fit if you want self-service analytics and minimal coding. It helps business professionals and analysts build actionable insights quickly. FineBI supports OLAP analysis, built-in formulas, and industry-specific models. You can use it in manufacturing, healthcare, retail, or finance to monitor trends and key metrics. FineBI stands out for its user-friendly interface and strong customization, making it easy for you to perform data-driven decision-making without heavy IT support.
Other tools like Looker Studio work well if you already use Google services and need real-time collaboration. However, these tools may have limits on data source variety and scalability. Always check if the tool’s freemium plan covers your needs for integration, automation, and security.
Note: The right tool should help you turn raw data into actionable insights and support data-driven decisions as your business grows.
You may know FanRuan as a global leader in business intelligence. The company started in China and now serves over 30,000 clients worldwide. FanRuan focuses on innovation and customer success. Its mission is to help you make smarter decisions with data. Many well-known companies, such as Red Bull and A.O. Smith, trust FanRuan to deliver the best business intelligence tool for their needs. The company has earned recognition from Gartner and Forbes for its achievements in analytics and cloud technology.
FanRuan empowers organizations across industries to unlock the value of their data and drive growth.
FineBI stands out as a top free BI tool that gives you the power to turn data into actionable insights. You can use FineBI to organize, analyze, and visualize your business data with ease. The platform offers a wide range of self-service analytics features:
You also benefit from strong data integration. FineBI connects to over 30 big data platforms, SQL sources, and Excel datasets. The platform includes a low-code data development module for cleansing and transforming data. Its high-performance ELT/ETL engine ensures your data stays clean and ready for analysis. You can synchronize, transform, and schedule data tasks with ease.

FineBI’s drag-and-drop interface lets you build dashboards without coding. You can analyze large datasets efficiently and share real-time analytics across your organization. Automatic data modeling and a big data engine help you get results fast. FineBI gives you the best business intelligence tool to support data-driven decisions and business growth.
You can boost your business growth by choosing the right free BI tool. These platforms help you track key metrics, analyze trends, and make smart decisions.
Click the banner below to try FineBI for free and empower your enterprise to transform data into productivity!


The Author
Lewis
Senior Data Analyst at FanRuan
Related Articles

How to Build a UAT Dashboard for BI Projects: KPIs, Workflow, and Sign-Off Criteria
Learn how to build a UAT dashboard for BI projects. Track KPIs, manage workflow, and define sign-off criteria to ensure successful releases.
Lewis Chou
May 05, 2026
How to Build a UAT Dashboard for BI Projects: KPIs, Workflow, and Sign-Off Criteria
A uat dashboard gives BI teams one place to control testing progress, $1, defect risk, and stakeholder sign off before release. For IT managers, BI product owners, analytics leads, and operations directors, this is not a
Eric
Jan 01, 1970

Customer Insights Dashboard: What Enterprise Teams Should Track and Why It Matters
Learn what enterprise teams should track in a customer insights dashboard to centralize data, improve decisions, and drive revenue and retention.
Lewis Chou
May 01, 2026


