A compliance dashboard gives you a clear view of your organization’s adherence to rules and standards. You can use this dashboard to track compliance activities and spot risks before they grow. Many organizations face strict regulations and need fast, accurate reporting. Recent industry studies show that companies using compliance dashboards see decision-making speed increase by 75% and compliance-related incidents drop by 60%.
| Metric | Improvement Percentage |
|---|---|
| Decision-making speed related to compliance | 75% |
| Reduction in compliance-related incidents | 60% |
Modern tools like FineBI help you monitor, analyze, and report on compliance in real time.

A compliance dashboard is a digital tool that helps you track and manage your organization’s adherence to laws, regulations, and internal policies. You can use this dashboard to see real-time updates on compliance activities, spot risks, and measure progress toward your goals. The dashboard brings together data from different sources, giving you a single place to monitor everything related to compliance.
You will find that a compliance dashboard is more than just a collection of charts. It organizes information in a way that makes it easy for you to understand and act on. Most dashboards include key risk indicators (KRIs), key performance indicators (KPIs), and visual cues like color-coded symbols. These features help you quickly see where your organization stands.
Here is a table showing the main components you will find in a compliance dashboard:
| Component | Description |
|---|---|
| Perspective | Identifies the intended audience for the report. |
| Objectives | Defines the goals of the compliance program. |
| Measurements | Includes Key Risk Indicators (KRIs) and Key Performance Indicators (KPIs) for tracking. |
| Indicators | Utilizes color-coded symbols for quick performance assessment. |
| Visuals | Incorporates heat maps, charts, trends, and scorecards to present data effectively. |
| Types of Dashboards | Strategic, Analytical, and Operational dashboards serve different purposes in monitoring. |
You can use different types of compliance dashboards depending on your needs. For example, a regulatory compliance dashboard helps you track rules like GDPR or HIPAA. A risk and audit compliance dashboard lets you monitor risk exposure and audit findings. Other dashboards focus on policy training, vendor compliance, data privacy, or financial regulations.
| Type of Compliance Dashboard | Use Cases |
|---|---|
| Regulatory Compliance Dashboards | Track compliance with regulations like GDPR, HIPAA, and SOX; display real-time compliance status. |
| Risk and Audit Compliance Dashboards | Monitor risk exposure and audit findings; provide insights into compliance gaps. |
| Policy and Training Compliance Dashboards | Track employee training completion and policy adherence; flag overdue training sessions. |
| Vendor and Third-Party Compliance Dashboards | Assess compliance status of vendors; evaluate risk scores and adherence to contract terms. |
| Data Privacy and Security Compliance Dashboards | Monitor data protection measures and security incidents; display metrics on data breaches. |
| Financial Compliance Dashboards | Track adherence to financial regulations; ensure transparency in financial operations. |
A compliance dashboard gives you a clear and organized view of your compliance landscape. You can use it to make better decisions, respond to risks faster, and keep your organization on track.
A compliance dashboard plays a central role in compliance management. You can use it to bring together all your compliance data, policies, and procedures in one place. This central repository helps you avoid duplicating work and makes it easier to manage controls and requirements.
When you use a compliance dashboard, you save time and resources. You can leverage existing mitigations across different requirements, which means you do not have to start from scratch every time a new regulation appears. The dashboard also reduces the number of tests you need to collect compliance evidence, making your compliance program more efficient.
Here are some ways a compliance dashboard supports your compliance management efforts:
A compliance management dashboard helps you stay ahead of risks and ensures your organization meets all necessary standards. You can use it to track progress, identify gaps, and take action before small issues become big problems. With the right dashboard, you make compliance a part of your everyday operations, not just a yearly task.
A compliance dashboard gives you a powerful way to manage and monitor your organization’s compliance activities. FineBI makes this process simple by guiding you through four main stages: data integration, data processing, visualization, and governance. Each stage helps you build a dashboard that delivers real-time visibility and supports your compliance program.
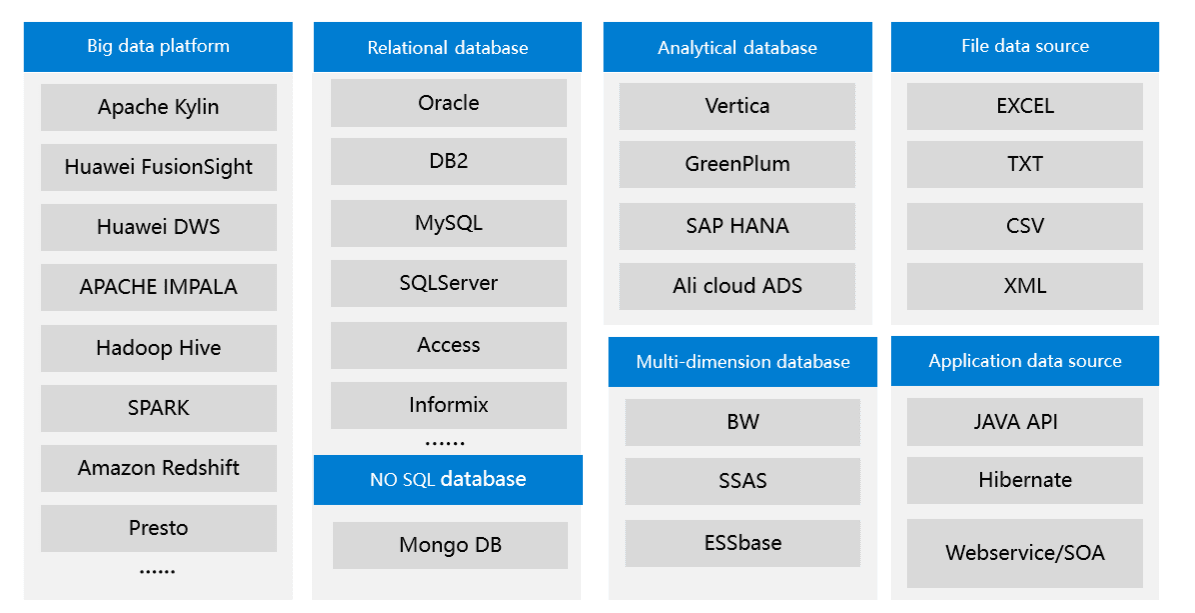
You start by connecting all your important data sources. FineBI supports both cloud and local sources, so you can bring together information from across your organization. This flexibility means you can track compliance data from many systems in one place.
| Data Source Type | Description |
|---|---|
| Cloud Sources | Various cloud-based data sources |
| Local Sources | On-premises data storage options |
FineBI also connects to ERP systems, CRM platforms, document management tools, and e-signature platforms. This wide range of integration options lets you collect compliance data from financial records, customer interactions, contracts, and more. You can use API connections to fetch real-time updates, ensuring your dashboard always reflects the latest compliance status.

Once your data is connected, FineBI helps you process it. You can clean, filter, and organize your data to focus on what matters most for compliance. FineBI’s self-service tools let you join tables, create calculated fields, and apply filters without needing advanced technical skills. This step ensures your compliance dashboard shows accurate and relevant information.
With FineBI, you gain real-time visibility into your compliance landscape. The dashboard updates automatically as new data comes in, so you always see the current status of your compliance activities. This real-time monitoring helps you spot risks early and respond quickly.

To achieve this, FineBI uses several technical features:
You can also integrate FineBI with business intelligence tools for advanced analytics and reporting. This allows you to drill down into specific compliance metrics, track trends over time, and generate reports for audits or management reviews.
| Integration Type | Purpose |
|---|---|
| ERP systems | For financial data and procurement workflows |
| CRM platforms | For customer relationship and sales data |
| Document management | For contract storage and version control |
| E-signature platforms | For execution workflow integration |
| Business intelligence | For advanced analytics and reporting |
FineBI’s dashboards support automated alerts and scheduled reports. You can set up notifications for key compliance events, such as overdue training or policy violations. This automation helps you stay proactive and keeps your compliance program running smoothly.

Protecting sensitive compliance data is critical. FineBI provides strong user access and security controls to keep your information safe. You decide who can view, edit, or share each dashboard, using role-based access controls and multi-factor authentication.
| Security Feature | Description |
|---|---|
| Secure Access Controls | Implement robust security measures to safeguard sensitive data and restrict access to authorized personnel only. |

FineBI uses end-to-end encryption for data in transit and at rest. Every action on the dashboard gets logged, creating a complete audit trail. This means you can track who accessed or changed compliance data at any time. FineBI also supports compliance with industry standards like SOC 2 and ISO 27001, giving you confidence that your compliance dashboard meets strict security requirements.
You can choose where your data is stored, which is important for organizations with international operations. FineBI’s data residency options help you meet local regulations and protect your compliance information.
Tip: Always review user permissions regularly to ensure only authorized staff have access to sensitive compliance dashboards.
By following these steps—integrating data, processing it for clarity, monitoring in real time, and securing access—you build a compliance dashboard that gives you real-time visibility and supports your organization’s compliance goals.
You gain a clear view of your organization’s compliance status when you use a compliance dashboard. The dashboard brings together data from different departments and systems, making it easy for you to spot gaps and track progress. You see real-time updates, which help you respond quickly to changes in regulations or internal policies.
These improvements show that a compliance dashboard helps you monitor activities and identify areas that need attention. You can use visual cues and metrics to understand where your organization stands and what actions you need to take.
FineBI empowers you to make faster and smarter decisions. The dashboard provides real-time analytics and interactive visualizations, so you can explore data and uncover trends. You do not need advanced technical skills to use FineBI. You can drag and drop data, apply filters, and customize views to focus on what matters most.
You can share dashboards with your team, which encourages collaboration and transparency. FineBI’s self-service features let you analyze compliance data independently, reducing your reliance on IT support. You can use these insights to adjust policies, allocate resources, and improve compliance outcomes.
Tip: Use FineBI’s alert system to receive notifications about critical compliance events. This helps you stay proactive and avoid surprises.
A compliance dashboard helps you reduce risks and increase accountability. You can track incidents, audit findings, and risk exposure in one place. The dashboard makes it easy for you to monitor the progress of risk mitigation plans and ensure timely action.
| Metric | Description |
|---|---|
| Reduction in incidents | Measures the decrease in breach numbers after implementing new cybersecurity measures. |
| Audit findings | Indicates lower non-compliance issues, showing that controls are performing effectively. |
| Risk exposure value | Estimates potential losses by combining likelihood and impact, helping prioritize high-risk areas. |
| Incident frequency and severity | Tracks how often incidents occur and their impact, providing insight into the risk environment. |
| Risk mitigation plan progress | Monitors the completion rate of planned actions to ensure timely and effective risk management. |
| Compliance and audit findings | Reviews compliance and audit results to ensure adherence to policies and identify areas for improvement. |
You can use both lagging and leading indicators to measure risk and accountability. Track the number of incidents, audit findings, and training completion rates. Monitor how quickly you discover and resolve issues. These metrics help you build a culture of compliance and keep your organization safe.

You can track the most important compliance metrics using a compliance dashboard. These custom KPIs help you measure how well your organization follows rules and handles risks. You see where you stand and where you need to improve. Here are some common KPIs you might include:
| KPI Name | Description |
|---|---|
| Mean time to issue discovery | Measures how quickly you find compliance issues. |
| Mean time to issue resolution | Shows how fast you resolve compliance problems. |
| Compliance expense per issue | Calculates the average cost of each compliance issue. |
| Average cost of compliance-related lawsuits | Tracks the expenses from lawsuits, showing how well you manage risks. |
| Total regulatory compliance expense | Sums up all fines and costs from compliance failures. |
| Risk severity gap | Compares expected risks with actual events, helping you focus on the biggest threats. |

You can customize these metrics to fit your industry or business needs. FineBI lets you build and display these KPIs in a way that makes sense for your team.
A compliance dashboard keeps you informed with alerts and notifications. You do not have to check the dashboard all the time. FineBI sends you updates when something important happens. This helps you act quickly and avoid missing risks.
| Functionality | Description |
|---|---|
| Proactive Monitoring | FineBI watches key indicators and notifies you of risks right away. |
| Centralized Information Push | Sends alerts to the right people, so everyone stays informed. |
| Risk Notification | Notifies teams about risks during daily operations. |
| Operational Monitoring | Tracks user actions and sends batch alerts to help you reach your business goals. |
| IT Efficiency | Alerts IT staff about system issues or data problems, improving response times. |
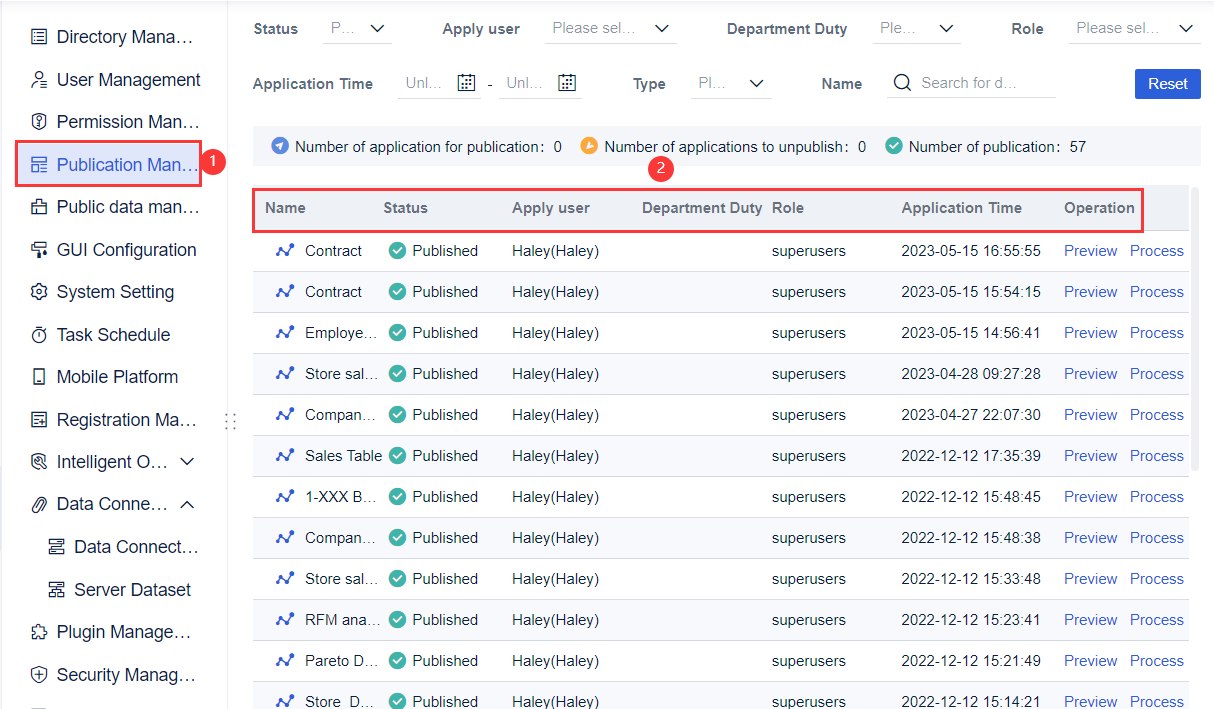
FineBI also creates audit trails. Every action on the dashboard gets logged. You can see who made changes and when. This builds trust and helps you meet compliance requirements.
Tip: Use audit trails to review user activity and ensure everyone follows compliance rules.
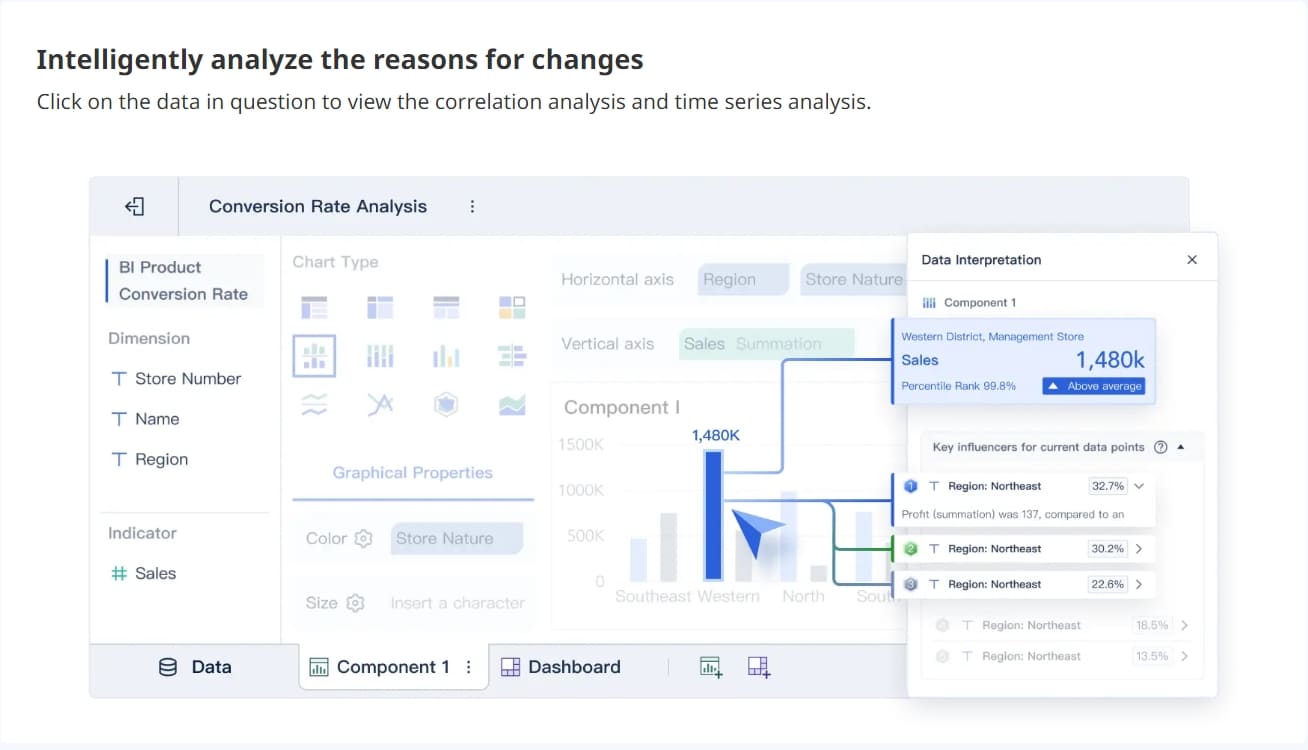
You can explore your compliance data with interactive visualizations. FineBI’s drag-and-drop dashboard builder makes it easy to create charts, maps, and tables. You can filter data in real time and drill down into details with just a click.
Research shows that interactive dashboards improve awareness and decision-making. For example, hospitals saw better safety compliance and faster treatment consent after using real-time dashboards. Teams also reported higher satisfaction because they could find information quickly.
FineBI supports team collaboration. You can share dashboards, leave comments, and work together to solve compliance challenges. Role-based access control protects sensitive data. You decide who can view or edit each dashboard. This keeps your information safe and meets privacy rules.

Note: Role-based access control increases security, accountability, and helps you meet regulatory standards.
A compliance dashboard with these features gives you the tools to manage risks, track progress, and keep your organization safe.
You can set up a compliance dashboard in FineBI by following a clear process. First, define your objectives for the dashboard. Decide which compliance regulations and risks you want to monitor. Next, connect FineBI to your data sources. You can use built-in connectors for databases, cloud platforms, and APIs. After connecting, map your data fields to match your compliance requirements. Clean and organize your data to ensure accuracy.
FineBI lets you create custom datasets and join tables. You can use drag-and-drop tools to build visualizations. Add charts, tables, and scorecards to display compliance metrics. Set up automated alerts for critical events. Before launching, test your dashboard to confirm that data updates in real time and that security controls work. Train your team to use the dashboard and review user permissions regularly.
You can improve your compliance program by following proven best practices:
Tip: Use periodic reviews to keep your dashboard aligned with current compliance standards.
Organizations often face challenges when implementing a compliance dashboard. You may encounter issues such as data fragmentation, lack of real-time visibility, or difficulty meeting regulatory compliance requirements. Here is a table showing common challenges and solutions:
| Challenge | Solution |
|---|---|
| Data Fragmentation | Plan for data mapping and integration. Connect all systems to FineBI for unified data. |
| Lack of Real-Time Visibility | Test and validate the dashboard to ensure instant updates and accurate reporting. |
| Meeting Regulatory Requirements | Establish clear objectives and conduct comprehensive analysis to tailor your dashboard. |
You can overcome these obstacles by setting clear goals, choosing the right solution, and investing in staff training. Implement robust security measures such as encryption and authentication. Communicate openly with stakeholders to clarify roles and responsibilities. Test your dashboard before full deployment to ensure effective compliance management.
Note: Measuring the ROI of your compliance dashboard can be complex. Assign financial value to both qualitative and quantitative benefits. Track progress and establish benchmarks to measure success.
You gain long-term value when you use a compliance dashboard. Real-time monitoring helps you detect risks early, improve security, and prepare for audits. FineBI gives you the tools to automate tasks, organize data, and respond quickly to regulatory changes. You can follow these steps to get started:
Explore webinars and articles for deeper insights into dashboard strategies and best practices.
What is a Dashboard and How Does It Work
Dashboard Meaning Explained Across Different Industries
What Are Performance Dashboards and Their Benefits in 2025

The Author
Lewis
Senior Data Analyst at FanRuan
Related Articles

Payment Analytics Dashboard: 12 KPIs Every Operations Leader Should Track to Cut Revenue Leakage
Losing revenue to declines? Discover 12 essential KPIs to track in your payment analytics dashboard to stop leakage and manage disputes.
Lewis Chou
May 05, 2026

SOC Dashboard Explained: 12 Essential KPIs, Views, and Workflows Security Teams Use
Learn about SOC dashboards, the 12 essential KPIs for security teams, and how they centralize alerts and workflows for faster threat detection and response.
Lewis Chou
May 05, 2026

EMR Dashboard Guide: 12 Metrics to Track for Faster Clinical and Operational Decisions
Learn the 12 essential EMR dashboard metrics to track for faster clinical and operational decisions, improving patient flow and revenue cycle management.
Lewis Chou
May 05, 2026


