A data analytics framework is crucial for any business aiming to stay competitive. It helps you gather and analyze data effectively. By adopting a structured approach, you can unlock numerous benefits:
- Enhanced decision-making: Make informed choices based on data insights.
- Improved efficiency: Streamline processes and reduce time spent on data tasks.
- Competitive advantage: Stay ahead by leveraging data-driven strategies.
To set up your framework, you'll follow essential steps. Tools like FineDataLink, FineReport, and FineBI can assist in data integration, reporting, and analysis, ensuring a seamless experience.

Understanding Data Analytics Framework
Definition and Purpose of Data Analytics Framework
What is a data analytics framework?
A data analytics framework is a structured approach that helps you make sense of data. It organizes complex information environments, allowing you to gain actionable insights. By using a framework, you can systematically analyze and interpret data, uncovering patterns, trends, and hidden correlations. This structured method is essential for navigating the intricate pathways of data analytics.
Why is it important?
Implementing a data analytics framework is crucial for any business aiming to stay competitive. It provides a roadmap for refining data-driven decision-making. With a well-structured framework, you can bring order to your data, making it easier to extract valuable insights. This approach not only enhances decision-making but also improves efficiency and gives you a competitive edge. As businesses face increasing data complexity, having a framework becomes even more vital.
Key Components of Data Analytics Framework
Data collection
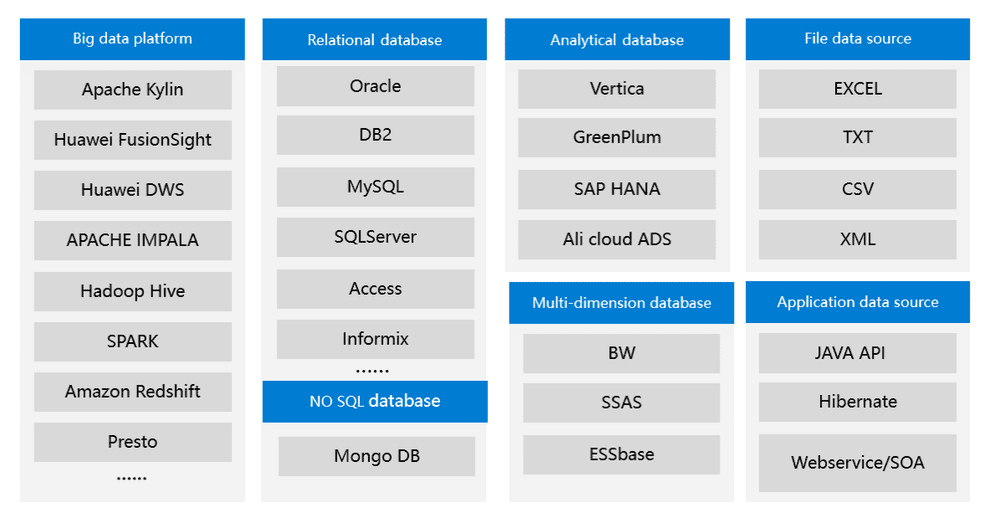
Data collection is the first step in any analytics framework. You gather data from various sources, ensuring it is relevant and accurate. This step is critical because the quality of your data directly impacts the insights you can derive. You need to identify the types of data required and the sources from which they will be collected. This ensures that you have a comprehensive dataset to work with.
Data processing
Once you have collected the data, the next step is data processing. This involves cleaning and transforming the data to ensure its quality. You need to remove any inconsistencies or errors, making the data ready for analysis. Data processing is essential because it prepares the data for the next stages, ensuring that your analysis is based on accurate and reliable information.
Data analysis
Data analysis is where you extract insights from the processed data. You use various analytical methods and tools to identify patterns, trends, and correlations. This step is crucial because it allows you to make informed decisions based on data-driven insights. Choosing the right analytical methods is important to ensure that you get the most out of your data.
Finally, data visualization plays a key role in a data analytics framework. It involves presenting the analyzed data in visual formats such as charts, graphs, and dashboards. Visualization makes it easier for you to understand complex data sets and communicate findings to stakeholders. By creating effective visualizations, you can quickly grasp trends and patterns, facilitating better decision-making.

Preparing for Data Analytics Framework Setup
Identifying Business Goals
The foundation of a successful data analytics framework lies in clearly identifying your business goals. This step ensures that your analytics efforts are strategically aligned with the broader objectives of your organization.
Aligning analytics with business objectives
Aligning analytics with business objectives is essential for deriving meaningful insights that contribute to organizational success. A deep understanding of your company's goals will guide how data analytics can best support them. For example, Siemens leveraged analytics to optimize production processes, resulting in a 20% reduction in production time. Similarly, Amazon utilized data analytics to personalize customer experiences, leading to a significant increase in customer satisfaction. When your analytics framework is aligned with key business objectives, it can drive transformative outcomes and offer a competitive edge.
Setting measurable goals
After aligning your analytics strategy with business goals, it is critical to set measurable and specific targets. These goals provide direction and a way to assess the effectiveness of your analytics initiatives. For example, Bank of America used data analytics to detect and prevent fraudulent activities, reducing fraud-related losses by 50%. Having clear, measurable goals allows for ongoing evaluation and adjustments, ensuring your data-driven efforts continuously deliver value. Establishing these objectives guarantees that your analytics framework generates tangible, impactful results.
Assessing Data Needs
Once business goals are clearly defined, the next crucial step is to assess your data needs. This involves determining both the types of data required and the sources from which this data will be obtained.
Types of data required
Identifying the specific types of data needed is vital for building an effective analytics framework. Different objectives will require different datasets. For example, if your goal is to improve customer engagement, you'll need detailed customer behavior data, such as interaction history, purchase patterns, and preferences. On the other hand, if your focus is on enhancing operational efficiency, process data—such as workflow performance and resource utilization—will be key. Clearly understanding the types of data necessary ensures that your analysis is relevant and directly aligned with your business goals.
Data sources and availability
After identifying the types of data required, the next step is to pinpoint the sources and evaluate their accessibility. Data can be drawn from a variety of sources, including internal databases, external partnerships, or publicly available datasets. It’s crucial to ensure that these data sources are both reliable and accessible. For example, in the e-commerce sector, data from customer transactions and interactions can be leveraged to optimize marketing efforts and predict emerging trends. By thoroughly assessing the availability and quality of your data sources, you establish a strong foundation for your analytics framework, ensuring it has the necessary input to generate valuable insights and drive actionable outcomes.
Setting Up the Data Analytics Framework
Data Collection
To begin setting up your data analytics framework, focus on data collection. This step involves gathering information from various sources like databases, sensors, and online interactions. You must ensure that the data is relevant and of high quality.
Tools and Technologies
You have a variety of tools and technologies at your disposal for data collection. These include data collection tools and data acquisition tools. They help you gather data efficiently and accurately. Consider using platforms that integrate seamlessly with your existing systems to streamline the process.
Data Storage Solutions
Once you collect the data, you need to store it securely. Choose data storage solutions that offer scalability and reliability. Cloud-based storage options like Amazon S3 or Google Cloud Storage provide flexibility and ease of access. Ensure that your storage solution supports the volume and type of data you plan to collect.
Data Processing
After collecting and storing your data, the next step is data processing. This involves preparing the data for analysis by cleaning and transforming it.
Cleaning and Transforming Data
Data cleaning is crucial for removing inconsistencies and errors. You should use tools that automate this process to save time and reduce manual effort. Data transformation involves converting data into a format suitable for analysis. This step ensures that your data is ready for the next stages of the framework.
Ensuring Data Quality
Maintaining high data quality is essential for accurate analysis. Implement checks and data validation to ensure data integrity. Regularly review your data processing methods to identify areas for improvement. High-quality data leads to more reliable insights and better decision-making.
Data Analysis
With clean and well-processed data, you can move on to data analysis. This step involves extracting insights and making sense of the data.
Choosing the Right Analytical Methods
Selecting the appropriate analytical methods is key to successful data analysis. Consider the nature of your data and the insights you wish to gain. Techniques like regression analysis, clustering, and machine learning can be valuable depending on your objectives.

Implementing Analysis Tools
To perform data analysis effectively, you need robust analysis tools. Software like FineBI and FineReport can assist in this process. They offer features for self-service analytics and dynamic reporting. By implementing these tools, you can enhance your ability to derive meaningful insights from your data.
Data Visualization
Data visualization transforms complex data into visual formats, making it easier for you to understand and communicate insights. This step is crucial in a data analytics framework as it helps you present data in a way that is both accessible and actionable.
Selecting Visualization Tools
Choosing the right visualization tools is essential for effective data presentation. You have a variety of options available, each with unique features:
- FineBI: Known for its interactive dashboards and ease of use.
- PowerBI: Offers robust integration with Microsoft products and real-time data updates.
- Google Data Studio: Provides a free, web-based platform for creating dynamic reports.
- Microsoft Excel: A versatile tool for basic data visualization needs.
- Plotly and Infogram: Ideal for creating detailed and interactive charts.
Select a tool that aligns with your data needs and technical expertise. Consider factors like ease of use, integration capabilities, and the types of visualizations you require.
Creating Effective Visualizations
Creating effective visualizations involves more than just selecting the right tools. You need to focus on clarity and simplicity to ensure your audience can easily interpret the data. Here are some tips to guide you:
- Know Your Audience: Tailor your visualizations to meet the needs and understanding level of your audience. Use simple charts for general audiences and more complex visuals for technical stakeholders.
- Choose the Right Chart Type: Different data types require different chart types. Use bar charts for comparisons, line charts for trends over time, and pie charts for proportions.
- Keep It Simple: Avoid clutter by focusing on key data points. Use colors and labels sparingly to highlight important information without overwhelming the viewer.
- Tell a Story: Use your visualizations to tell a story. Start with a clear objective and guide your audience through the data to reach a conclusion.
- Test and Iterate: Gather feedback on your visualizations and make adjustments as needed. Ensure that your visuals effectively communicate the intended message.
By selecting the right tools and focusing on clear, impactful visualizations, you can enhance your data analytics framework and drive better decision-making.
Implementing and Testing of Data Analytics Framework
Before rolling out your data analytics framework organization-wide, it is essential to conduct a thorough pilot testing phase. This helps uncover potential issues and allows for necessary refinements, ensuring smooth and successful implementation.
Pilot Testing
Pilot testing acts as a critical step in mitigating risks and validating the framework’s functionality. By starting with a controlled, smaller-scale test, you can fine-tune the system without impacting broader business operations.
Running Initial Tests
Begin by selecting a specific dataset or focusing on a particular business unit for your initial tests. This limited scope enables you to evaluate the framework’s core components—data collection, processing, analysis, and visualization—without causing disruptions across the entire organization. By doing so, you can verify that these elements integrate effectively, ensuring the framework operates as intended. Testing on a smaller scale minimizes risks while providing clear insights into how well the system functions in real-world conditions.
Gathering Feedback
Following the initial tests, collecting feedback from stakeholders who were part of the pilot phase is crucial. Their practical experience and observations offer valuable insights into the framework’s performance, usability, and overall efficiency. Encourage open dialogue to identify areas of improvement, and consider all suggestions to optimize the framework. This iterative approach ensures that any weaknesses are addressed before full-scale implementation, laying the groundwork for a more robust and refined analytics framework.
Full Implementation
After completing pilot testing and refining your data analytics framework, the next step is to implement it across the organization. This stage is crucial for ensuring that your analytics infrastructure operates efficiently at scale and continues to provide valuable insights.
Scaling the Framework
Scaling the framework involves extending its capabilities organization-wide. As you expand, it's important to ensure your infrastructure can handle the increased data volume, complexity, and variety. Cloud-based solutions such as Amazon S3 and Google Cloud Storage offer scalable and reliable data storage options that accommodate growing data needs without compromising performance. These platforms are especially useful for managing large-scale operations, providing flexibility, enhanced security, and the ability to scale resources up or down as needed. By leveraging such solutions, you can ensure smooth performance even as the volume of data grows.
Continuous Monitoring and Improvement
Successful implementation doesn’t end with the initial rollout; continuous monitoring is essential for ensuring long-term effectiveness. Regularly assess the framework’s performance by tracking key metrics such as data processing speed, accuracy, and insight generation. Automated monitoring tools can help detect potential issues early, allowing for prompt intervention before problems escalate. To maintain a competitive edge, foster a culture of continuous improvement by regularly updating the framework to integrate new technologies, methodologies, or business needs. This ongoing refinement will ensure that your data analytics framework remains dynamic and responsive to emerging trends.
By scaling effectively and maintaining vigilant oversight, your data analytics framework will consistently deliver actionable insights that support data-driven decision-making throughout the organization.
Leveraging FanRuan's Solutions for Data Analytics Framework
In the realm of data analytics, having the right tools can significantly enhance your framework's effectiveness. FanRuan offers a suite of solutions designed to streamline data integration, reporting, and analysis. By leveraging these tools, you can transform complex data into actionable insights, driving innovation and optimizing operations.
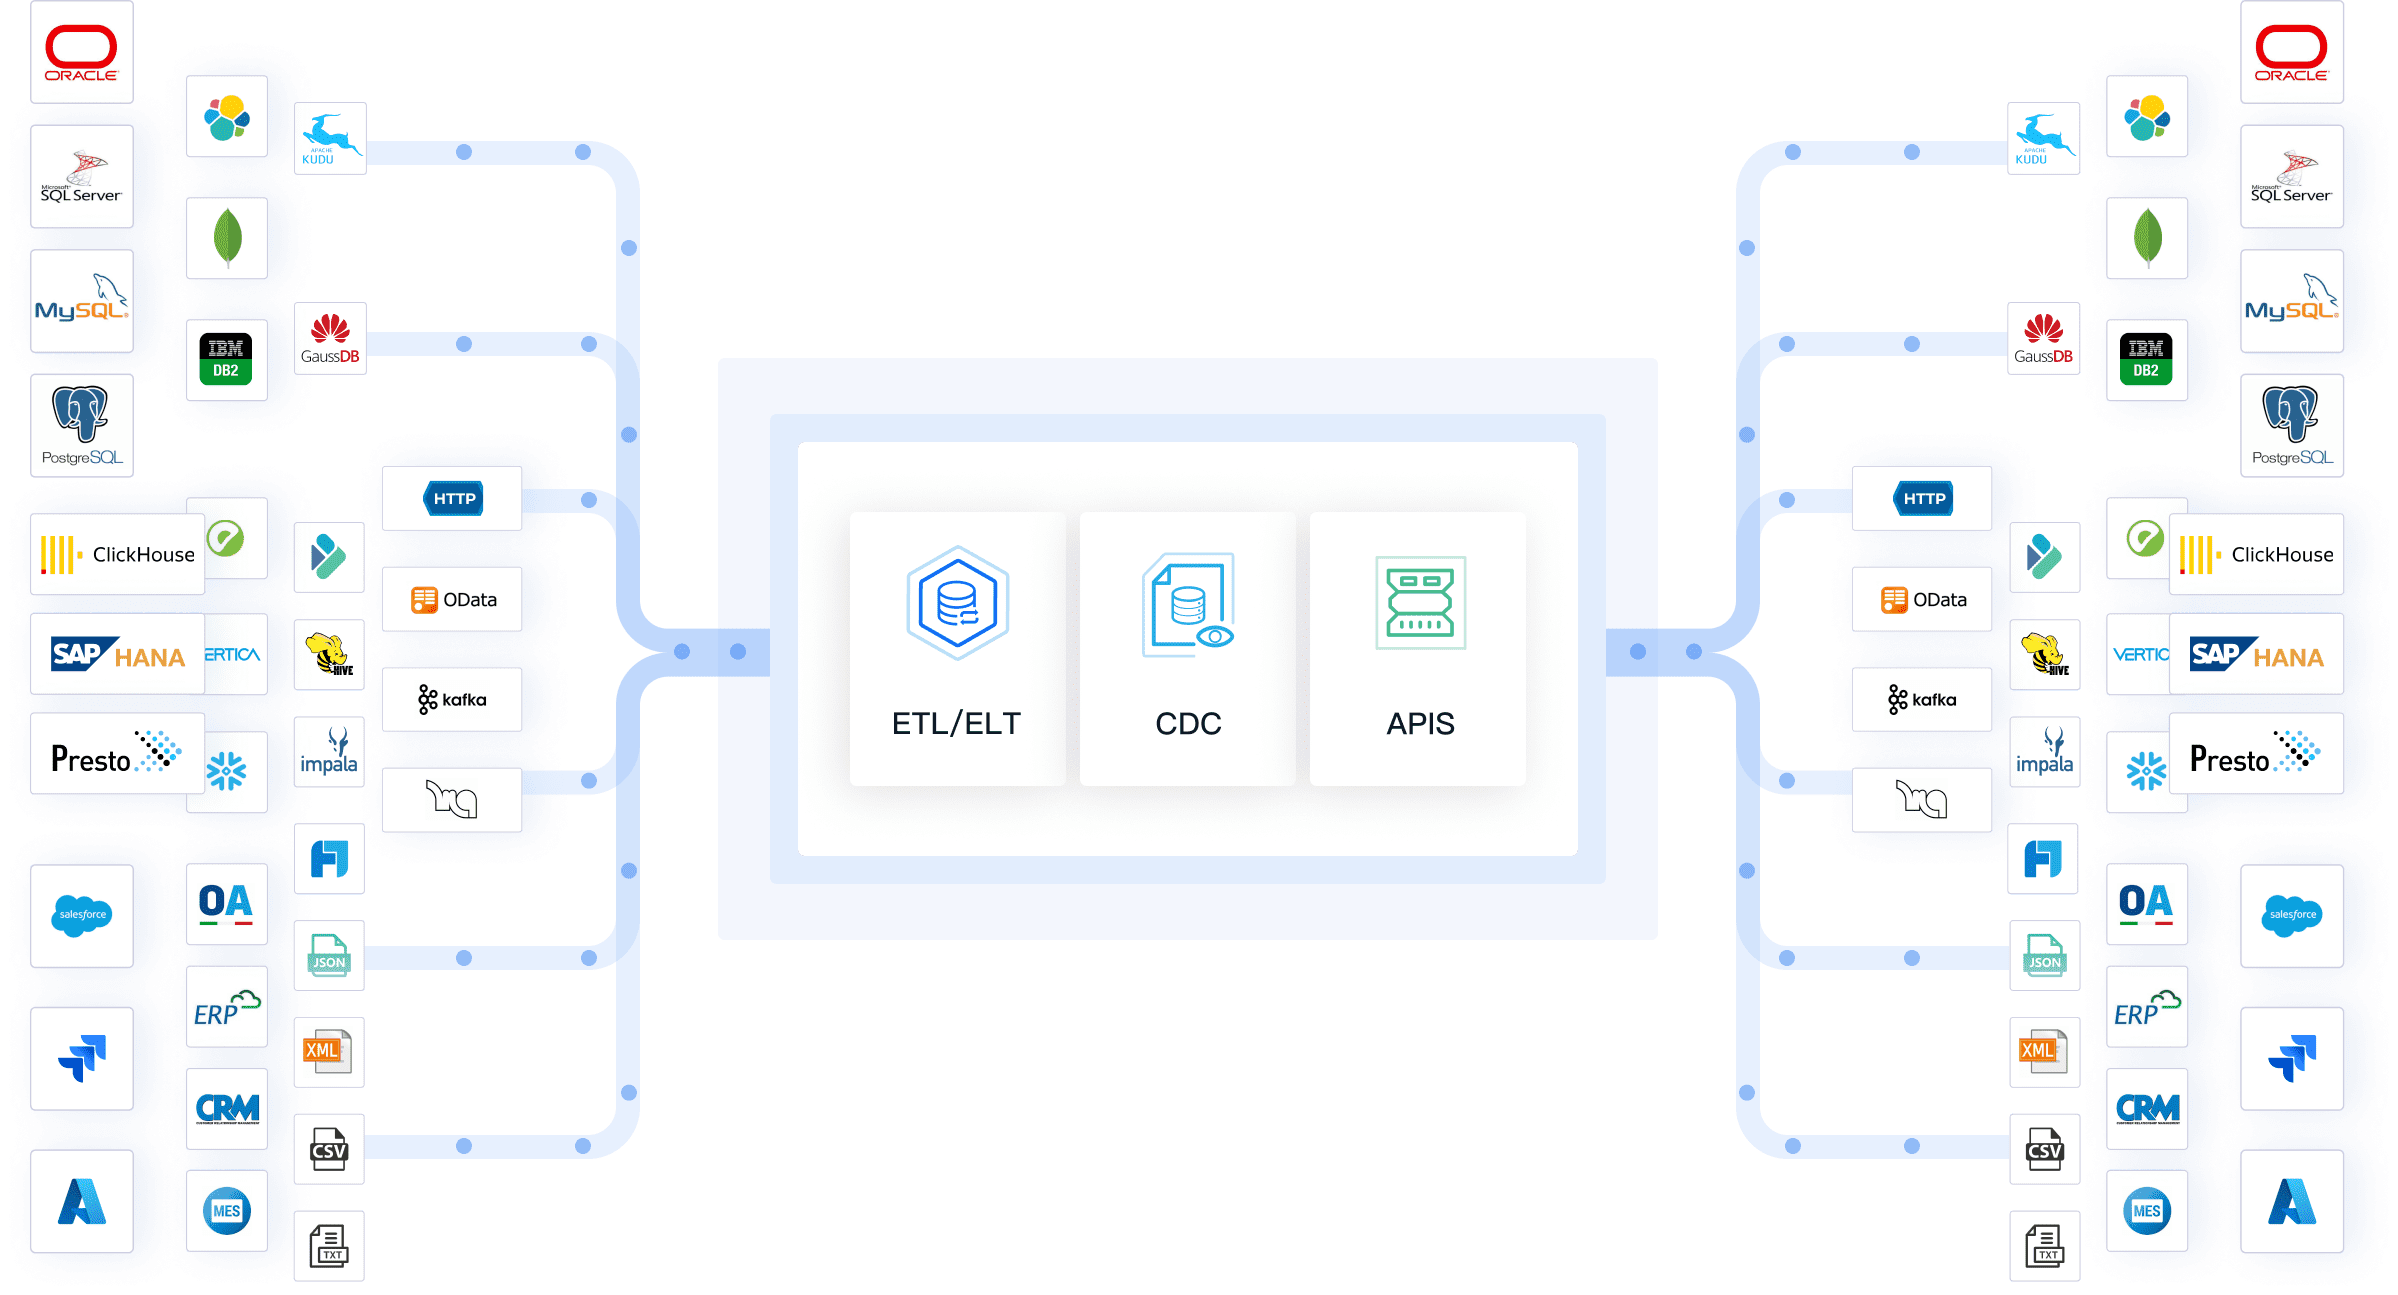
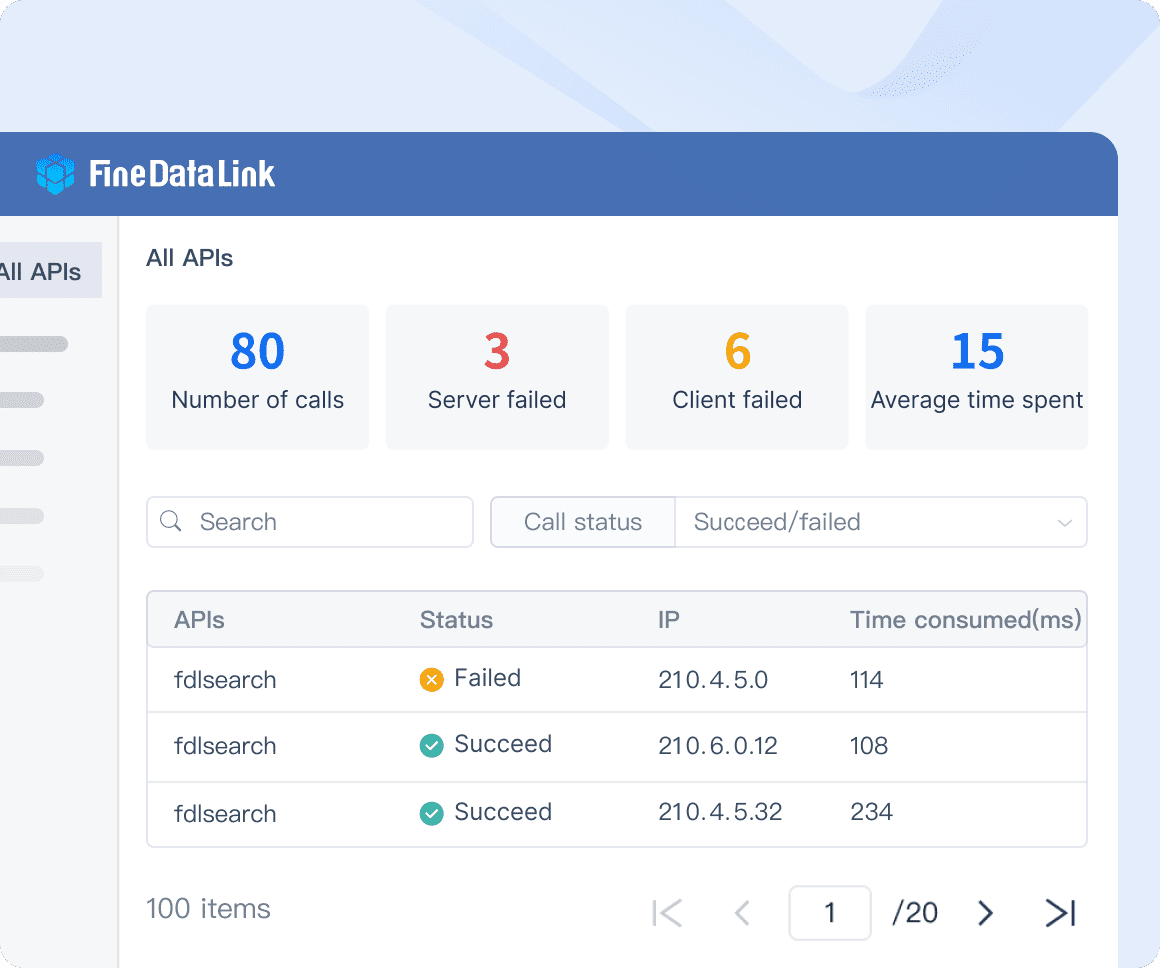
FineDataLink for Data Integration
Efficient data integration forms the backbone of any robust analytics framework. Efficient data integration FineDataLink excels in this area by offering:
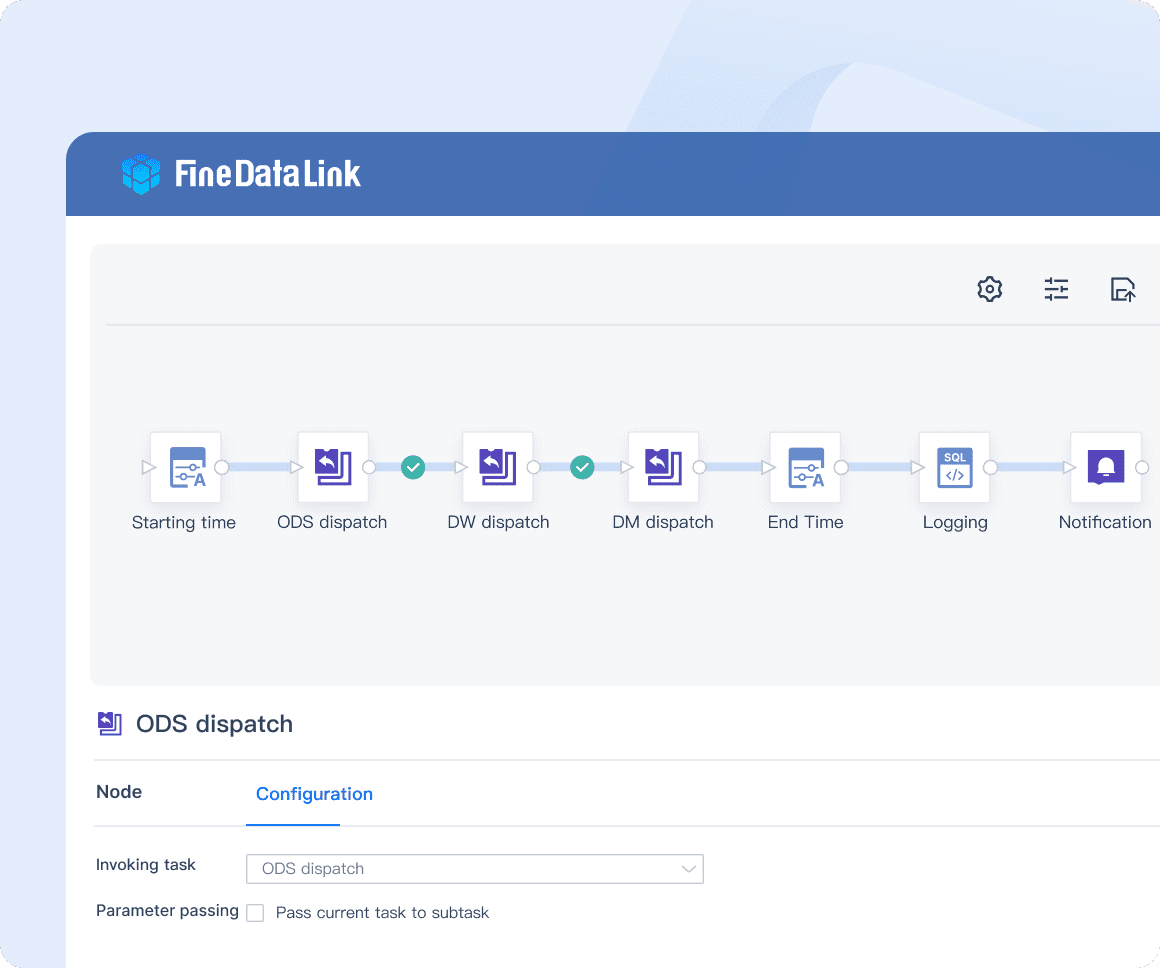
Real-time data synchronization
FineDataLink enables you to synchronize data across multiple sources in real-time. This capability ensures that your data remains up-to-date, allowing you to make timely decisions. Real-time synchronization minimizes latency, providing a seamless flow of information across your systems.
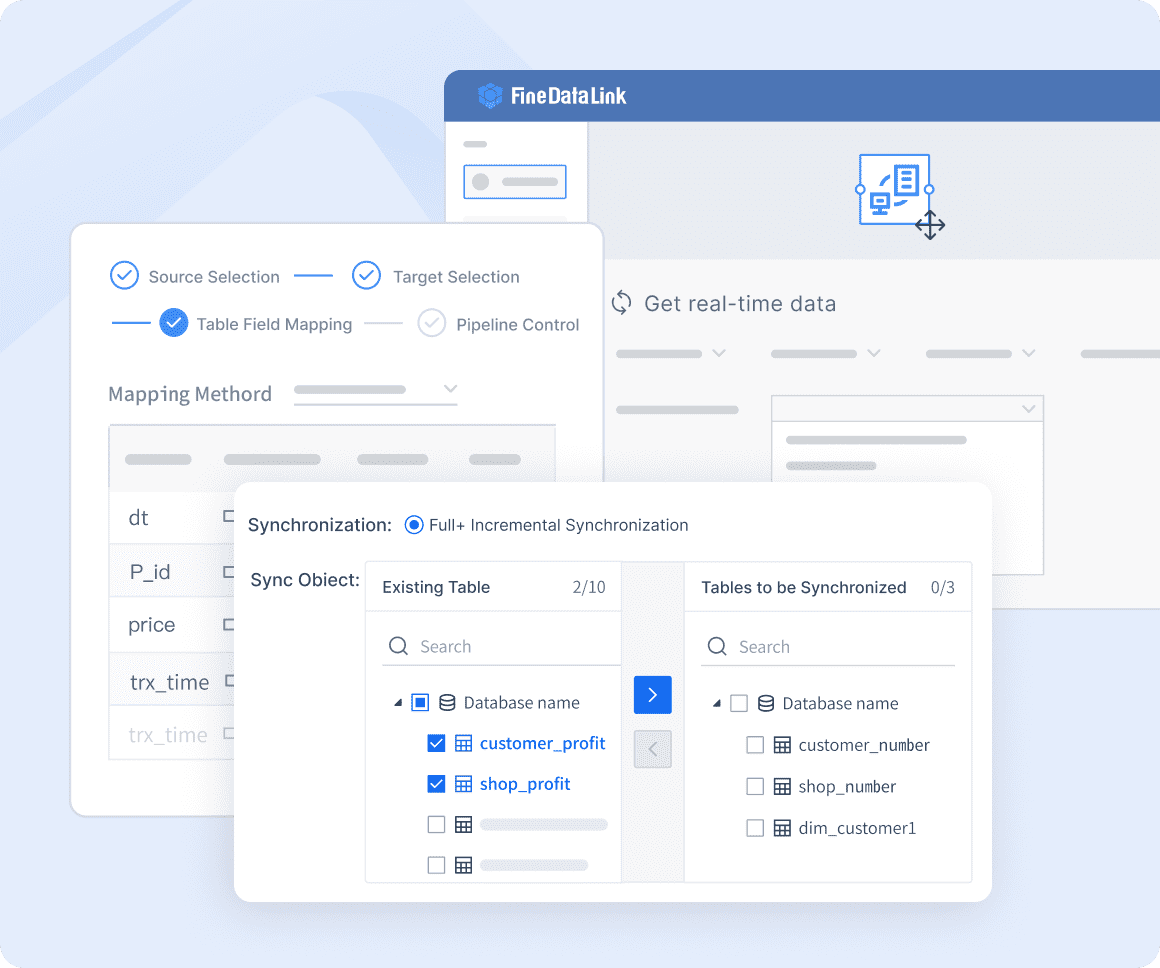
ETL/ELT capabilities
With FineDataLink, you can harness advanced ETL (Extract, Transform, Load) and ELT (Extract, Load, Transform) capabilities. These processes allow you to efficiently prepare data for analysis by transforming it into a usable format. By automating these tasks, FineDataLink reduces manual effort and enhances data quality, ensuring that your analytics framework operates smoothly.
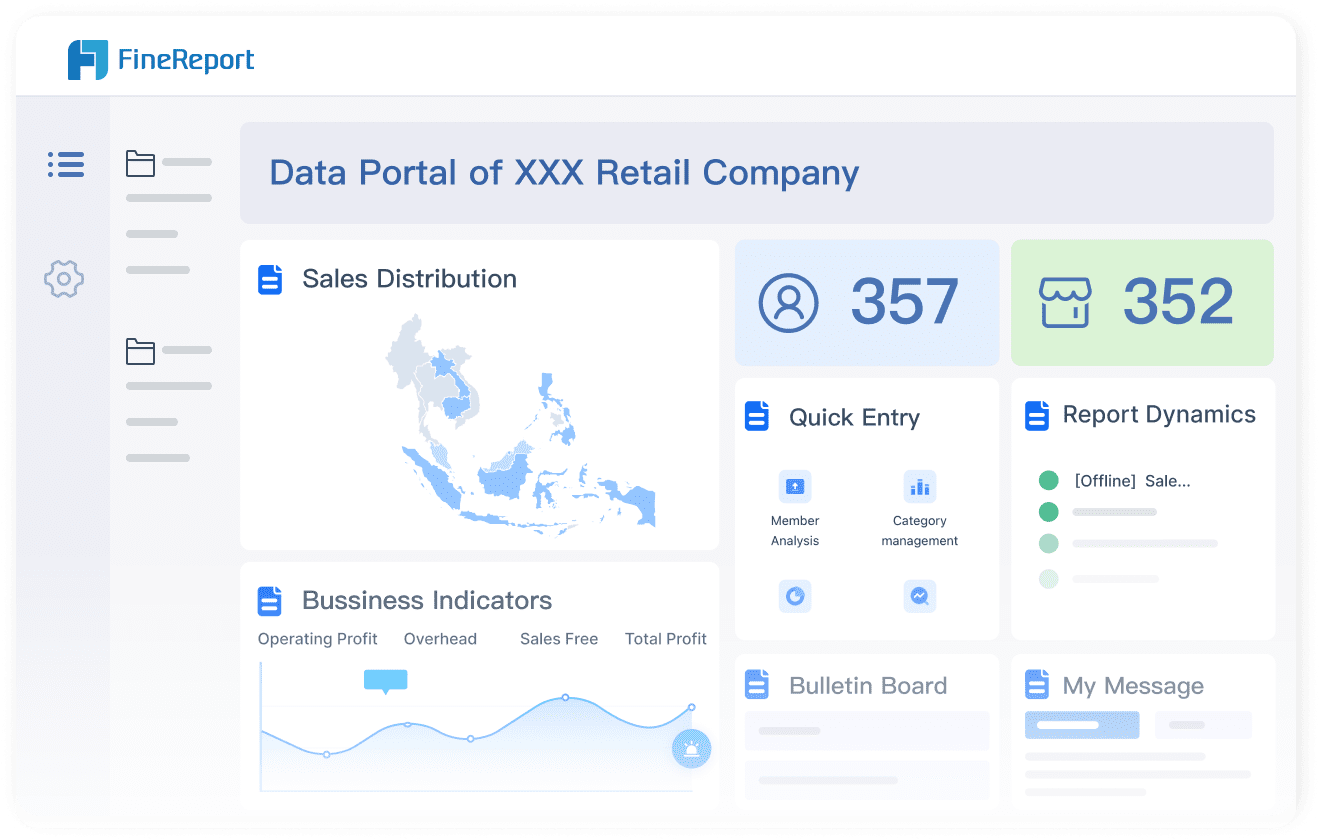
FineReport for Reporting and Visualization
Presenting data in a clear and engaging manner is crucial for effective communication. FineReport offers powerful tools for reporting and visualization:
Creating dynamic reports
FineReport empowers you to create dynamic reports that adapt to your business needs. Its flexible report designer allows you to generate highly formatted documents with ease. By connecting to various data sources, FineReport uncovers deeper insights, enabling you to make informed decisions.
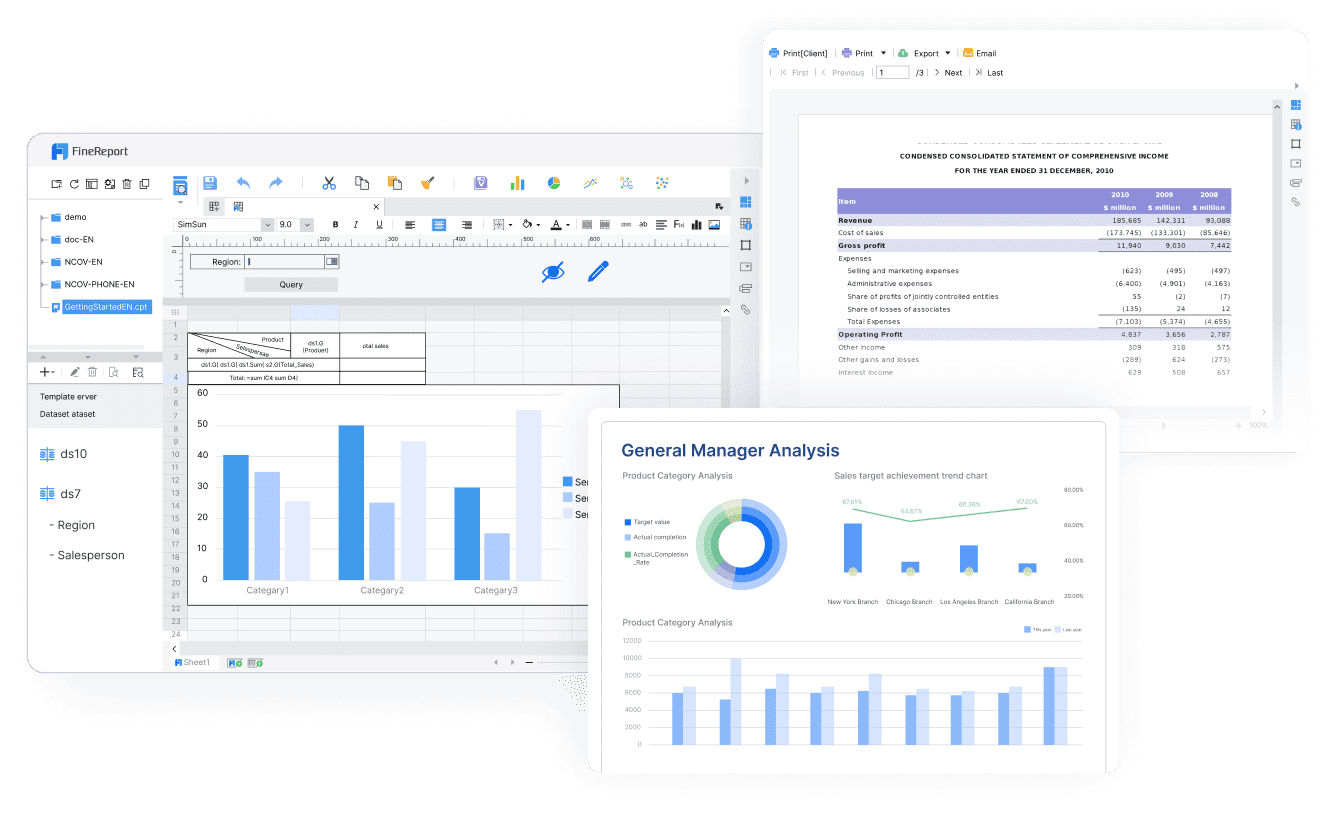
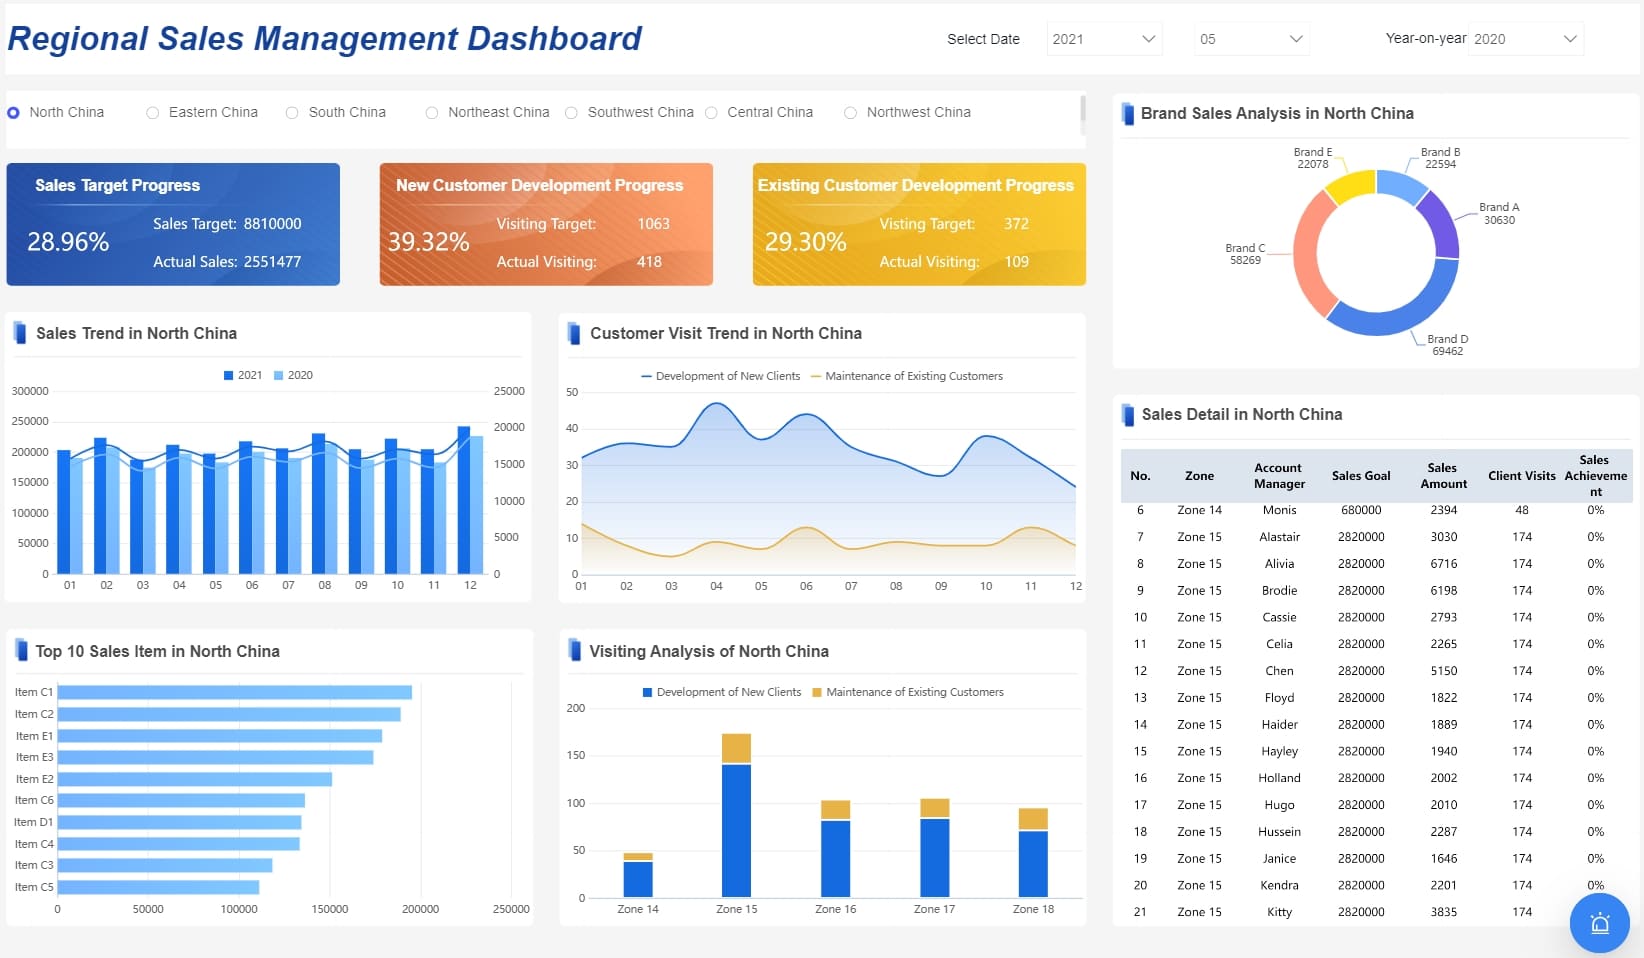
Interactive dashboards
Interactive dashboards are essential for visualizing complex data sets. FineReport provides a range of visualization options, from charts to graphs, that facilitate interactive analysis. These dashboards help you track key performance indicators (KPIs) and identify trends, making data-driven decision-making more accessible.

FineBI for Self-Service Analytics
Empowering users to explore data independently enhances organizational agility. FineBI offers a self-service analytics platform that democratizes data access:

Empowering business users
FineBI enables business users to connect, analyze, and share data without relying on IT support. Its user-friendly interface simplifies data exploration, allowing users to derive insights quickly. By empowering users, FineBI fosters a culture of data-driven decision-making across your organization.

Real-time data analysis
Real-time data analysis is crucial for staying competitive in today's fast-paced environment. FineBI supports real-time analysis, enabling you to respond swiftly to changing conditions. Its high-performance computing engine processes large datasets efficiently, ensuring that you have access to the latest insights when you need them.

By integrating FanRuan's solutions into your data analytics framework, you can unlock hidden patterns and trends, driving innovation and optimizing operations. These tools provide a structured approach to data management, turning complex information into actionable insights that propel your business forward.
Troubleshooting of Data Analytics Framework
Addressing common issues
When implementing a data analytics framework, you may encounter common issues such as data silos, inconsistent data quality, and integration challenges. To address these, focus on robust data integration strategies. Use tools like FineDataLink to centralize and manage data effectively. Regularly validate and clean your data to maintain quality. Ensure that your team is trained to handle these challenges and has access to resources for troubleshooting.
Resources for further help
For further assistance, consider leveraging online resources, forums, and communities dedicated to data analytics. Many software providers offer support and documentation to help you navigate challenges. Engaging with industry experts or consultants can also provide valuable insights. Additionally, case studies and examples from other organizations can offer guidance and inspiration. By utilizing these resources, you can enhance your framework and ensure its success.
Setting up a data analytics framework involves several key steps that guide you through the process. You begin by understanding the framework's components, preparing your data, and implementing the necessary tools. This structured approach is crucial for deriving actionable insights from complex data. By following these steps, you can enhance decision-making and operational efficiency. Now is the time to start implementing your framework. Embrace the power of data analytics to drive innovation and success in your organization.


FAQ

The Author
Howard
Data Management Engineer & Data Research Expert at FanRuan
Related Articles

What Recruiters Look for in a Data Analysis Portfolio: 10 Criteria to Score Yours Fast
A $1 is not judged like a school assignment. It is judged like a hiring shortcut. Recruiters, hiring managers, and analytics leads use it to answer one question fast: Can this person solve business problems with data in
Lewis Chou
May 29, 2026

What Is Data Analytics Consulting? Beginner’s Guide to Services, Deliverables, and Business Value
$1 helps organizations turn raw data into decisions they can trust. For many business leaders, the challenge is not a lack of data. It is a lack of clarity. Reports conflict, teams track different KPIs, dashboards are un
Lewis Chou
Jun 03, 2026

Data Analyst Job Description [+2026 Guide]: Compare Responsibilities, Skills, and Salary by Industry
A strong $1 does more than list tasks. It defines how a company turns raw data into business decisions, which teams the analyst supports, and what measurable outcomes the role is expected to influence. For employers, tha
Lewis Chou
Jun 02, 2026