OLAP reporting tools play a crucial role in business intelligence by allowing you to analyze data from multiple perspectives. Here are the top 12 OLAP reporting tools for business intelligence in 2026:
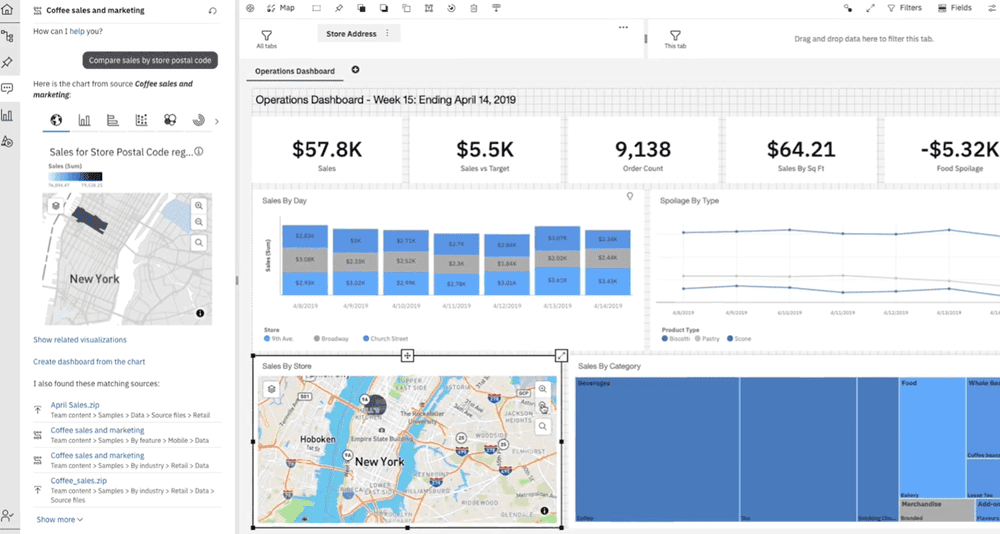
- FineBI
- Tableau
- Microsoft Power BI
- Qlik Sense
- SAP BusinessObjects
- IBM Cognos Analytics
- Oracle Analytics Cloud
- Sisense
- Looker
- Domo
- TIBCO Spotfire
- MicroStrategy
These tools help you make informed decisions quickly and efficiently. As 2026 approaches, selecting the right tool becomes essential for staying competitive. FineBI, for instance, empowers you with self-service analytics and real-time insights, enhancing your ability to transform raw data into actionable information. Choosing the right OLAP tool ensures that your business remains agile and data-driven.
Understanding OLAP Reporting Tools
What are OLAP Reporting Tools?
Definition and Purpose
OLAP reporting tools, or Online Analytical Processing tools, help you analyze complex data sets. They allow you to view data from different angles, making it easier to understand trends and patterns. These tools serve a vital purpose in business intelligence by enabling you to make data-driven decisions. You can use them to explore large volumes of data quickly, which is essential for timely decision-making.
Key Features of OLAP Tools
OLAP tools come with several key features that enhance their functionality. They offer multidimensional analysis, allowing you to slice and dice data for deeper insights. You can perform drill-down operations to explore data at various levels of detail. These tools also support pivoting, which lets you rearrange data to view it from different perspectives. Additionally, OLAP tools provide real-time data processing, ensuring that you work with the most current information available.
Why are OLAP Tools Essential for Business Intelligence?
Benefits of Using OLAP Tools
Using OLAP reporting tools offers numerous benefits for your business intelligence efforts. They improve data accessibility, allowing you to retrieve and analyze data without technical barriers. You gain the ability to conduct complex calculations and generate reports swiftly. This efficiency saves time and resources, enabling you to focus on strategic planning. Moreover, OLAP tools enhance data visualization, making it easier for you to interpret data through charts and graphs.
Impact on Decision Making
OLAP tools significantly impact your decision-making process. They provide you with comprehensive insights, helping you identify opportunities and challenges. With these tools, you can make informed decisions based on accurate data analysis. They enable you to forecast trends and predict outcomes, which is crucial for strategic planning. By using OLAP tools, you ensure that your business remains competitive and agile in a rapidly changing market.
Criteria for Selecting OLAP Reporting Tools
Choosing the right OLAP reporting tools can significantly impact your business intelligence capabilities. You need to consider several factors to ensure that the tool aligns with your business needs and goals.
What to Consider When Choosing a Tool?
Scalability and Performance
Scalability is crucial when selecting an OLAP tool. As your business grows, your data volume will increase. You need a tool that can handle large datasets without compromising performance. FineBI, for example, offers big data analytics capabilities, making it suitable for enterprises with extensive data needs. It supports over 10,000 users for online viewing, ensuring that your team can access and analyze data efficiently.
Performance is equally important. The tool should provide fast data processing and real-time analysis. This ensures that you can make timely decisions based on the most current data. Tools like Domo emphasize AI integration and task automation, which can enhance performance by streamlining data processing tasks.
Integration Capabilities
Integration capabilities determine how well the OLAP tool can connect with your existing systems. You need a tool that supports various data sources, including relational databases, big data platforms, and cloud services. FineBI excels in this area by offering enhanced data integration capabilities. It supports integration with MySQL, Oracle, SQL Server, and more, allowing you to unify data from multiple business systems for comprehensive analysis.

Cost vs. Value
Budget Considerations
Budget plays a significant role in selecting an OLAP tool. You need to evaluate the cost of the tool against your budget constraints. Some tools may offer advanced features but come with a high price tag. It's essential to balance the cost with the features you need. FineReport, for instance, provides rich functions and scalability, making it a cost-effective choice for budgeting and personnel management.

Long-term Value
While initial costs are important, you should also consider the long-term value of the tool. A tool that offers scalability, integration, and performance will provide more value over time. It will support your business as it grows and evolves. FineBI offers self-service analytics and agility, which can enhance your data analysis capabilities and provide long-term benefits. By investing in a tool that aligns with your strategic goals, you ensure that your business remains competitive and data-driven.
Top 12 OLAP Reporting Tools for 2026
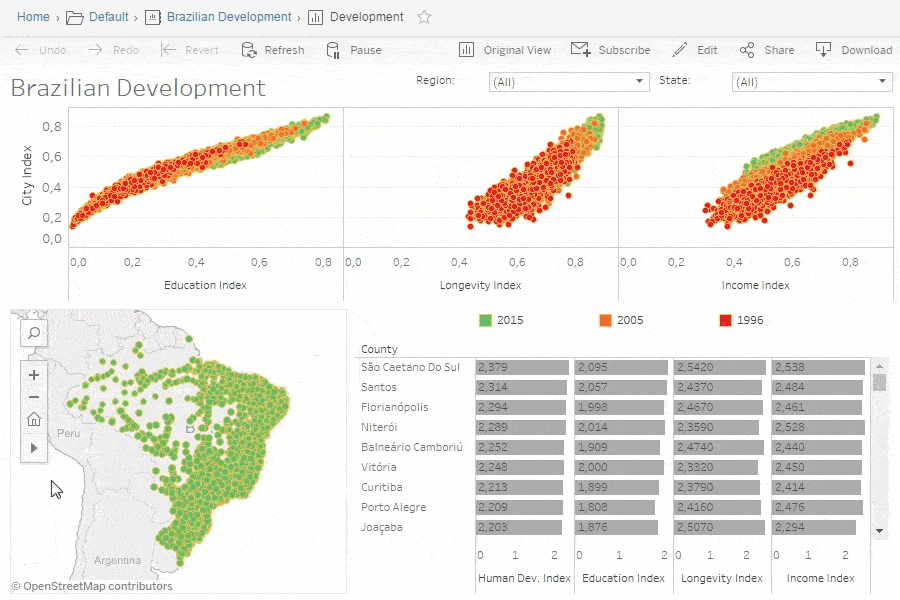
Tool 1: FanRuan FineBI
Overview and Features
FineBI stands out as a powerful OLAP reporting tool designed to empower users with self-service analytics. It offers a seamless data-driven cycle, enabling you to connect, analyze, and share data across your organization. FineBI's agility and "do it yourself" feature make it highly suitable for enterprises seeking to enhance their data analysis capabilities. The tool provides intuitive analysis tools and an enterprise-level platform, facilitating timely visualization and refined analysis. With FineBI, you can transform raw data into insightful visualizations, track KPIs, and predict future outcomes, reshaping the digital culture of your business.

- Key Features:
- Self-service analytics
- Real-time data processing
- High-performance computing engine
- Flexible ETL and ELT data processing modes
- Role-based access control

Pros and Cons
Pros:
- Empowers users with self-service analytics
- Supports real-time data analysis
- Enhances data visualization and interpretation
- Offers robust integration capabilities with various data sources
Cons:
- May require initial training for users unfamiliar with BI tools
- Advanced features might be overwhelming for small businesses
Tool 2: Tableau
Overview and Features
Tableau is renowned for its advanced data visualization capabilities. It allows you to create interactive and shareable dashboards, providing insights into your data. Tableau supports a wide range of data sources, making it a versatile choice for businesses of all sizes. Its drag-and-drop interface simplifies the process of creating complex visualizations, enabling you to explore data from multiple perspectives.
- Key Features:
- Interactive dashboards
- Extensive data source support
- Drag-and-drop interface
- Real-time data analysis
- Advanced data visualization options
Pros and Cons
Pros:
- User-friendly interface
- Strong data visualization capabilities
- Supports a wide range of data sources
- Facilitates real-time data analysis
Cons:
- Can be expensive for small businesses
- Requires a learning curve for advanced features
Tool 3: Microsoft Power BI
Overview and Features
Microsoft Power BI offers a comprehensive suite of business analytics tools. It enables you to visualize data and share insights across your organization. Power BI integrates seamlessly with other Microsoft products, enhancing its functionality and ease of use. The tool provides real-time data access and supports advanced data visualization, making it a popular choice for businesses seeking to leverage their data effectively.
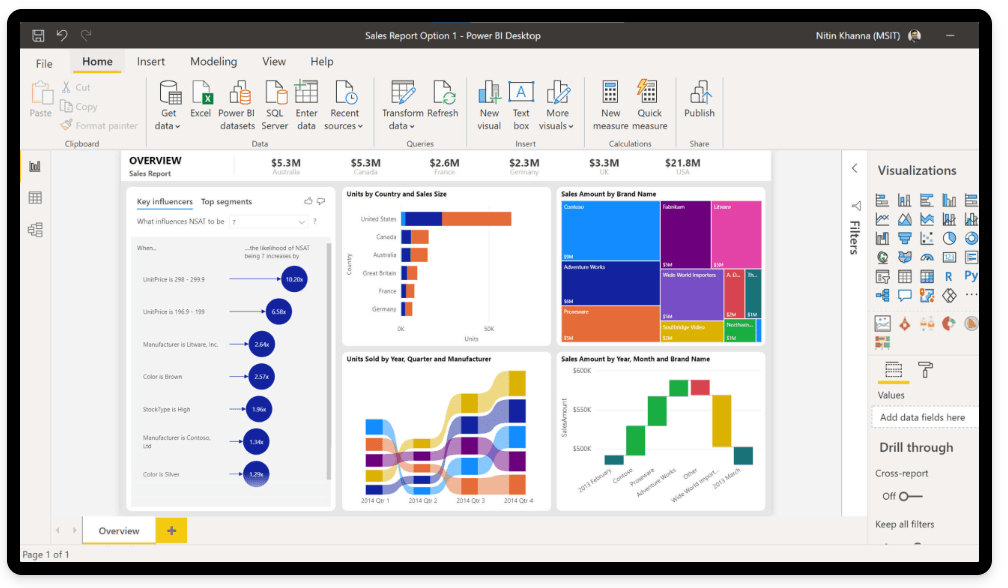
- Key Features:
- Seamless integration with Microsoft products
- Real-time data access
- Advanced data visualization
- Customizable dashboards
- AI-powered insights
Pros and Cons
Pros:
- Integrates well with Microsoft ecosystem
- Offers real-time data access
- Provides AI-powered insights
- Customizable and interactive dashboards
Cons:
- Limited customization options for non-Microsoft data sources
- Can be complex for beginners
Tool 4: Qlik Sense
Overview and Features
Qlik Sense offers a robust platform for data visualization and analysis. It empowers you to create interactive reports and dashboards, providing a comprehensive view of your data. The tool's associative engine allows you to explore data freely, uncovering hidden insights without predefined queries. You can connect to various data sources, ensuring seamless integration with your existing systems. Qlik Sense also supports real-time data analysis, enabling you to make informed decisions quickly.
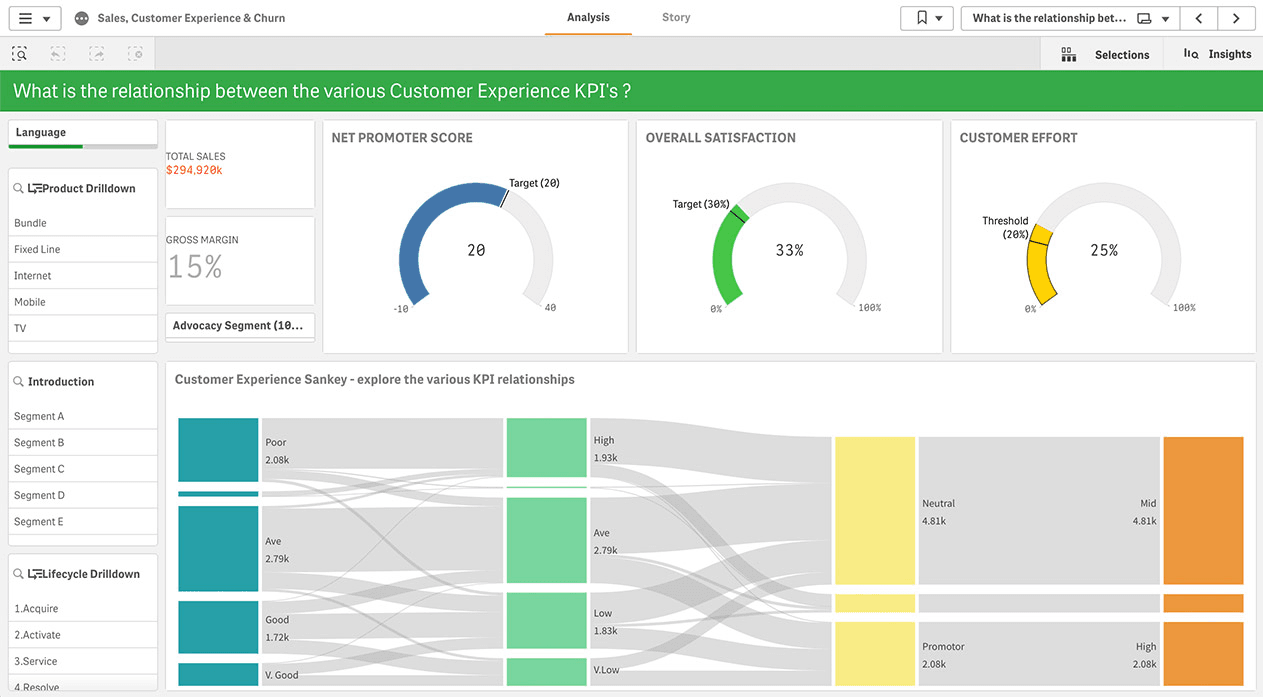
- Key Features:
- Associative data engine
- Interactive dashboards
- Real-time data analysis
- Extensive data source connectivity
- Self-service data discovery
Pros and Cons
Pros:
- Facilitates self-service data exploration
- Offers powerful data visualization capabilities
- Supports a wide range of data sources
- Provides real-time insights
Cons:
- May require training for new users
- Can be resource-intensive for large datasets
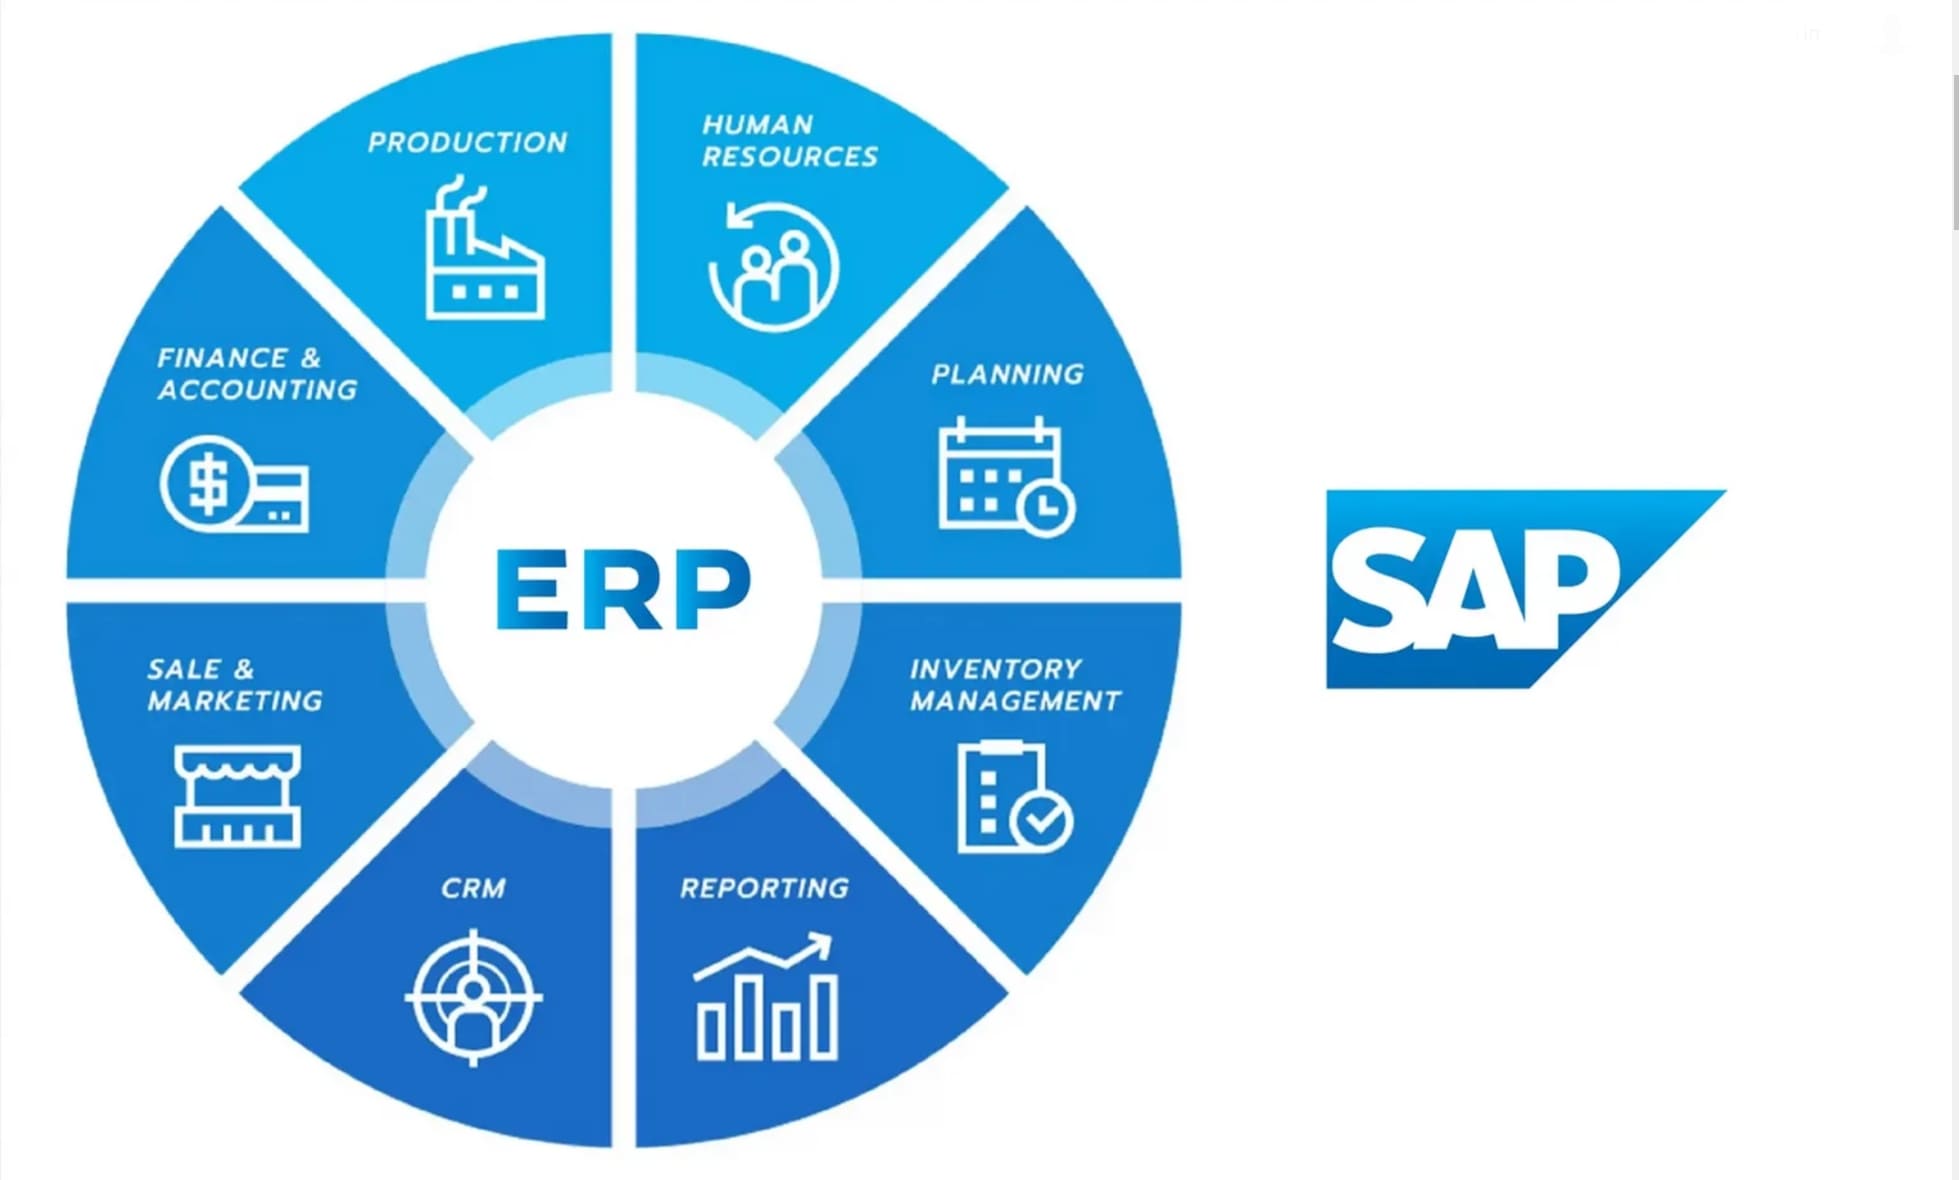
Tool 5: SAP BusinessObjects
Overview and Features
SAP BusinessObjects is a comprehensive suite of business intelligence tools designed to help you analyze and visualize data effectively. It provides a centralized platform for reporting, allowing you to create detailed reports and dashboards. The tool supports a variety of data sources, making it versatile for different business needs. With SAP BusinessObjects, you can perform ad-hoc reporting and analysis, enabling you to respond to business queries promptly.
- Key Features:
- Centralized reporting platform
- Ad-hoc reporting capabilities
- Integration with various data sources
- Advanced data visualization options
- Scalable architecture
Pros and Cons
Pros:
- Offers a wide range of reporting tools
- Supports complex data analysis
- Integrates well with SAP ecosystem
- Scalable for large enterprises
Cons:
- Can be complex for beginners
- Requires significant setup and maintenance
Tool 6: IBM Cognos Analytics
Overview and Features
IBM Cognos Analytics provides a powerful platform for business intelligence and data analysis. It enables you to create interactive dashboards and reports, offering deep insights into your data. The tool's AI-driven capabilities enhance data exploration, allowing you to uncover patterns and trends effortlessly. You can connect to multiple data sources, ensuring comprehensive data integration. IBM Cognos Analytics also supports collaborative analytics, enabling teams to work together on data projects.
- Key Features:
- AI-driven data exploration
- Interactive dashboards and reports
- Collaborative analytics
- Extensive data source connectivity
- Customizable visualizations
Pros and Cons
Pros:
- Enhances data exploration with AI
- Supports collaborative data analysis
- Offers customizable visualization options
- Integrates with various data sources
Cons:
- May have a steep learning curve
- Can be costly for small businesses
Tool 7: Oracle Analytics Cloud
Overview and Features
Oracle Analytics Cloud offers a comprehensive suite of tools for data analysis and visualization. It empowers you to explore data through interactive dashboards and reports. The platform supports a wide range of data sources, ensuring seamless integration with your existing systems. With Oracle's advanced analytics capabilities, you can perform predictive analysis and gain insights into future trends.
- Key Features:
- Interactive dashboards
- Predictive analytics
- Extensive data source integration
- AI-driven insights
- Scalable architecture
Pros and Cons
Pros:
- Offers robust predictive analytics
- Integrates well with various data sources
- Provides AI-driven insights
- Scalable for growing businesses
Cons:
- Can be complex for new users
- May require significant investment
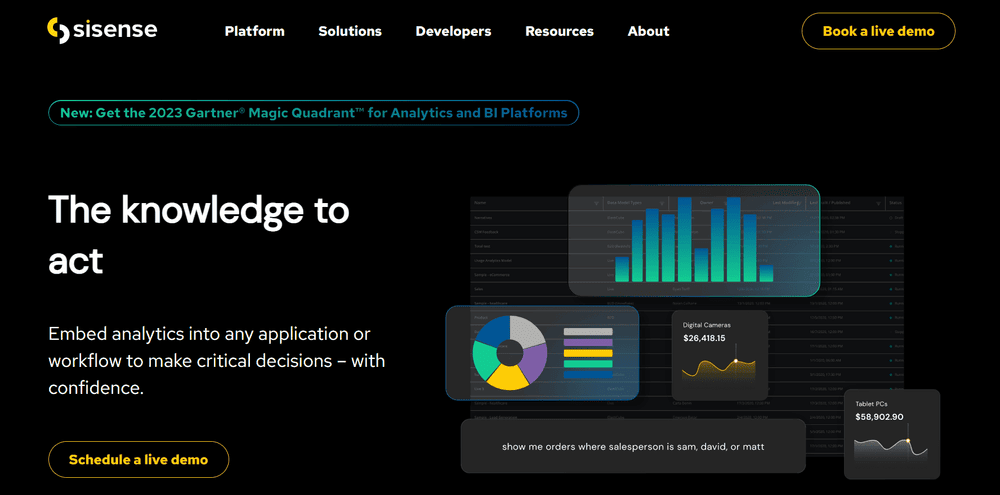
Tool 8: Sisense
Overview and Features
Sisense is known for its ability to handle large datasets efficiently. It provides a user-friendly interface that allows you to create interactive visualizations and dashboards. Sisense's in-chip technology accelerates data processing, enabling real-time analysis. You can connect to multiple data sources, making it a versatile choice for businesses seeking comprehensive OLAP reporting tools.
- Key Features:
- In-chip data processing
- Real-time analytics
- User-friendly interface
- Extensive data source connectivity
- Customizable dashboards
Pros and Cons
Pros:
- Efficiently handles large datasets
- Offers real-time data processing
- User-friendly interface
- Supports a wide range of data sources
Cons:
- May require training for advanced features
- Can be resource-intensive
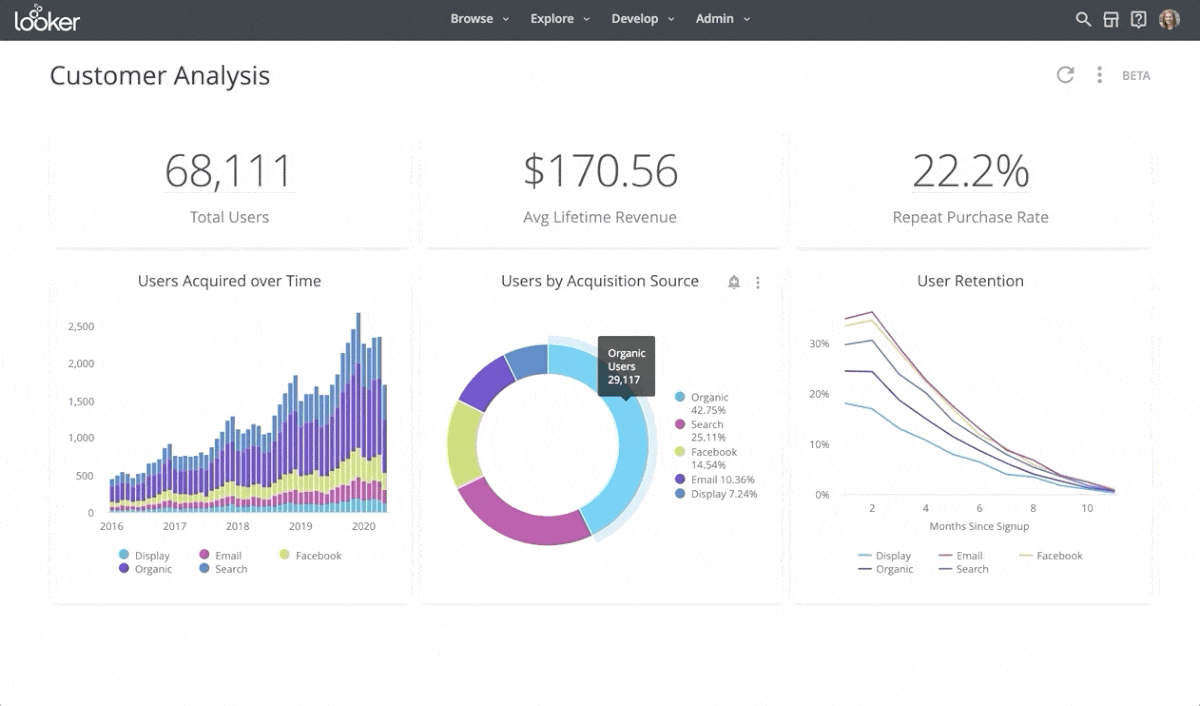
Tool 9: Looker
Overview and Features
Looker provides a modern approach to data analytics. It enables you to create dynamic dashboards and reports, offering deep insights into your data. Looker's unique modeling language, LookML, allows you to customize data exploration. The platform integrates seamlessly with various data sources, ensuring a unified view of your business intelligence.
- Key Features:
- Dynamic dashboards
- LookML for data modeling
- Seamless data integration
- Real-time data exploration
- Collaborative analytics
Pros and Cons
Pros:
- Offers customizable data modeling
- Facilitates real-time data exploration
- Integrates with multiple data sources
- Supports collaborative analytics
Cons:
- Requires learning LookML for customization
- Can be costly for small businesses
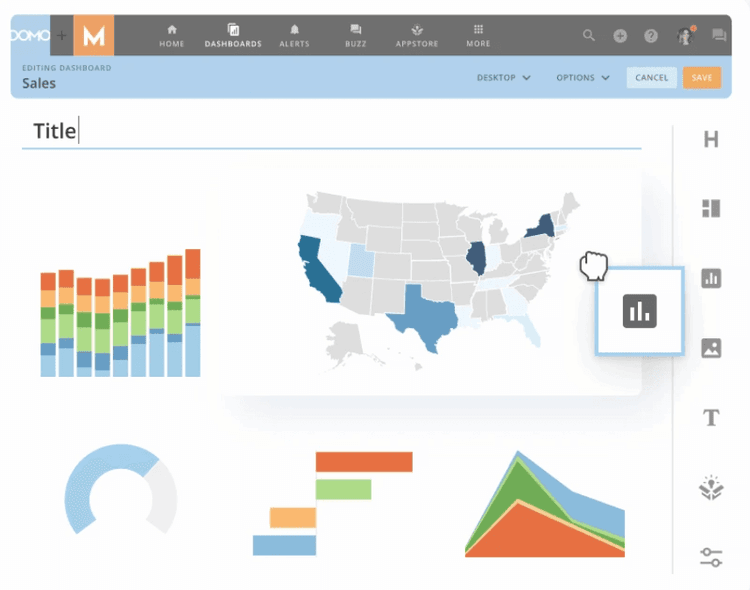
Tool 10: Domo
Overview and Features
Domo offers a comprehensive platform for business intelligence and data visualization. It empowers you to connect, prepare, and visualize data in real-time. With its cloud-based architecture, Domo ensures seamless integration with various data sources, providing a unified view of your business metrics. The platform's intuitive interface allows you to create interactive dashboards and reports, enhancing your ability to make data-driven decisions.
- Key Features:
- Real-time data integration
- Cloud-based architecture
- Interactive dashboards
- Extensive data source connectivity
- AI-powered insights
Pros and Cons
Pros:
- Facilitates real-time data analysis
- Offers a user-friendly interface
- Supports a wide range of data sources
- Provides AI-driven insights
Cons:
- Can be costly for small businesses
- May require training for advanced features
Tool 11: TIBCO Spotfire
Overview and Features
TIBCO Spotfire excels in providing advanced analytics and data visualization capabilities. It enables you to explore data interactively, uncovering insights through dynamic dashboards. Spotfire supports predictive analytics, allowing you to forecast trends and outcomes. Its robust integration capabilities ensure that you can connect to various data sources, making it a versatile choice for businesses seeking comprehensive OLAP reporting tools.
- Key Features:
- Predictive analytics
- Interactive data exploration
- Dynamic dashboards
- Extensive data source integration
- Customizable visualizations
Pros and Cons
Pros:
- Offers powerful predictive analytics
- Facilitates interactive data exploration
- Integrates with multiple data sources
- Provides customizable visualization options
Cons:
- May have a steep learning curve
- Can be resource-intensive
Tool 12: MicroStrategy
Overview and Features
MicroStrategy provides a robust platform for enterprise analytics and mobility. It empowers you to create detailed reports and dashboards, offering deep insights into your data. MicroStrategy's advanced analytics capabilities enable you to perform complex calculations and generate comprehensive reports. The platform supports a wide range of data sources, ensuring seamless integration with your existing systems.
- Key Features:
- Enterprise analytics
- Mobile analytics capabilities
- Detailed reporting
- Advanced data visualization
- Extensive data source support
Pros and Cons
Pros:
- Offers enterprise-level analytics
- Supports mobile analytics
- Provides detailed reporting capabilities
- Integrates with various data sources
Cons:
- Can be complex for beginners
- Requires significant investment
OLAP reporting tools play a vital role in enhancing your business intelligence capabilities. They empower you to analyze data from multiple perspectives, leading to informed decision-making. As you navigate the landscape of business intelligence in 2026, carefully evaluate these tools to find the one that aligns with your specific needs. Consider factors like scalability, integration, and cost-effectiveness. By choosing the right OLAP tool, you ensure that your business remains agile and competitive, ready to tackle the challenges of a data-driven world.
Continue Reading About Reporting Tools
Top 15 AWS Reporting Tools for Effective Cost Management


The Author
Lewis
Senior Data Analyst at FanRuan
Related Articles

Financial Reporting Valuation Explained: A Practical Guide to ASC 820, ASC 805, ASC 350, and ASC 718
$1 valuation is the process companies use to measure assets, liabilities, equity instruments, and reporting units for compliant $1. For CFOs, controllers, finance directors, and audit facing accounting teams, the challen
Yida Yin
Jun 25, 2026

Best Ad Reporting Tool in 2026: 8 Options Compared for Marketers and Analysts
$1 is an $1 and dashboard platform that helps teams unify ad data, build highly customized reports, and automate distribution at scale. 8 ad reporting tool options compared 1. DashThis One sentence overview: DashThis is
Yida YIn
Jun 25, 2026
Office 365 Reporting Tool Guide: Track Usage, Security, and License Waste in One Dashboard
An office 365 $1 should do more than generate static usage charts. For IT managers, operations leaders, and Microsoft 365 administrators, the real value is operational visibility: who is actually using the platform, wher
Yida Yin
Jun 25, 2026