A Gantt chart is a visual tool that helps you manage projects by organizing tasks, timelines, and dependencies. It displays activities as horizontal bars on a timeline, making it easy to understand the sequence and duration of tasks. Many project managers rely on this tool because it simplifies planning and tracking. For example, a survey found that 83.9% of users encountered no major challenges when using Gantt charts to monitor progress. Additionally, this method reduces costs and improves deadline reliability. This guide will teach you how to create a Gantt chart in Malay with simple steps and examples.
All the gantt chart templates shown in this article are created by FineReport, a powerful reporting software that has been honorably mentioned by Gartner Magic Quadrant for ABI Platforms. You can download FineReport for free and have a try!
Key Takeaways
- A Gantt chart shows tasks and timelines clearly. It helps manage projects better and faster.
- Using a Gantt chart in Malay makes things clearer. It also helps teams avoid confusion when using their own language.
- To make a Gantt chart in Malay, follow simple steps. Start with a template, then add tasks, dates, and links between tasks.
- Make your Gantt chart in Malay look nice with colors, easy-to-read fonts, and important markers. This makes it easier to use.
- Pick the best tool for your project. Excel works for simple charts, while FineReport is better for harder projects.
Benefits of Using a Gantt Chart in Malay
Better Task Organization
A Gantt chart helps you organize tasks effectively by breaking down complex projects into smaller, manageable parts. Each task is displayed as a horizontal bar, showing its start and end dates. This visual layout allows you to prioritize activities and allocate resources efficiently. For example, if you manage a marketing campaign, you can divide it into tasks like content creation, social media scheduling, and performance analysis. By assigning deadlines to each task, you ensure that nothing gets overlooked.
Moreover, a Gantt chart in Malay can make task management even more accessible for teams who prefer working in their native language. This approach ensures clarity and reduces miscommunication, especially in multilingual environments.
Clear Timeline Visualization
Timelines are crucial for project success. A Gantt chart in Malay provides a clear view of your project’s timeline, helping you track progress and identify potential delays. Each bar on the chart represents a task, and its position on the timeline shows when the task begins and ends. This visual representation makes it easier to understand how tasks overlap or depend on each other.
For instance, if one task gets delayed, you can immediately see how it affects subsequent tasks. This insight allows you to adjust schedules and avoid missing deadlines. Additionally, the ability to visualize timelines in Malay ensures that all team members, regardless of their language preference, can follow the project plan effortlessly.
Improved Team Collaboration and Accountability
A Gantt chart fosters better collaboration by providing a shared platform where everyone can see their responsibilities. When team members know their roles and deadlines, they work more efficiently and stay accountable. The chart also highlights task dependencies, ensuring that everyone understands how their work impacts others.
The following table illustrates how Gantt charts improve collaboration and accountability:
| Feature | Benefit |
|---|---|
| Visual timelines | Helps track task progress and dependencies. |
| Clear view of schedules | Enhances understanding of project timelines. |
| Highlights potential delays | Improves accountability by showing dependencies. |
By using a Gantt chart in Malay, you create a transparent work environment where everyone stays informed. This transparency reduces misunderstandings and promotes teamwork. Whether you’re managing a construction project or planning an event, a Gantt chart in Malay can help your team stay aligned and achieve goals efficiently.
Step-by-Step Guide to Creating a Gantt Chart in Malay
Step 1: Template Preparation
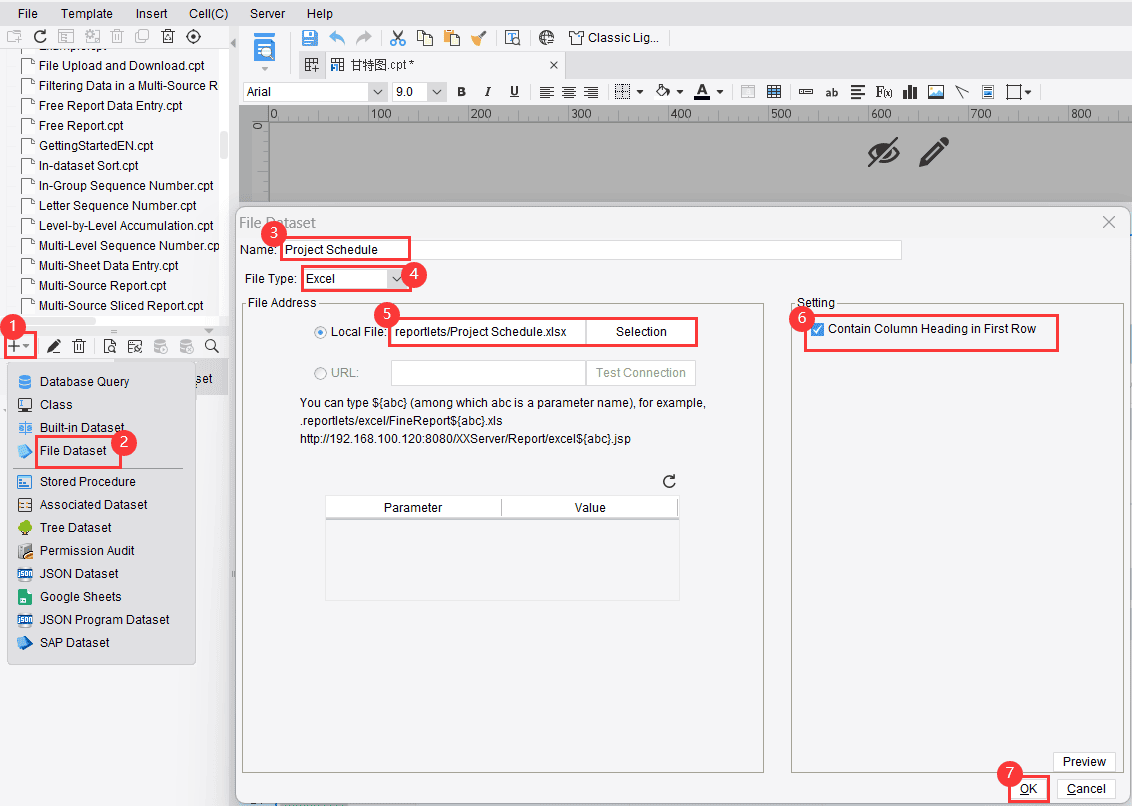
To start creating a gantt chart in Malay, you need a template that serves as the foundation. Templates simplify the process by providing a pre-designed structure for your chart. You can find templates in tools like Excel or FineReport.
- Open your chosen software and search for Gantt chart templates.
- Select a template that matches your project requirements. For example, if your project involves multiple milestones, choose a template with milestone indicators.
- Customize the template to fit your needs. Change the language settings to Malay if the software supports it.
Tip: Using a template saves time and ensures consistency. If you're new to Gantt chart in Malay, start with a basic template to avoid overwhelming yourself.
Step 2: Chart Insert
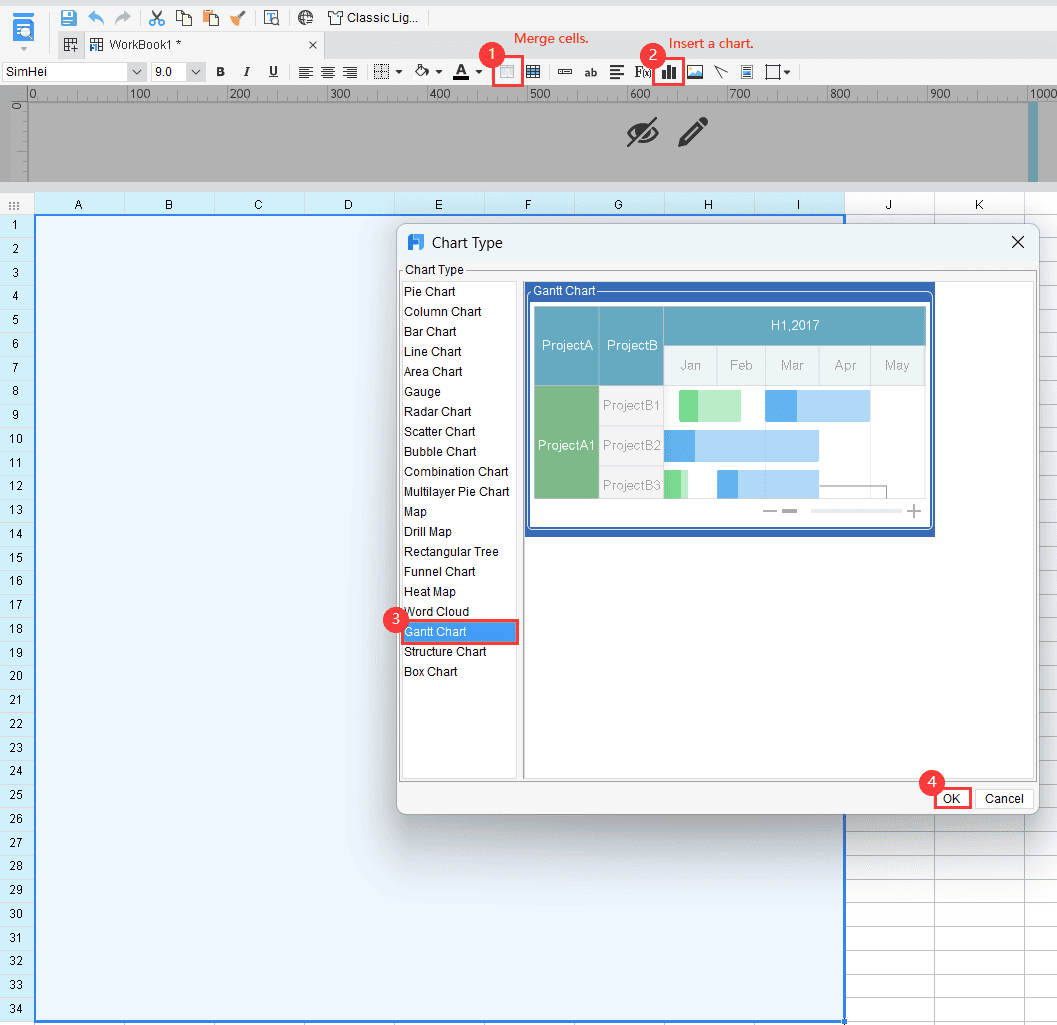
Once your template is ready, insert the Gantt chart into your workspace. This step involves adding the chart to your document or dashboard.
- Locate the "Insert Chart" option in your software.
- Choose "Gantt Chart" from the list of chart types.
- Place the chart in your workspace. Adjust its size and position for better visibility.
Some tools, like FineReport, offer advanced features for inserting Gantt charts. These features include customizable headers and color schemes. If you're using Excel, you can manually create a Gantt chart in Malay by formatting a bar chart.
Note: Ensure the chart is in Malay to make it accessible for your team. This step is crucial for projects involving multilingual teams.
Step 3: Chart Data

The next step is to input data into your Gantt chart. This data includes tasks, start and end dates, progress, and dependencies.
- List all tasks involved in your project. For example, if you're planning an event, tasks might include venue booking, catering, and guest invitations.
- Enter the start and end dates for each task. Use a timeline format to visualize the duration of activities.
- Add progress indicators to track completion. For instance, you can use percentages to show how much of a task is done.
- Define dependencies between tasks. If one task relies on another, link them in the chart.
| Data Item | Example |
|---|---|
| Task Name | Venue Booking |
| Start Date | 01/11/2023 |
| End Date | 05/11/2023 |
| Progress | 50% |
| Dependencies | Catering depends on Venue Booking |
Tip: Double-check your data for accuracy. Errors in task dates or dependencies can lead to project delays.
By following these steps, you can create a gantt chart in Malay that is both functional and visually appealing. This chart will help you manage your project efficiently and keep your team aligned.
Step 4: Chart Style
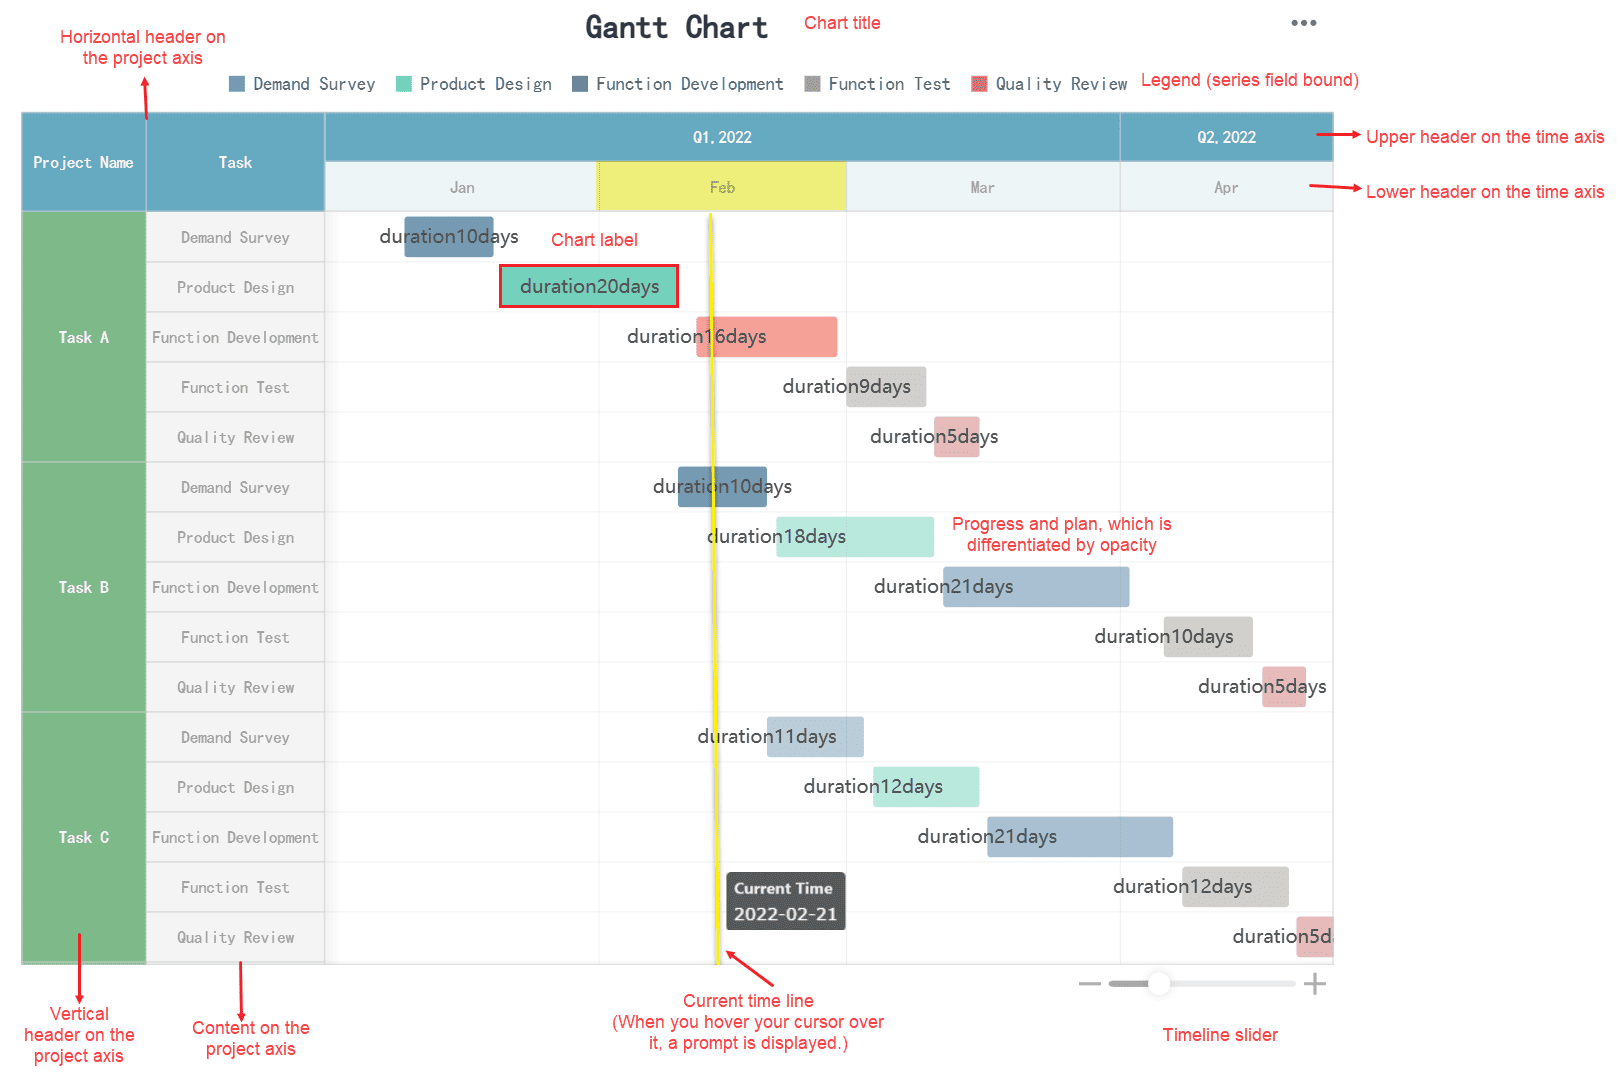
Styling your Gantt chart in Malay is essential to make it visually appealing and easy to interpret. A well-designed chart improves usability and ensures that your team can quickly understand the project timeline. Here’s how you can enhance the style of your Gantt chart:
- Choose a Clear Color Scheme: Use distinct colors to represent different tasks or categories. For example, assign one color to marketing tasks and another to development tasks. This approach helps your team differentiate between activities at a glance.
- Highlight Milestones: Mark important milestones with unique symbols or colors. This makes it easier to identify key dates and track progress toward major goals.
- Adjust Font Sizes and Styles: Use readable fonts for task names and dates. Larger fonts can emphasize critical information, while smaller fonts can display secondary details.
- Add Gridlines: Gridlines improve the readability of your chart by separating tasks and timelines. They help your team align tasks with their corresponding dates.
- Incorporate Legends: A legend explains the meaning of colors, symbols, or patterns used in your chart. This ensures that everyone understands the visual elements.
Tip: Keep your chart simple and avoid overloading it with too many design elements. A clutter-free chart enhances clarity and usability.
Styling your Gantt chart systematically provides a visual overview of the project. It helps team members understand how their tasks align with the overall timeline. This clarity allows project managers to identify responsibilities and deadlines quickly. The timeline format also clarifies the order of task completion, improving project organization.
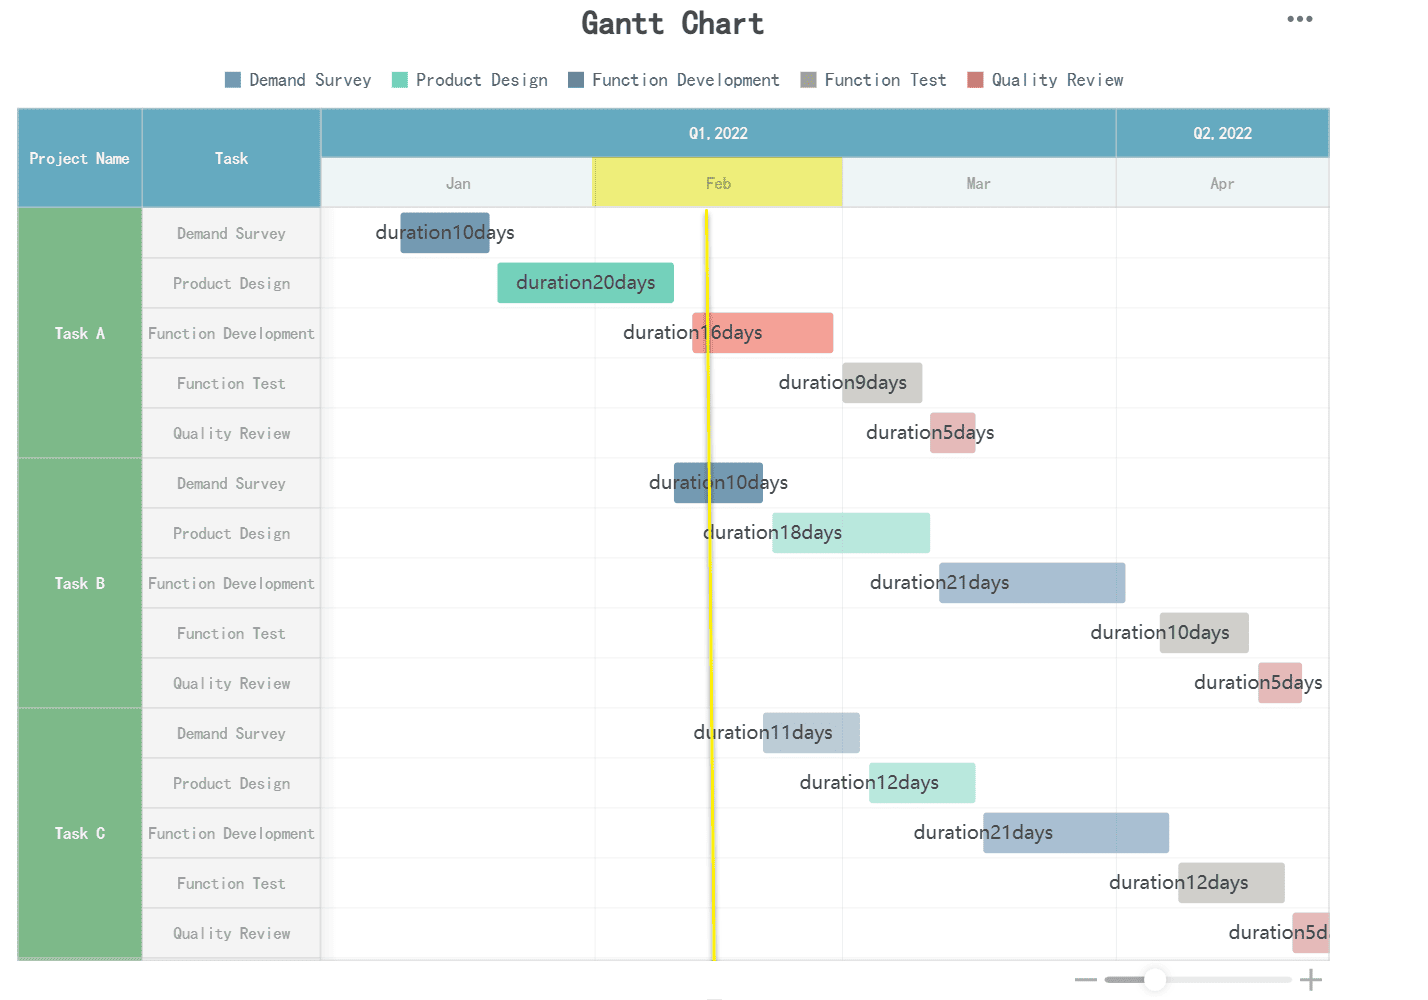
Step 5: Effect Display
Once you’ve styled your Gantt chart, focus on displaying it effectively. A well-displayed chart ensures that your team can access and interpret the information effortlessly. Follow these steps to optimize the display:
- Select the Right View: Choose a view that suits your project’s complexity. For small projects, a weekly view might suffice. For larger projects, consider a monthly or quarterly view.
- Optimize for Screen Size: Ensure your chart fits the screen size of your device. If your team uses mobile devices, adjust the chart dimensions for better visibility.
- Use Interactive Features: Some tools, like FineReport, allow you to add interactive elements. For example, you can enable task filtering or drill-down options to explore specific details.
- Enable Real-Time Updates: Display real-time data to keep your chart accurate. This feature is particularly useful for tracking progress and making adjustments on the go.
- Test Accessibility: Share the chart with your team and gather feedback. Ensure that everyone can access and understand the chart, regardless of their technical skills.
Note: If you’re using a tool like FineReport, take advantage of its advanced visualization features. These include customizable headers, milestone indicators, and task associations.
Displaying your Gantt chart effectively ensures that your team stays informed and aligned. Whether you’re managing a construction project or planning an event, a clear and accessible chart keeps everyone on track. By following these steps, you can create a Gantt chart in Malay that is both functional and visually appealing.
Recommended Tools for Creating a Gantt Chart in Malay
Excel: A versatile tool for creating basic Gantt charts

Excel is one of the most accessible tools for creating a gantt chart in malay. It provides a simple interface that allows you to build and customize charts without advanced technical skills. You can use Excel to create basic Gantt charts by formatting bar charts to represent tasks and timelines.
To get started, follow these steps:
- Open a new Excel worksheet.
- List your project tasks in one column and their start and end dates in adjacent columns.
- Use the "Insert Chart" feature to create a stacked bar chart.
- Format the chart to display tasks as horizontal bars on a timeline.
Excel also offers templates that simplify the process. These templates include pre-designed Gantt charts where you only need to input your data. While Excel is ideal for small projects, it may lack advanced features like task dependencies or real-time updates.
Tip: Use Excel if you need a quick and straightforward solution for small-scale projects.
FineReport: A versatile tool for creating Gantt chart in Malay with advanced visualization features
FineReport takes Gantt chart creation to the next level with its advanced visualization capabilities. This tool is perfect for managing complex projects that require detailed timelines, milestones, and task dependencies.
FineReport offers a drag-and-drop interface, making it easy to design charts without coding. You can customize your Gantt chart by adding data items like task names, start and end dates, progress, and dependencies. The software also supports real-time data integration, ensuring your chart stays updated as your project progresses.
Key features of FineReport include:
- Customizable Styles: Adjust colors, fonts, and gridlines to enhance readability.
- Milestone Indicators: Highlight critical dates and goals.
- Mobile Compatibility: Access your Gantt chart on any device, anytime.
FineReport’s advanced features make it a powerful tool for creating professional Gantt charts. Whether you’re managing a marketing campaign or a construction project, this software ensures your team stays aligned and informed.
Note: FineReport is especially useful for teams that need real-time updates and detailed task tracking.

How FanRuan Enhances Gantt Chart in Malay Creation
FineReport’s Gantt Chart: Simplifying project management with intuitive design
FineReport’s Gantt Chart in Malay offers a user-friendly interface that simplifies project management. You can easily visualize tasks, timelines, and dependencies on a horizontal timeline. This design ensures that you can track progress and identify delays without confusion. FineReport’s drag-and-drop functionality makes it accessible even for beginners. You don’t need advanced technical skills to create a professional Gantt chart in Malay.
The software also supports multilingual settings, including Malay. This feature allows you to create a gantt chart in malay, making it easier for teams who prefer working in their native language. By using FineReport, you can streamline your workflow and focus on achieving project goals efficiently.
Key features: Customizable timelines, milestones, and task dependencies
FineReport’s Gantt Chart in Malay includes several key features that enhance its usability. You can customize timelines to fit your project’s specific needs. For example, you can adjust the time intervals to display daily, weekly, or monthly views. Milestones are another essential feature. They allow you to highlight critical dates, ensuring that your team stays focused on major goals.
Task dependencies are equally important. FineReport enables you to link tasks that rely on each other. This feature helps you understand how delays in one task can impact the entire project. By visualizing these dependencies, you can make informed decisions to keep your project on track.
Benefits: Real-time data integration and mobile compatibility
FineReport stands out with its real-time data integration. This feature ensures that your Gantt chart always reflects the latest updates. You can monitor progress and make adjustments without delays. Real-time data keeps your team informed and aligned, reducing the risk of miscommunication.
Mobile compatibility is another significant benefit. FineReport allows you to access your Gantt chart in Malay on any device, whether it’s a desktop, tablet, or smartphone. This flexibility ensures that you can manage your project anytime, anywhere. With these benefits, FineReport empowers you to handle projects of any scale with confidence.
Benefits of Using Templates
Templates eliminate the need to start from scratch. They provide a clear framework for organizing tasks, timelines, and dependencies. For example, a template might include pre-labeled columns for task names, start and end dates, and progress percentages. This structure helps you focus on inputting data rather than designing the chart.
Tip: Choose a template that matches your project’s complexity. For small projects, a basic template works best. For larger projects, opt for templates with advanced features like task dependencies and milestones.
Using a Gantt chart template in Malay ensures clarity and reduces errors. It also makes collaboration easier, as your team can understand the chart in their preferred language.
Gantt charts play a vital role in project management by organizing tasks and timelines effectively. With the steps and tools outlined in this guide, you can create a gantt chart in malay with ease. Start by selecting a tool that suits your needs, and follow the instructions to build a chart that aligns with your project goals.
Practice using real-world examples in Malay to improve your skills. This approach helps you understand the process better and makes it easier to apply in future projects. Take the first step today and simplify your project management journey!
Click the banner below to try FineReport for free and empower your enterprise to transform data into productivity!
Continue Reading About Gantt Chart in Malay
Top Gnatt Chart Examples in 2025
Gantt Chart: Examples, Tools, and Templates


FAQ

The Author
Lewis
Senior Data Analyst at FanRuan
Related Articles

What Recruiters Look for in a Data Analysis Portfolio: 10 Criteria to Score Yours Fast
A $1 is not judged like a school assignment. It is judged like a hiring shortcut. Recruiters, hiring managers, and analytics leads use it to answer one question fast: Can this person solve business problems with data in
Lewis Chou
May 29, 2026

What Is Data Analytics Consulting? Beginner’s Guide to Services, Deliverables, and Business Value
$1 helps organizations turn raw data into decisions they can trust. For many business leaders, the challenge is not a lack of data. It is a lack of clarity. Reports conflict, teams track different KPIs, dashboards are un
Lewis Chou
Jun 03, 2026

Data Analyst Job Description [+2026 Guide]: Compare Responsibilities, Skills, and Salary by Industry
A strong $1 does more than list tasks. It defines how a company turns raw data into business decisions, which teams the analyst supports, and what measurable outcomes the role is expected to influence. For employers, tha
Lewis Chou
Jun 02, 2026