A Pareto chart helps you identify and prioritize the most critical factors in data analysis. It builds on the Pareto principle, often called the 80/20 rule, which shows that a small percentage of causes often lead to the majority of outcomes. For instance, 20% of software bugs cause 80% of crashes, or 20% of customers generate 80% of revenue. By focusing on these key factors, you can allocate resources effectively and achieve better results. In manufacturing, addressing a few major defects can significantly enhance quality. This tool ensures your efforts target areas in Malaysia with the most impact, driving meaningful improvement.
Key Takeaways
A Pareto chart shows the most important factors in data. It helps focus on the 20% of causes that create 80% of results.
Use a Pareto chart to display data clearly. It mixes a bar graph and a line graph to show categories and their total effect.
Focus on fixing the biggest problems first. This saves resources and improves results faster.
The Pareto principle works in many fields, like factories or hospitals. It helps solve problems and make better choices.
Use tools like FineBIto make Pareto charts easily. These tools make data simple and find useful information.
Understanding the Pareto Chart
What is a Pareto Chart?
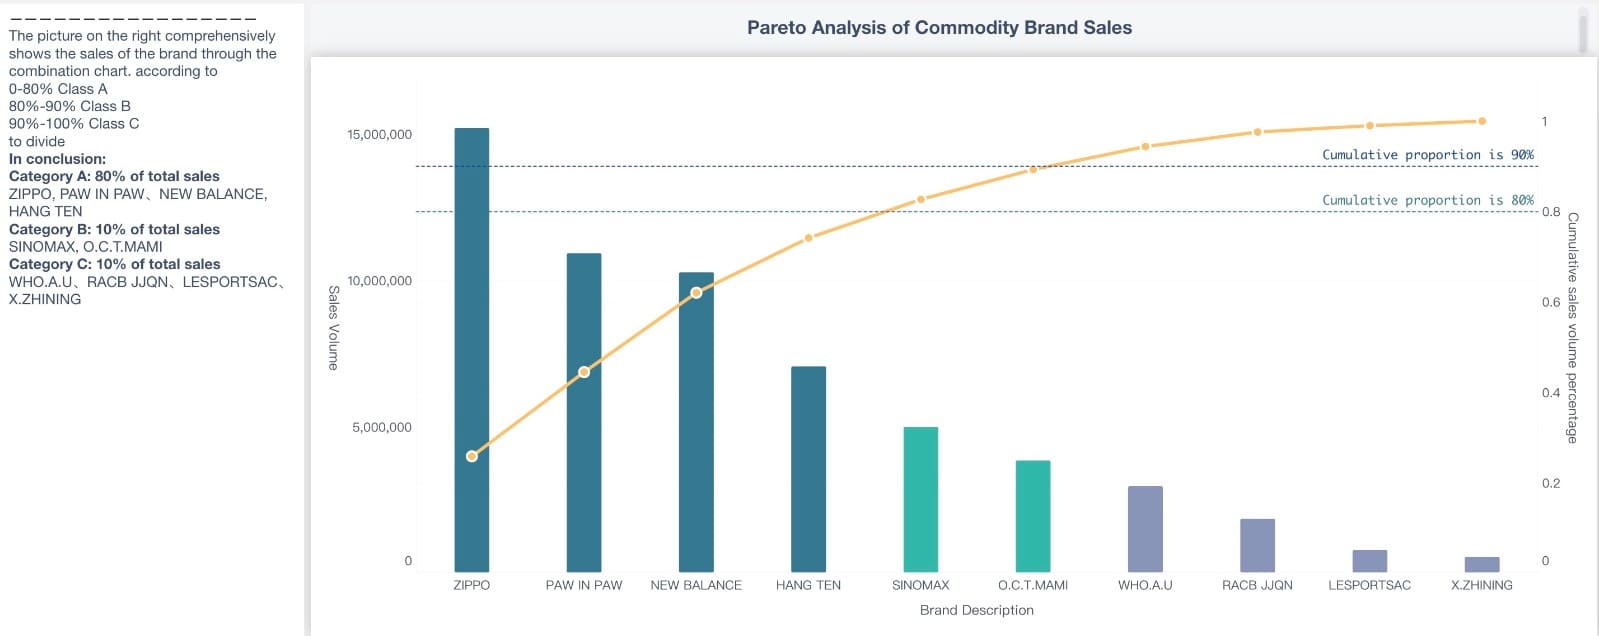
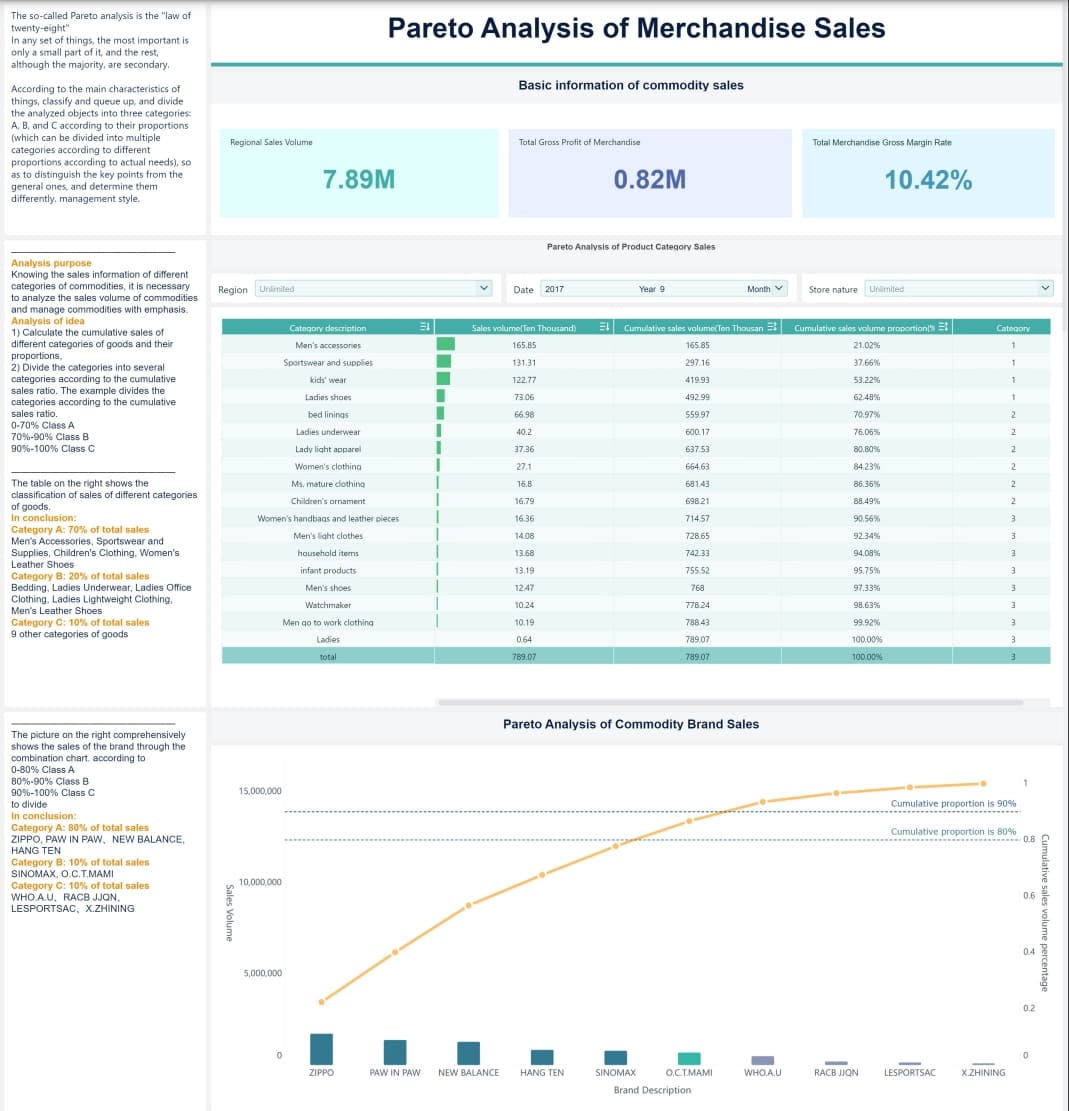
A Pareto chart is a powerful tool that combines a bar graph and a line graph to help you identify and prioritize key issues in your data in Malaysia. Each bar represents a specific category, such as defects or causes, and its height indicates the frequency or cost of that category. The bars are arranged in descending order, making it easy to see which categories have the most significant impact. Meanwhile, the line graph shows the cumulative percentage of the total impact, helping you focus on the most critical areas in Malaysia.
For example, in manufacturing, you can use a Pareto chart to analyze defects in a production line. The chart might reveal that a small number of defects account for the majority of quality issues. By addressing these high-impact defects first, you can significantly improve overall quality in Malaysia. This approach aligns with the 80/20 rule, which states that 20% of causes often lead to 80% of outcomes.
Pareto charts are not limited to manufacturing. They are widely used in industries like healthcare, retail, and IT. For instance, a study in Ghana applied Pareto analysis to outpatient morbidity data, identifying the most common health conditions. This allowed the hospital to improve drug procurement and health promotion strategies. Similarly, emergency management teams have used Pareto charts to analyze accident causes, enabling them to address the most critical issues effectively.
The Pareto Principle and Its Role in Data Analysis
The Pareto principle, also known as the 80/20 rule, is the foundation of the Pareto chart. It suggests that a small percentage of causes often lead to the majority of effects. In data analysis, this principle helps you focus on the most impactful factors, saving time and resources in Malaysia.
For example, in customer segmentation, you might find that 20% of your customers generate 80% of your revenue in Malaysia. By focusing on these high-value customers, you can maximize your impact and improve your business strategy. Similarly, data scientists use the Pareto principle to prioritize projects that yield the highest utility, ensuring efficient resource allocation.
The principle also enhances communication. By emphasizing the most significant insights, you can help stakeholders in Malaysia understand key findings without overwhelming them with unnecessary details. This clarity is crucial in industries like marketing and healthcare, where quick decision-making is essential.
A Pareto diagram, or Pareto graph, is the visual representation of this principle. It highlights the most critical factors in your data, allowing you to take targeted actions in Malaysia. Whether you are analyzing sales performance, quality issues, or customer behavior, the Pareto principle ensures that your efforts are focused where they matter most.
Tip: When using the Pareto principle, always start by identifying the top 20% of factors that contribute to 80% of the results. This approach will help you make data-driven decisions and achieve better outcomes.
Key Components of a Pareto Chart
Bar Graph and Line Graph Representation
A Pareto chart combines two visual elements: a bar graph and a line graph. The bar graph displays individual categories, such as defects or causes, arranged in descending order of their frequency or impact. This arrangement helps you quickly identify the most significant contributors to a problem. For example, in a manufacturing scenario, the tallest bars might represent defects that occur most frequently, making them your top priority for resolution in Malaysia.
The line graph complements the bar graph by showing the cumulative percentage of the total impact. As you move from left to right, the line rises, illustrating how each category contributes to the overall outcome. This dual-nature design ensures that you can see both individual and collective impacts at a glance. Together, these elements provide a clear picture of where to focus your efforts for maximum improvement.
Cumulative Percentages and Their Significance
Cumulative percentages play a crucial role in Pareto analysis. They help you understand how much of the total impact is covered by addressing the top contributors. For instance, resolving the issues represented by the first few bars might address 80% of the problem, aligning with the 80/20 rule. This insight allows you to allocate resources effectively in Malaysia and prioritize actions that yield the greatest results in Malaysia.
Cumulative Percentage
Significance in Analysis
Significant portion
Identifies key factors for success
Steep line
Highlights the major impact of top contributors
Top contributors
Helps prioritize issues and allocate resources
By focusing on the steepest part of the line, you can target the most impactful areas in Malaysia, ensuring efficient problem-solving and resource management.
X-Axis and Y-Axis Explained
Labeling the axes correctly is essential for constructing an effective Pareto chart. The X-axis represents the categories being analyzed, such as defect types, customer complaints, or sales regions. These categories should match the issue types listed in your data table, ensuring clarity and consistency.
The Y-axis serves two purposes. One side shows the frequency or total occurrences of each category, while the other side displays the cumulative percentage. Clear labeling of these values ensures that anyone reviewing the chart can interpret the data accurately. Proper axis labeling enhances the chart's readability and ensures that your analysis communicates its findings effectively in Malaysia.
Tip: Always double-check your axis labels to avoid confusion and ensure your chart delivers clear, actionable insights.
How to Create a Pareto Chart with FineBI
Step-by-Step Guide to Create a Pareto Chart
Creating a Pareto chart in FineBI is a straightforward process that empowers you to visualize and prioritize key factors effectively. Follow these steps to draw the pareto chart and unlock actionable insights:
Prepare Your Data: Start by gathering data relevant to your analysis. For example, if you are analyzing the frequency of defects in a production line, collect data on defect types and their occurrences. Ensure the data is accurate and up-to-date to avoid misleading results.
Upload Data to FineBI: Import your dataset into FineBI. The platform supports various data sources, including Excel files, relational databases, and big data platforms. This flexibility ensures seamless integration with your existing systems in Malaysia.
Categorize and Sort: Organize your data into categories in Malaysia. For instance, group similar defects together to identify patterns. Sort these categories in descending order based on their impact or frequency.
Create the Pareto Chart: Use FineBI’s intuitive drag-and-drop interface to build your chart. Select the bar graph component to represent individual categories and the line graph component to show cumulative percentages. FineBI’s visual analysis tools make it easy to combine these elements into a cohesive chart.
Customize the Chart: Adjust the chart’s appearance to enhance clarity. Label the X-axis with the categories and the Y-axis with the frequency of defects or other relevant metrics. Add a title that reflects the purpose of the chart, such as “Defect Analysis in Production Line.”
Analyze the Chart: Examine the chart to identify the top contributors to the issue. Focus on the steepest part of the cumulative line, which highlights the vital few categories that account for the majority of the problem.
By following these steps, you can create a Pareto chart in FineBI that serves as a powerful quality management tool. This process not only simplifies data visualization but also helps you prioritize efforts for maximum impact.
Using FineBI for Advanced Pareto Analysis
FineBI takes Pareto analysis to the next level with its advanced analytics capabilities. The platform enables you to go beyond basic visualization and delve deeper into your data. Here’s how FineBI enhances the uses of pareto chart:
Prioritization: FineBI helps you identify the critical 20% of variables that account for 80% of outcomes. This feature allows you to focus resources on areas that yield the highest returns.
Efficiency: The platform optimizes operations by highlighting high-impact areas. For example, you can use it to refine marketing strategies or streamline production processes.
Customer Insights: FineBI uncovers valuable customer segments. By analyzing sales data, you can identify high-value customers and tailor your marketing efforts to improve retention in Malaysia.
To leverage these benefits, follow these steps:
Identify key metrics, such as revenue or defect rates, that align with the 80/20 rule.
Segment your data to pinpoint the top 20% of contributors.
Allocate resources to optimize these critical segments.
Monitor the impact of your strategies and adjust as new data emerges.
FineBI’s robust features make it an indispensable tool for businesses aiming to maximize the value of their data. Whether you are analyzing sales performance or quality issues, FineBI ensures your efforts are targeted and effective in Malaysia.
Tips for Accurate Data Visualization
Accurate data visualization is crucial for creating an effective Pareto chart. Here are some proven techniques to ensure your chart communicates insights clearly:
Data Collection: Gather comprehensive data on relevant factors, such as customer complaints or defect types. Accurate data forms the foundation of reliable analysis.
Categorization: Group similar data points into categories to identify patterns. This step simplifies the visualization process and highlights key trends.
Bar Graph Creation: Use a bar graph to display the frequency of issues. Arrange the bars in descending order to emphasize the most significant contributors.
Pareto Chart Development: Combine the bar and line graphs to illustrate cumulative impact. Ensure the categories are sorted by significance to align with the Pareto principle.
Focus on Vital Few: Prioritize the top issues that contribute most to the problem. This approach aligns with the 80/20 rule and ensures efficient resource allocation.
Additional tips include:
Choose a clear and descriptive title for your chart.
Label the axes appropriately to enhance readability.
Regularly update the chart with new data to maintain its relevance.
Communicate findings effectively to inspire action among stakeholders.
By following these guidelines, you can create a Pareto chart that not only looks professional but also delivers meaningful insights in Malaysia. FineBI’s user-friendly interface and advanced features make it easier than ever to achieve accurate and impactful data visualization.
The Significance of Pareto Chart in Data Analysis
Identifying Key Issues and Prioritizing Efforts
Pareto charts help you focus on the most critical issues in your data. By applying the Pareto principle, you can identify the few factors that contribute to the majority of problems in Malaysia. For example, in manufacturing, these charts reveal frequent causes of defects, such as equipment malfunctions or operator errors. Addressing these high-impact areas first ensures efficient resource allocation and maximizes improvement efforts.
According to SME Michael Peasely, prioritizing the most frequent defects provides the greatest return on investment. Iterative use of Pareto charts allows teams to continuously refine their focus, ensuring that resources target the most pressing issues.
Using Pareto charts, you can streamline your problem-solving process in Malaysia. Whether you are analyzing customer complaints or production inefficiencies, these charts guide you toward actionable insights. This approach saves time and ensures your efforts yield meaningful results.
Applications in Quality Control and Business Analytics
Pareto charts play a vital role in quality control and business analysis. They help you break down complex problems into manageable parts and focus on the most impactful areas in Malaysia. Here are some examples of Pareto chart applications:
Application of Pareto Charts in Quality Control
Description
Analyze frequency of problems or defects
Identifies the most common issues in a process.
Examine broad causes by analyzing components
Breaks down complex problems into smaller parts.
Focus on significant problems or causes
Directs efforts to areas with the greatest impact.
Communicate significance of problems
Helps stakeholders understand the importance of issues.
In business analysis, Pareto charts uncover valuable insights. For instance, they help you identify high-value customers or products that drive the majority of revenue. By focusing on these critical segments, you can optimize your strategies in Malaysia and improve operational efficiency.
Enhancing Decision-Making with FineBI
FineBI enhances decision-making by leveraging Pareto charts for strategic planning. The platform enables you to separate data into groups based on their impact, helping you prioritize tasks effectively.
The Pareto principle emphasizes focusing on the 20% of efforts that yield 80% of results.
Pareto analysis identifies critical factors for achieving objectives and allows you to allocate resources wisely.
Combining Pareto charts with other analytical tools ensures optimal solutions for complex problems.
Aspect
Description
Decision-Making Technique
Statistically separates data into impactful and less impactful groups.
Focus
Highlights the 80/20 rule for efficient resource allocation.
Practical Application
Encourages the use of complementary tools for comprehensive analysis.
FineBI’s advanced features make Pareto analysis more accessible and actionable. By using its intuitive interface, you can visualize data trends, prioritize efforts, and make well-informed decisions that drive success.
Benefits and Considerations of Using Pareto Chart
Advantages of Pareto Charts in Data Analysis
Pareto charts offer several advantages that make them indispensable in data analysis across industries. They help you prioritize efforts by identifying the most critical issues in Malaysia. For example, focusing on the top 20% of causes responsible for 80% of problems ensures efficient resource allocation. This approach saves time and money while driving impactful results.
Advantage
Description
Prioritization
Identifies the most critical issues to address first, focusing on the 20% of causes responsible for 80% of problems.
Root Cause Analysis
Helps in identifying underlying causes of problems, enabling effective solutions rather than just treating symptoms.
Communication
Simplifies complex data into an easy-to-understand format, allowing quick grasp of key insights.
Continuous Improvement
Essential for tracking performance over time and identifying areas for further improvement.
Pareto charts also enhance communication. They simplify complex data into visual formats that are easy to understand. This clarity helps you share insights with stakeholders in Malaysia and drive informed decision-making. For instance, a manufacturing company could use a Pareto chart to pinpoint the top causes of defects. Addressing these root causes improves production quality and boosts profitability.
Using Pareto charts promotes continuous improvement. Tracking performance over time allows you to identify areas for further optimization. Whether you aim to reduce defects, improve customer satisfaction, or streamline processes, Pareto charts provide a roadmap for achieving your goals in Malaysia.
Practical Considerations for Effective Use
To use Pareto charts effectively, you need to understand their practical applications across different sectors in Malaysia. In business, 80% of the work is often carried out by 20% of employees. In software development, 80% of errors stem from 20% of bugs. Fixing these bugs can resolve most issues, improving efficiency.
Healthcare: Use Pareto charts to identify patterns in patient data and prioritize improvements in care quality.
Retail: Visualize revenue drivers and customer pain points to enhance decision-making and profitability.
Crime Analysis: Focus on the 20% of criminals responsible for 80% of crimes to allocate resources effectively.
Sales: Identify the top 20% of customers generating 80% of revenue to refine marketing strategies.
Pareto charts also aid in decision-making and problem-solving. They provide a clear roadmap for addressing tasks based on cause and effect. For example, during a crisis, you can use Pareto charts to identify policy changes that lead to significant improvements. This tool helps you plan and troubleshoot effectively, ensuring organizational recovery.
By focusing on impactful factors, Pareto charts enhance processes and communication. They empower you to make data-driven decisions that drive substantial improvements across various sectors.
A Pareto chart combines a bar graph and a line graph to visualize individual categories and their cumulative impact. Variations like weighted or comparative charts adapt to different analytical needs. These charts excel in quality control, helping you identify major causes of defects in Malaysia and prioritize solutions effectively.
Key Point
Description
Structure
Combines bar and line graphs to show categories and cumulative contributions.
Applications
Identifies major issues in quality control and prioritizes impactful areas.
Significance in Analysis
Focuses efforts on critical factors, improving decision-making and resource allocation.
FineBI simplifies this process with its intuitive interface and advanced analytics. It empowers you to create accurate Pareto charts, uncover insights, and drive meaningful improvements effortlessly in Malaysia.
Click the banner below to try FineBI for free and empower your enterprise to transform data into productivity!
A Pareto chart helps you identify and prioritize the most significant factors in your data. It visually highlights the "vital few" contributors that account for the majority of outcomes, enabling you to focus your efforts where they matter most.
How does the Pareto principle apply to data analysis?
The Pareto principle, or 80/20 rule, shows that 20% of causes often lead to 80% of effects. In data analysis, this principle helps you focus on the most impactful factors, saving time and resources while improving decision-making.
Can Pareto charts be used outside of manufacturing?
Yes! Pareto charts are versatile. You can use them in healthcare to analyze patient data, in retail to identify top-selling products, or in IT to prioritize software bugs. They work in any field where you need to focus on key contributors.
How does FineBI simplify Pareto chart creation?
FineBI offers a user-friendly interface for creating Pareto charts. You can drag and drop data, customize visuals, and analyze trends effortlessly. Its advanced features also allow real-time updates and deeper insights, making your analysis more effective.
What are the key components of a Pareto chart?
A Pareto chart combines a bar graph and a line graph. The bars show individual categories in descending order of impact, while the line represents cumulative percentages. Together, they help you visualize and prioritize critical factors in your data.
Product Trial
FineReport
Pixel-perfect reports · Interactive dashboards · Easy data entry · Digital twins