You can use rfm analysis to understand your customers better. RFM stands for Recency, Frequency, and Monetary value. These three factors help you see who buys often, who spends the most, and who has not bought in a while. RFM gives you a clear picture of customer behavior. With FanRuan and FineBI, you can quickly process large or complex data sets for your rfm projects. FineBI makes rfm easy to use for both new and experienced users.
RFM analysis, a simple and practical customer analysis method proposed by American database marketing research institutes, evaluates customer data based on the following factors:
These three factors constitute the best indicators for data analysis.
You can use rfm analysis to understand your customers by looking at three important factors: Recency, Frequency, and Monetary value. Recency shows how recently a customer made a purchase. Frequency tells you how often a customer buys from you. Monetary value measures how much money a customer spends. These three parts work together to give you a clear picture of customer behavior.
When you use rfm, you can group your customers based on their buying habits. For example, some customers buy often and spend a lot, while others may not have purchased in a long time. By scoring each customer on these three factors, you can see who is most engaged and who might need more attention. Many businesses use rfm analysis with clustering methods like K-Means or Decision Trees. These tools help you create groups of customers who act in similar ways, making it easier to plan your marketing.
Tip: RFM analysis helps you spot your best customers and those who might leave soon. This lets you focus your efforts where they matter most.
Rfm analysis gives you a powerful way to improve your marketing. You can target your messages to the right people and increase your return on investment. Here are some reasons why rfm is so effective:
FanRuan leads the way in data analytics, and FineBI makes rfm analysis easy for everyone. With FineBI, you can quickly connect your data, run rfm analysis, and see the results in clear dashboards. This helps you make smart decisions and grow your business.
FineBI makes it easy for you to bring all your customer data together, no matter where it lives. You can connect to many types of data sources that are common in retail and e-commerce. Here are some examples:
You can also connect to Excel files, CSVs, and APIs. FineBI supports over 60 connectors, so you can link your databases, cloud warehouses, and even real-time data streams. This flexibility lets you unify all your customer and transaction records in one place for analysis.

Tip: FineBI’s integration with FanRuan’s FineDataLink platform helps you synchronize and transform data across multiple systems in real time. This means you always work with the latest and most accurate information.
Once you have connected your data, you need to clean and organize it before starting RFM analysis. Clean data leads to better results and more reliable insights. Follow these best practices:
You should also make sure your data handling follows privacy laws like GDPR and CCPA. FineBI’s self-service tools help you preview, filter, and transform your data without needing to write code.
Note: Clean and well-structured data is the foundation of accurate RFM analysis. Take time to review your data before moving to the next step.
You start your rfm analysis by creating an analysis subject. This subject is the main group of data you want to study. In FineBI, you select your customer transaction records as the analysis subject. Make sure you include fields like Customer ID, Transaction Date, and Transaction Amount. These fields help you track each customer’s activity over time.
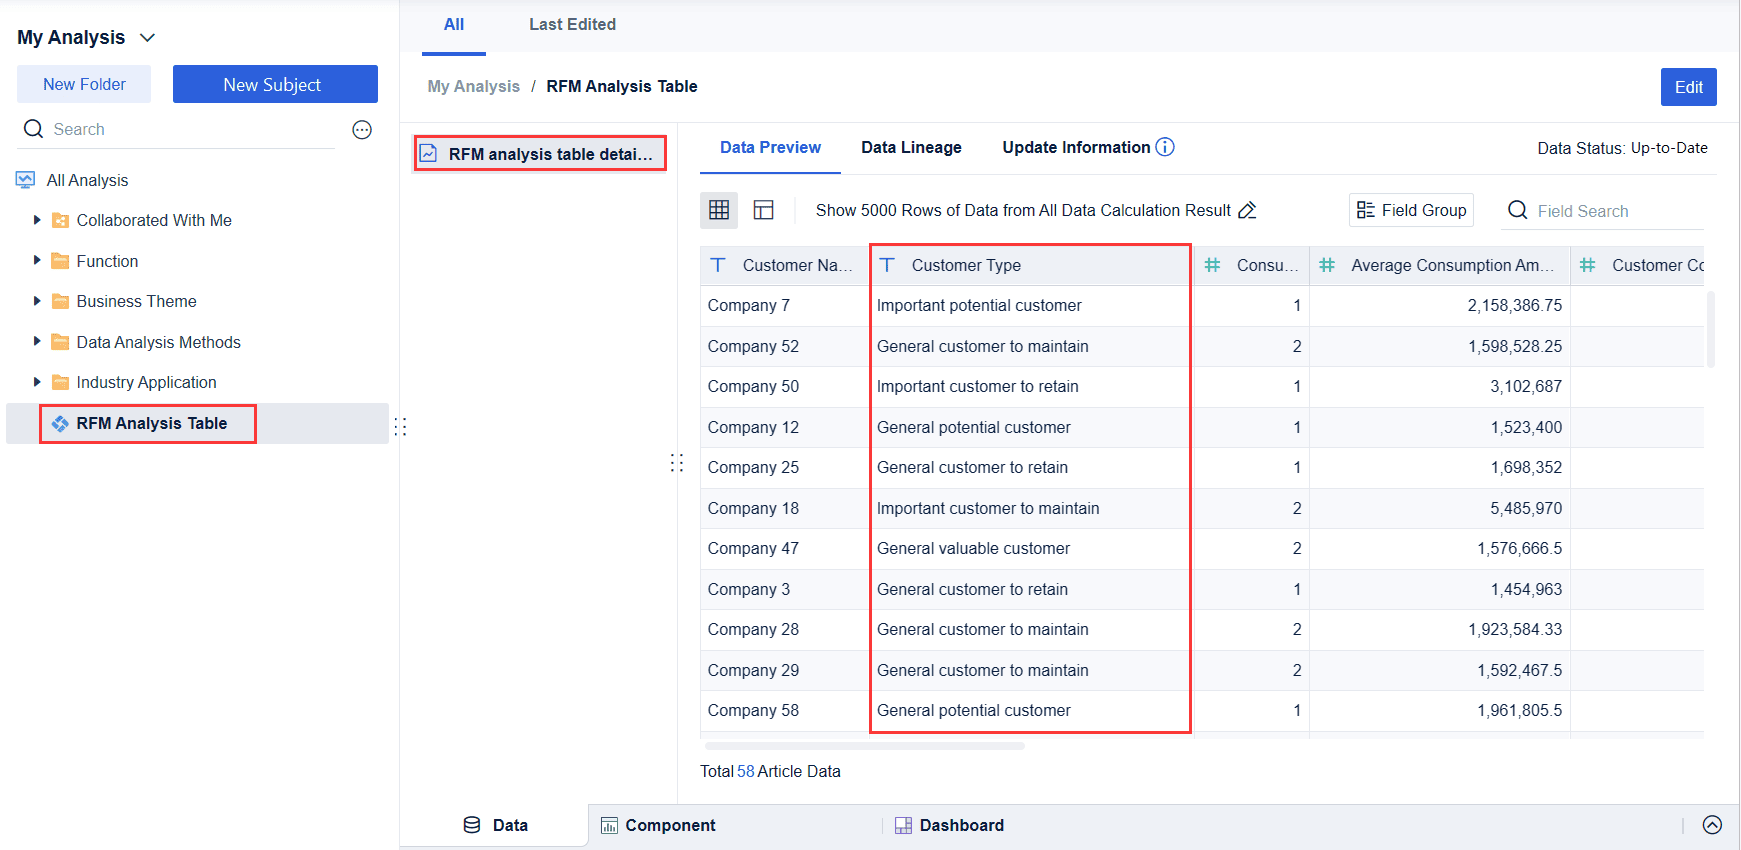
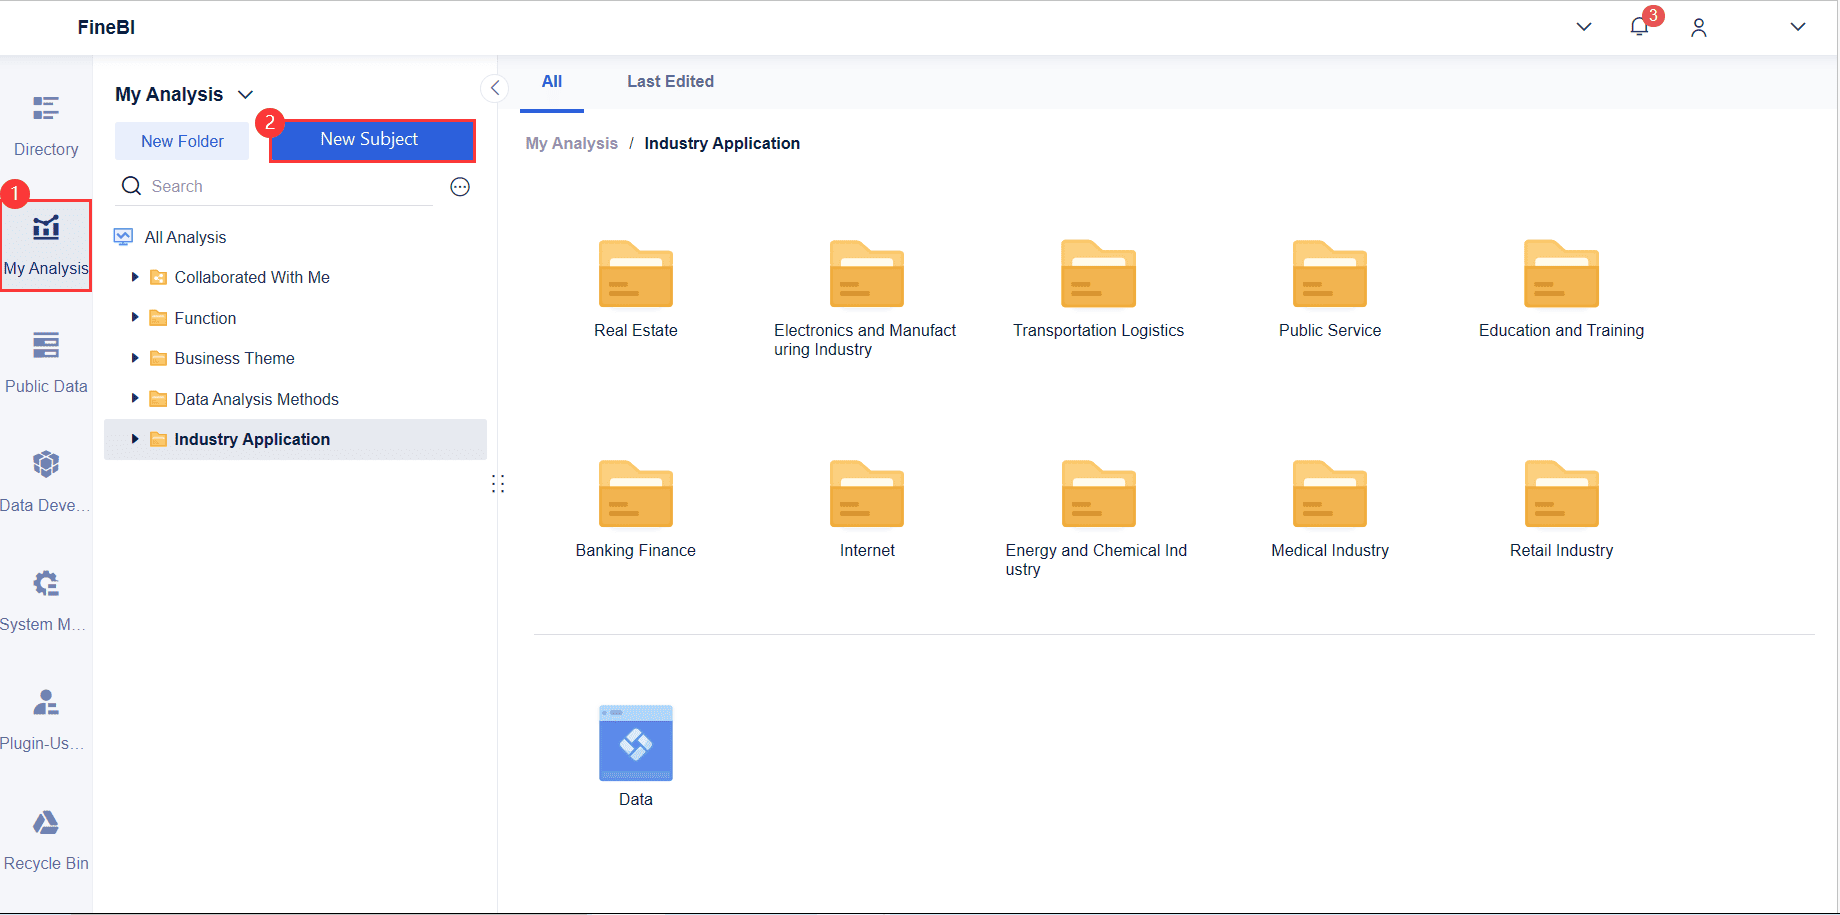
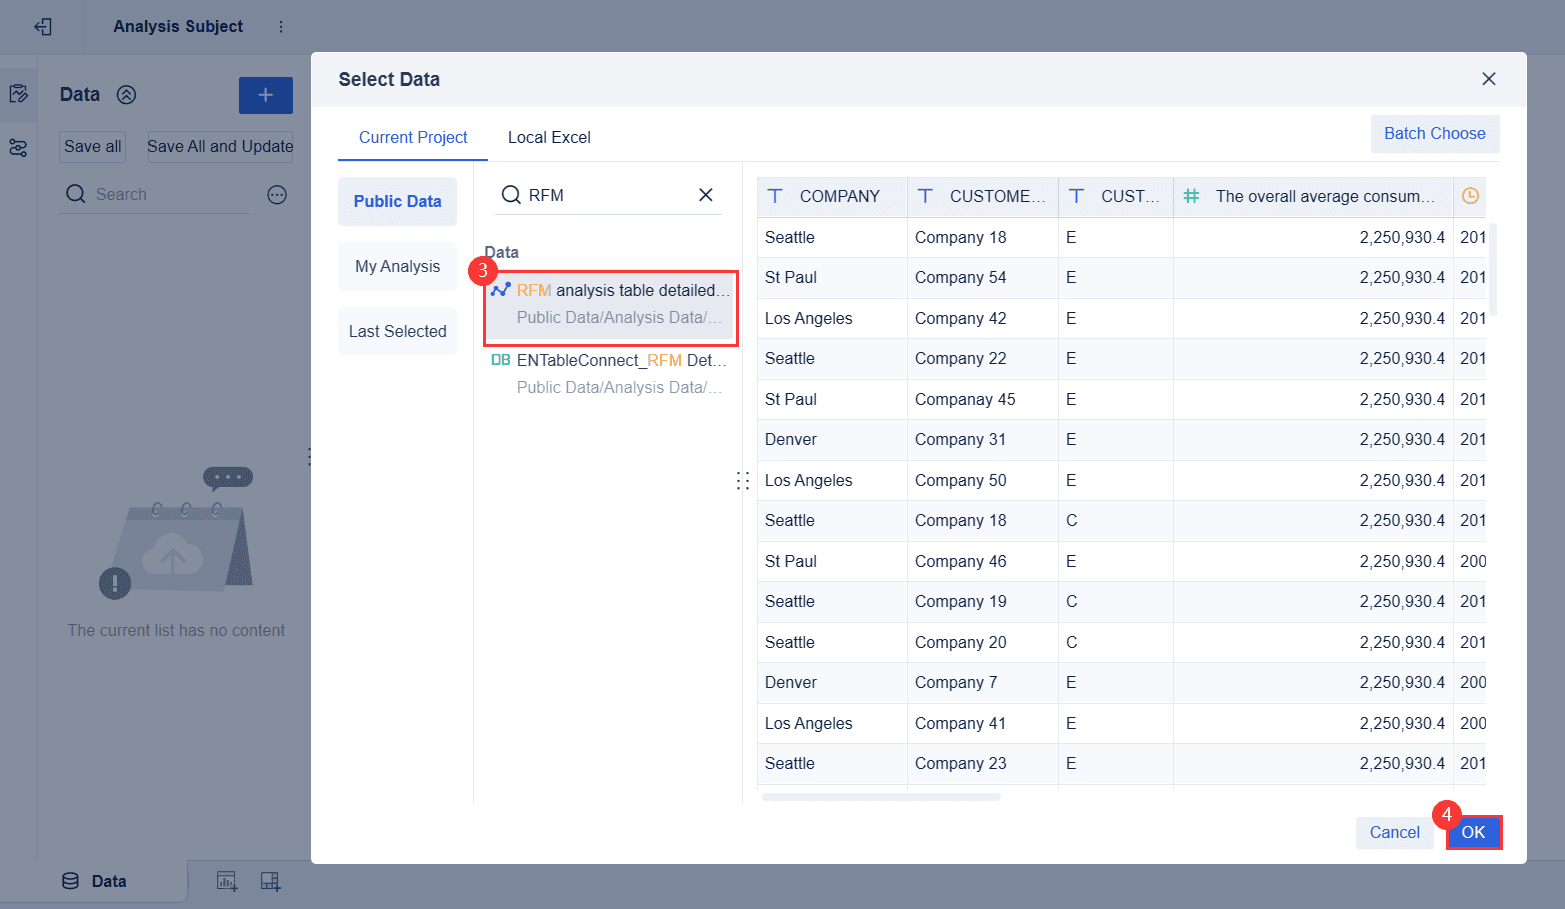
(1) To create an RFM model analysis subject, choose My Analysis > New Subject, select RFM analysis table detailed data from the built-in public data, and click OK to add data, as shown in the following figures.
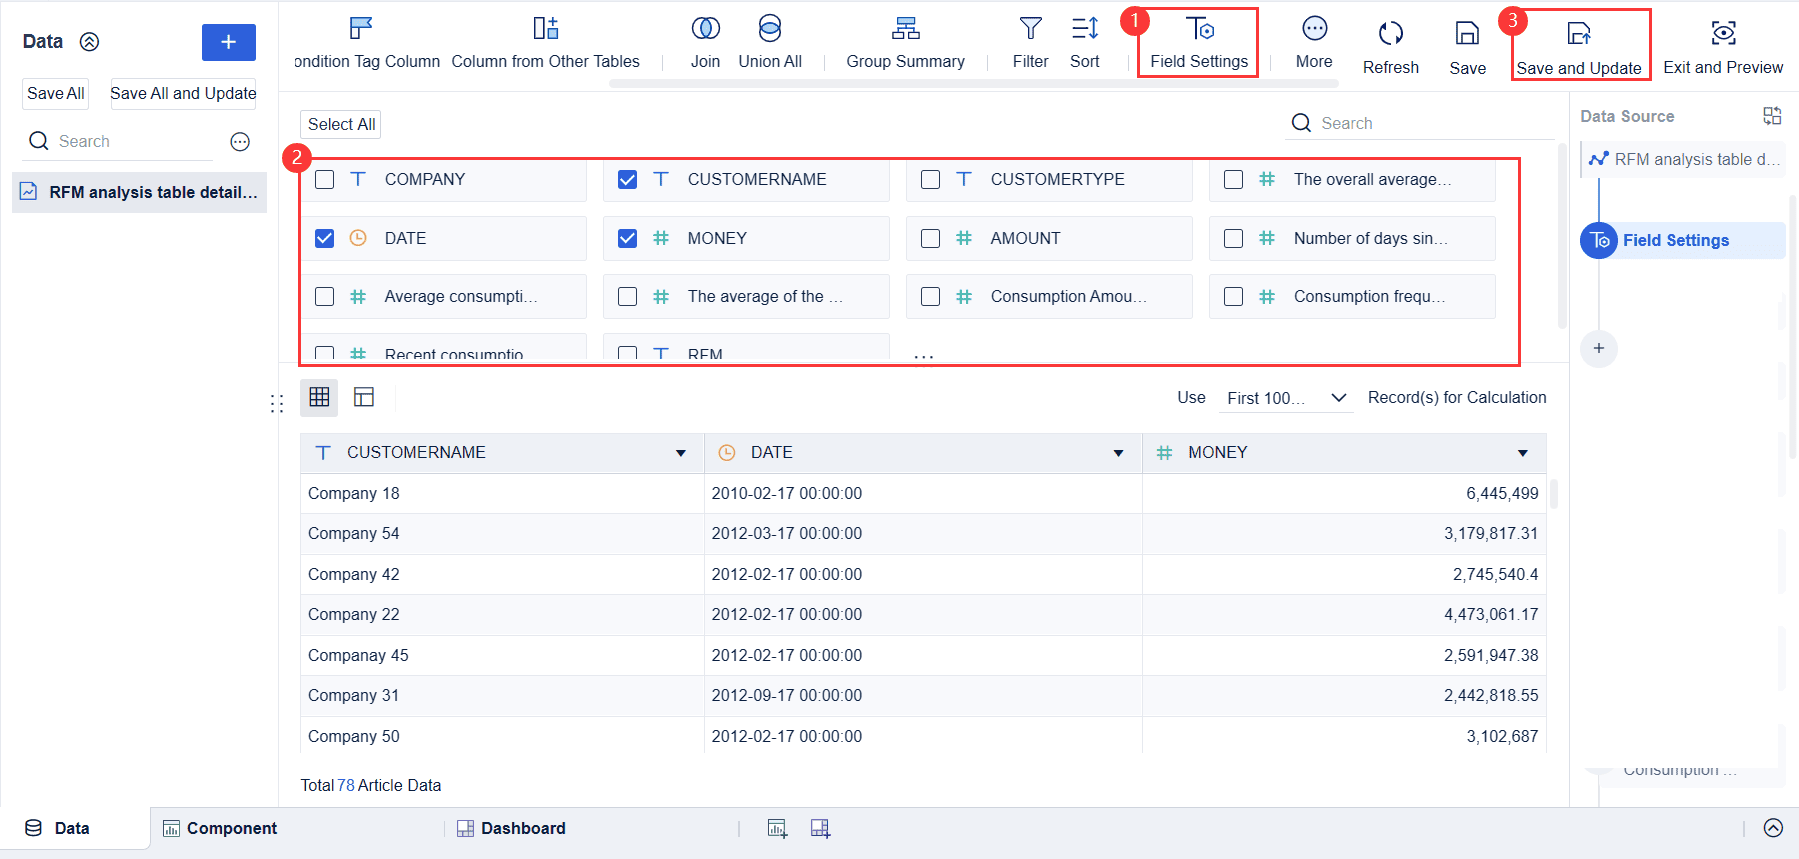
(2) Click Field Settings, select required fields, and click Save and Update, as shown in the following figure.
Next, you calculate the three main indicators for each customer: Recency, Frequency, and Monetary value. Recency measures how long it has been since a customer’s last purchase. Frequency counts how many times a customer has bought from you during a set period. Monetary value shows how much money each customer has spent. FineBI lets you do these calculations quickly, even with large datasets.
Calculate the average consumption amount per time, consumption times, and number of days since the last consumption of each customer.
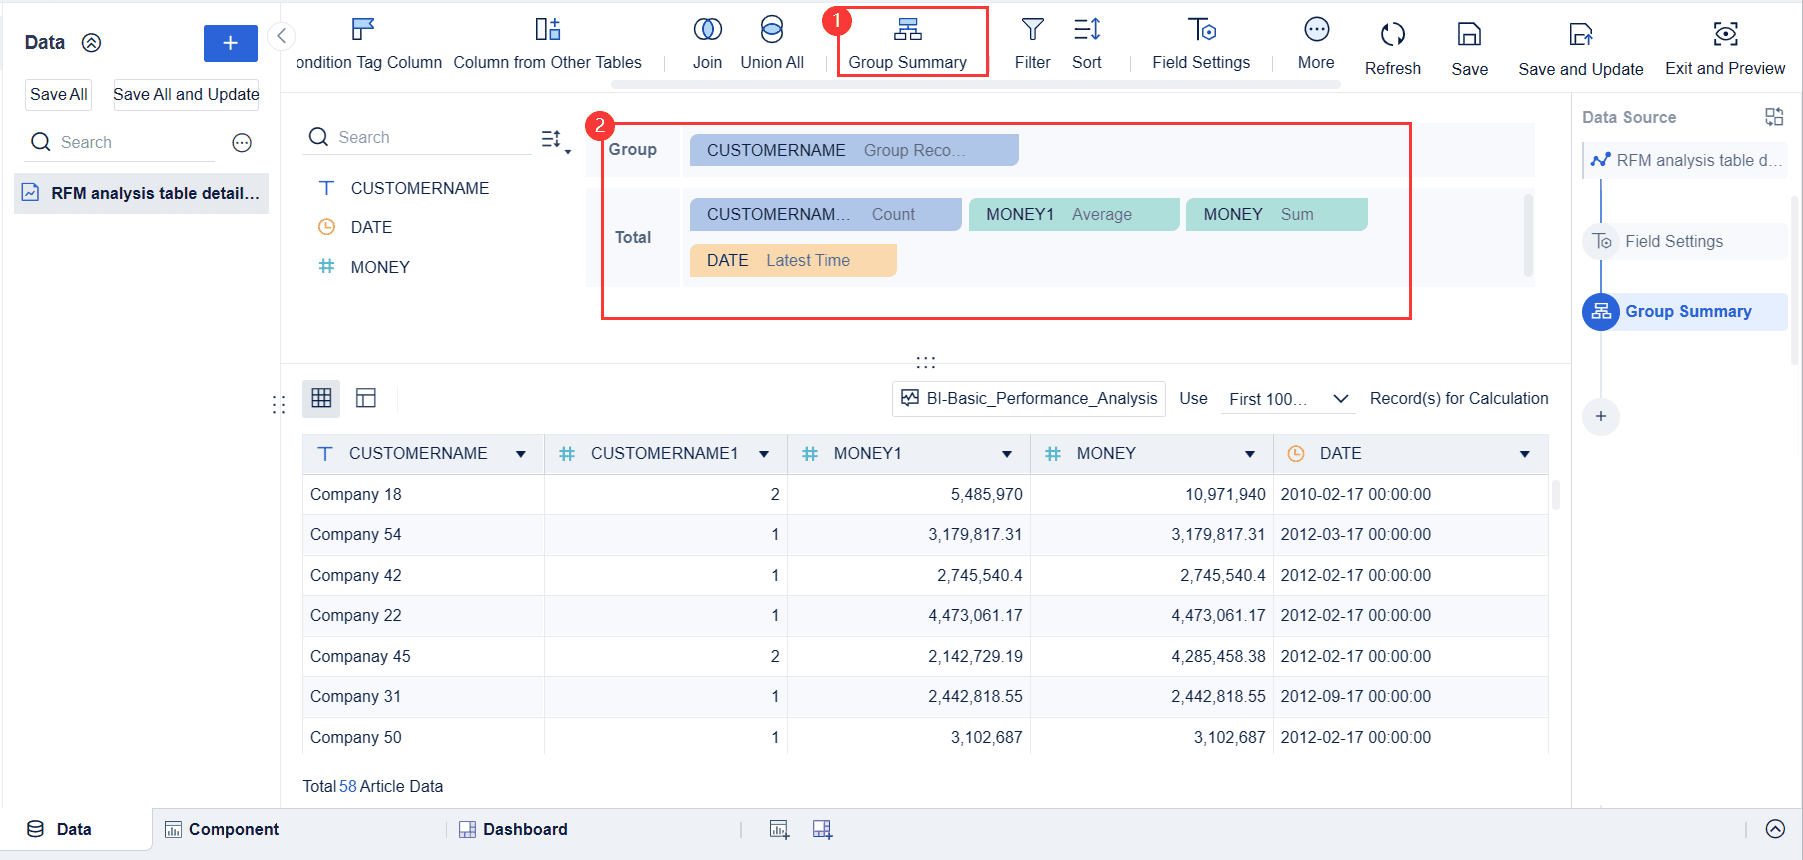
(1) Group and summarize data, as shown in the following figure.
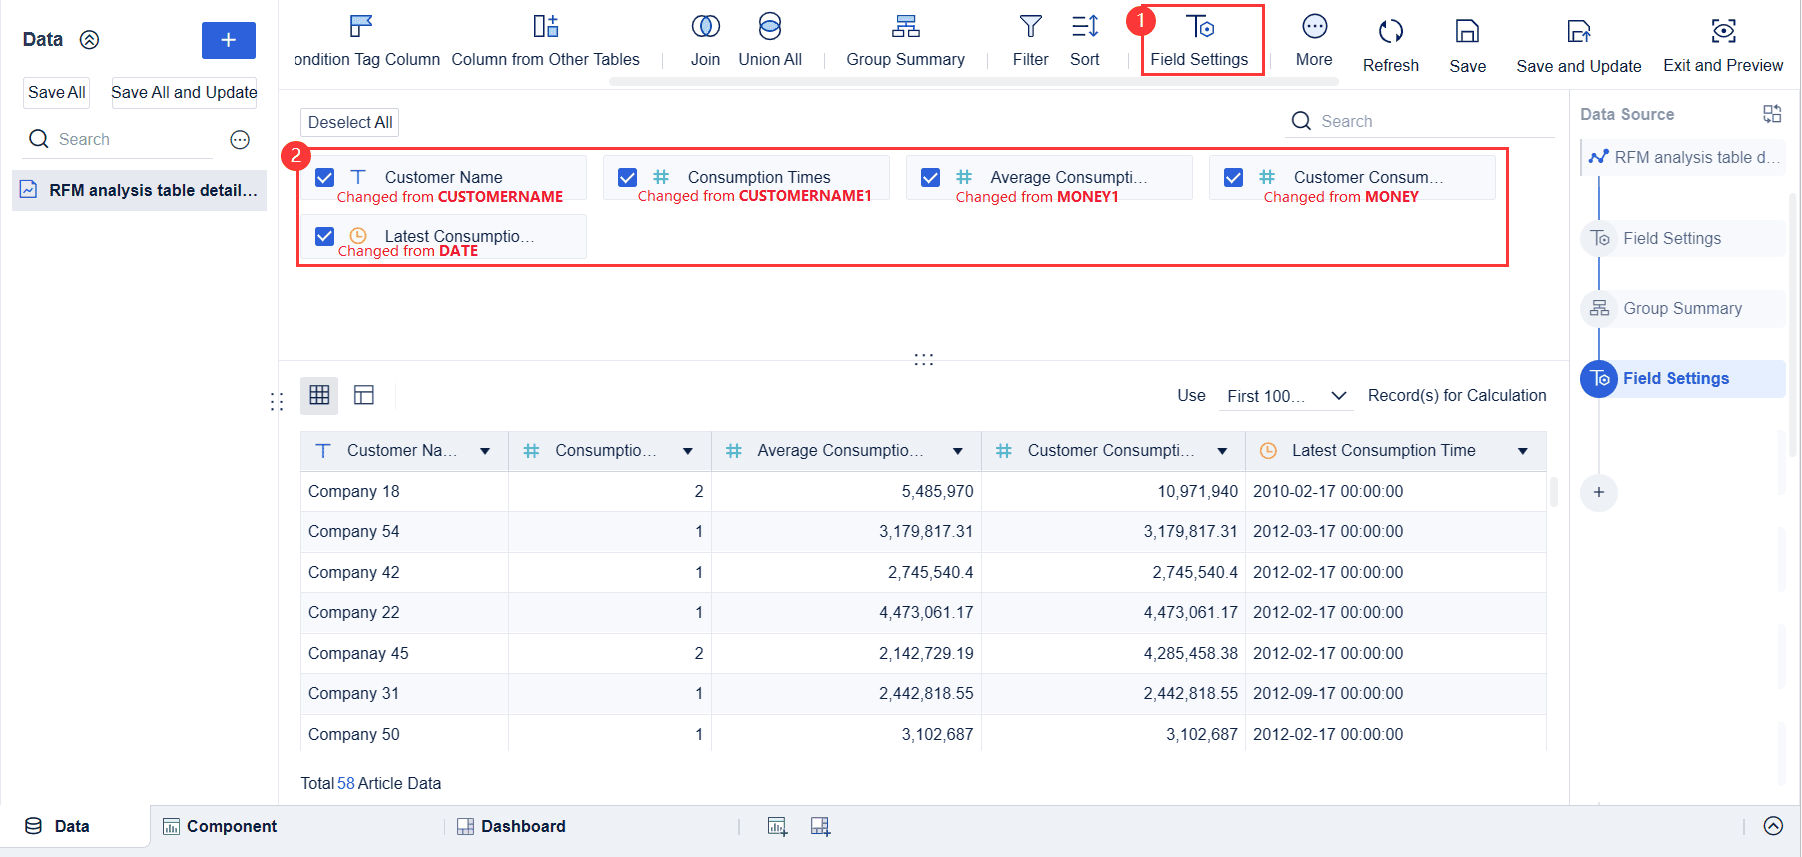
(2) Rename the fields for easier understanding, as shown in the following figure.
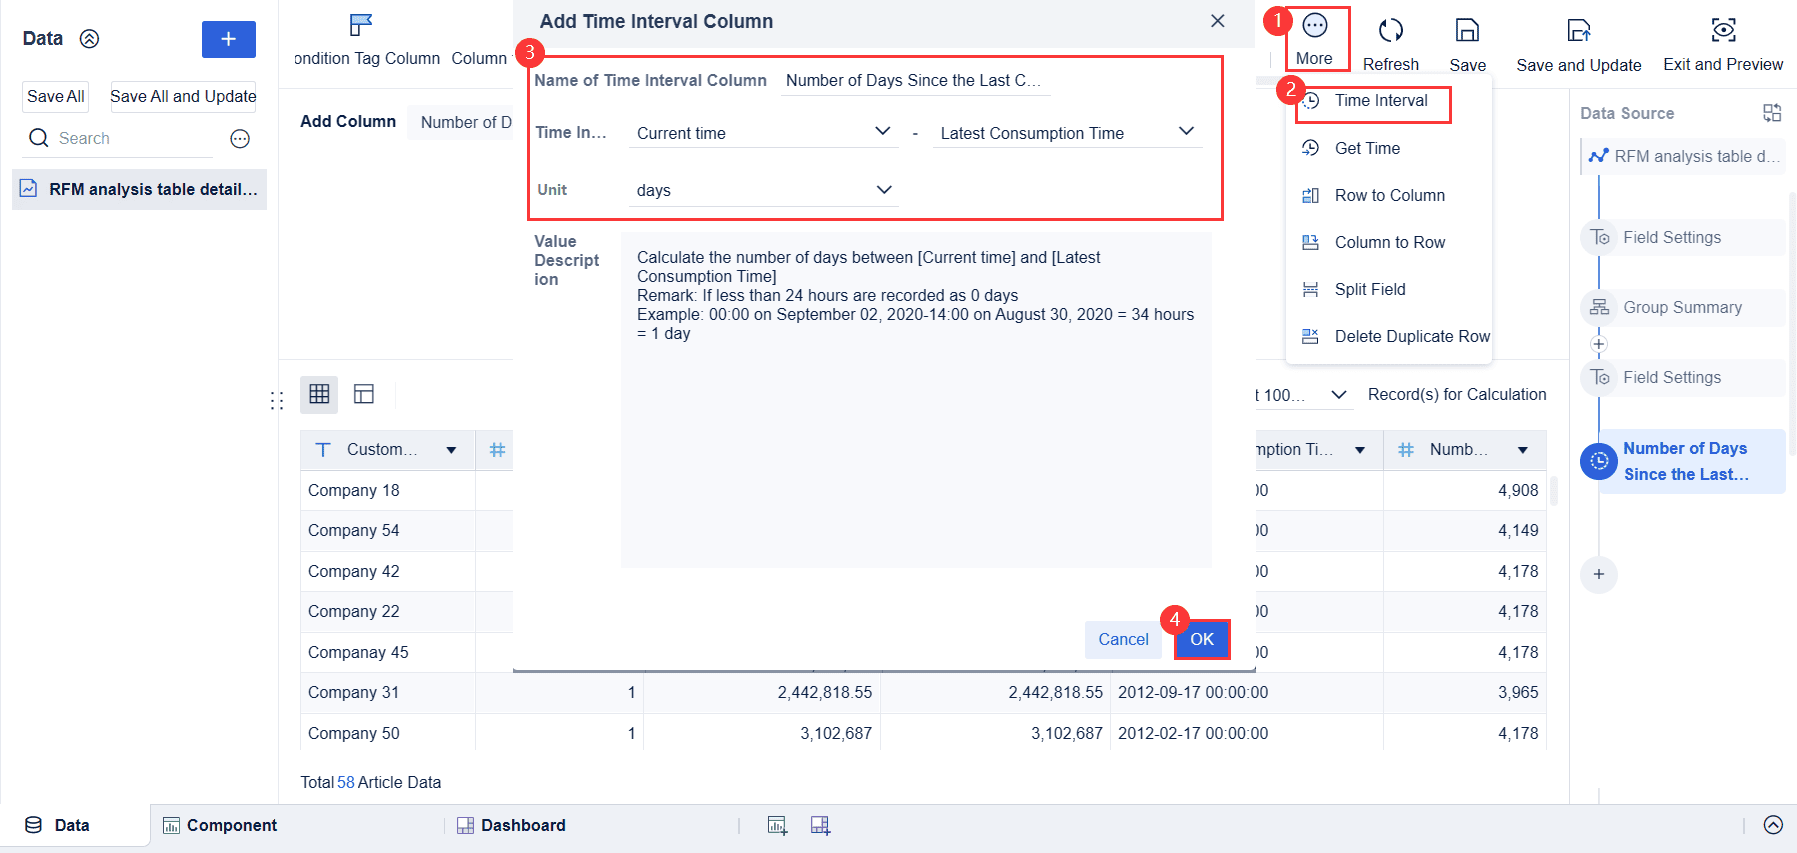
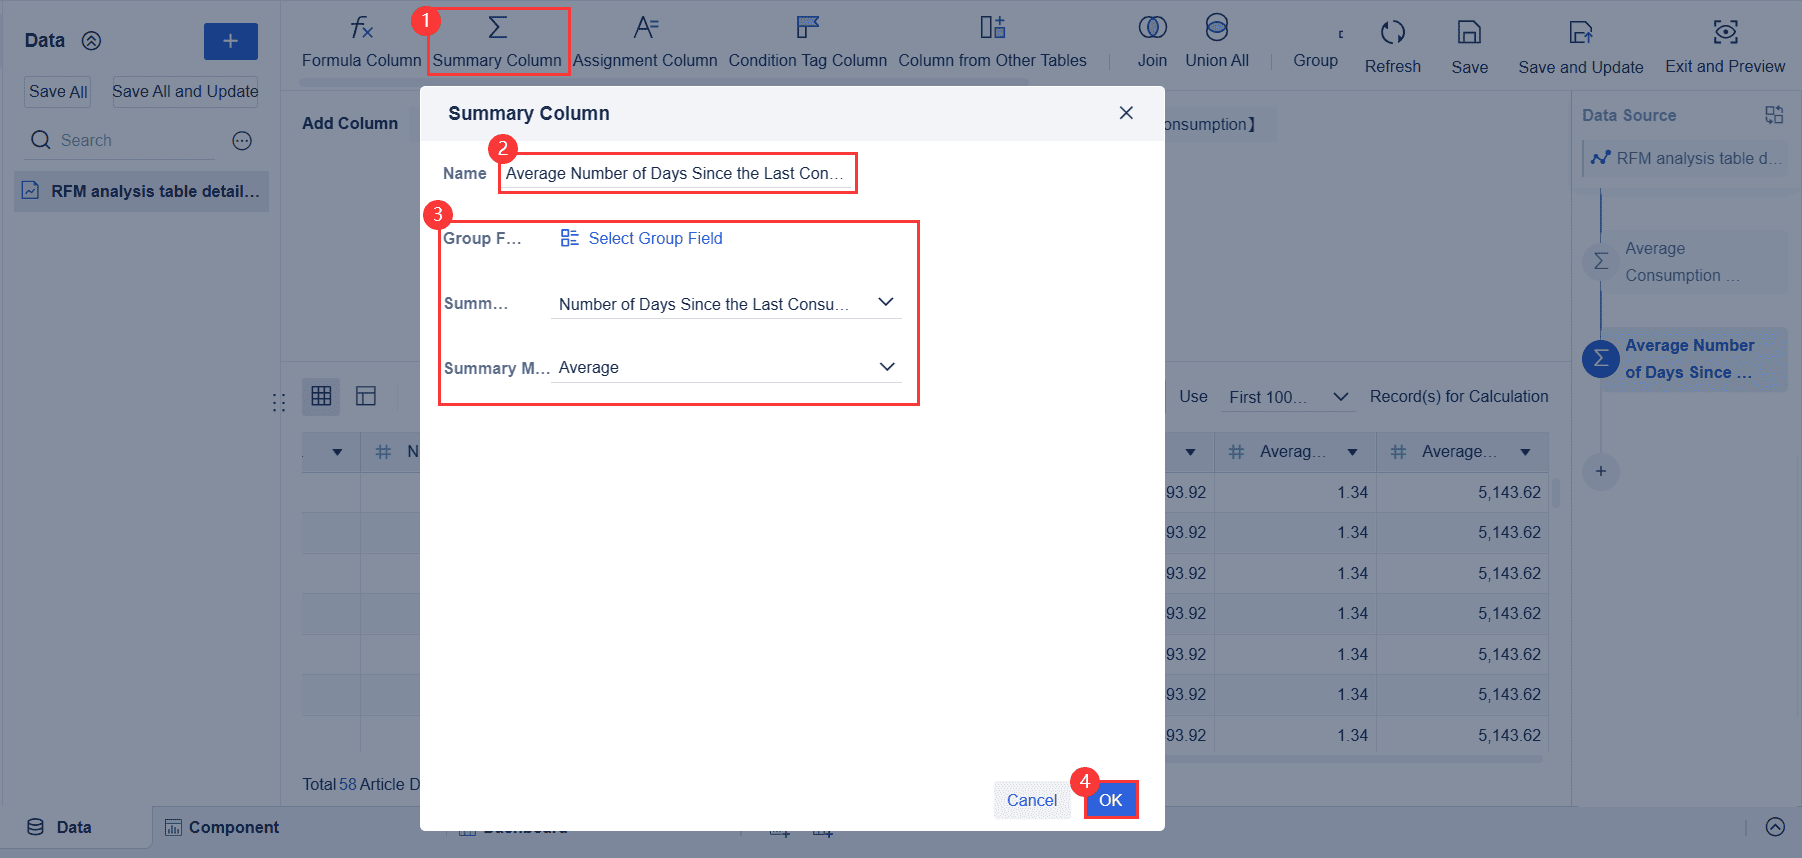
(3) Calculate the number of days since the last consumption of each customer and add a column to calculate the time interval, as shown in the following figure.
You need to know how your customers compare to the average. To do this, use percentile-based methods like quartiles or deciles. These methods group customers into buckets based on their rfm values. For example:
This approach helps you see which customers are above or below average in recency, frequency, or spending.
Average Consumption Amount of Customers
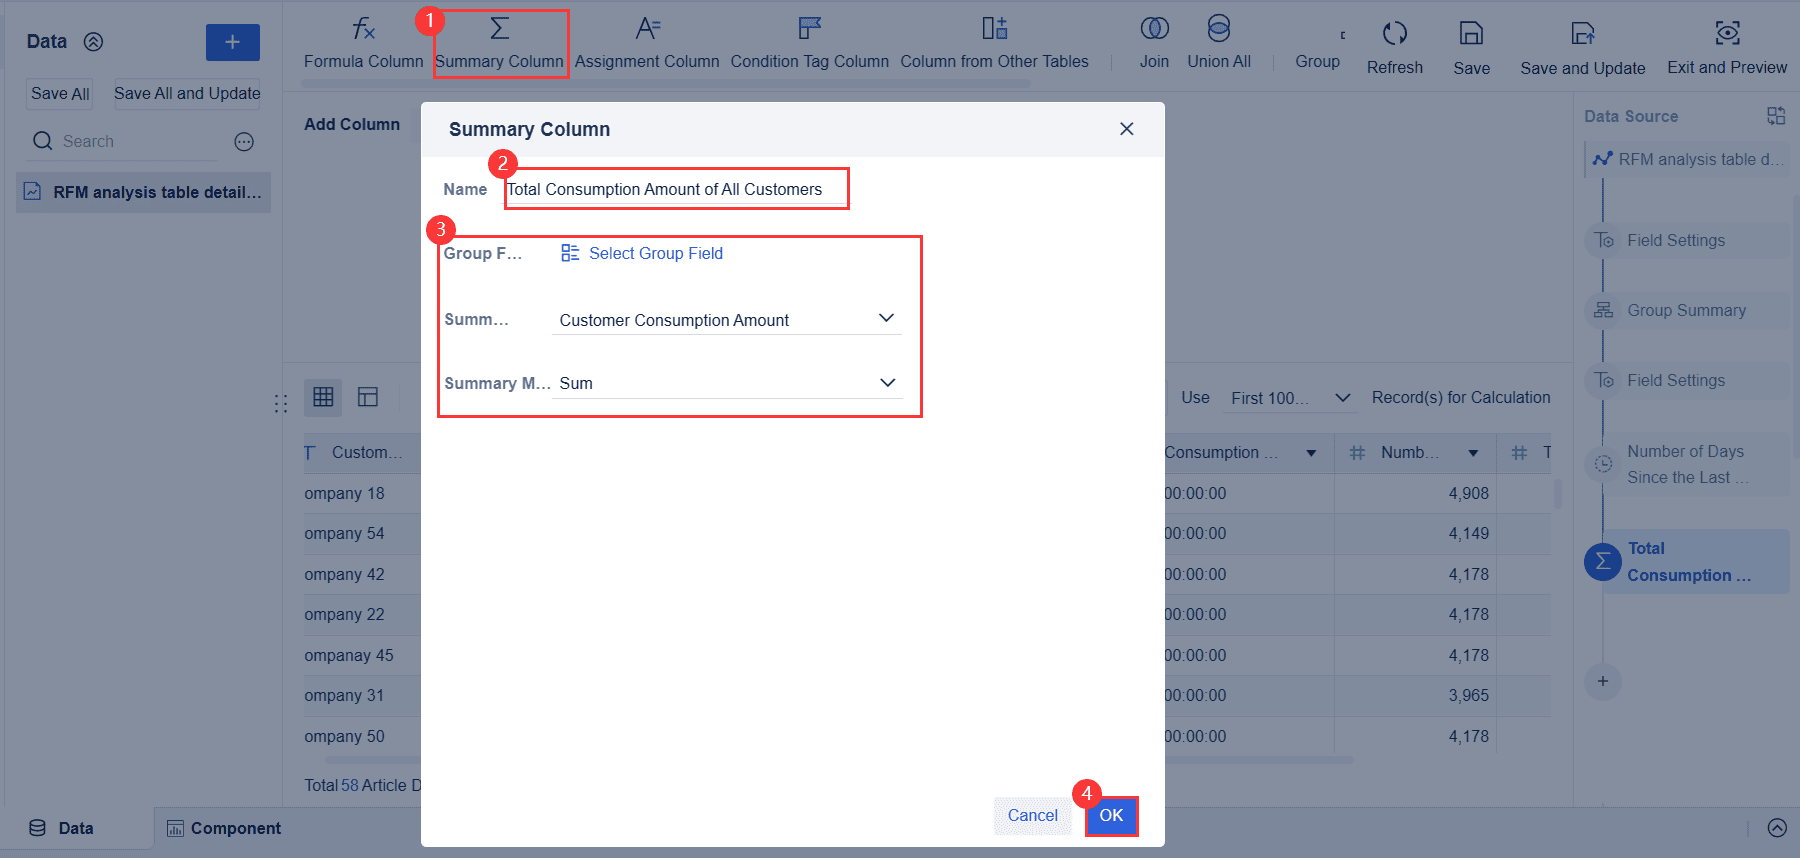
(1) Add a column to calculate the total consumption amount of all customers, as shown in the following figure.
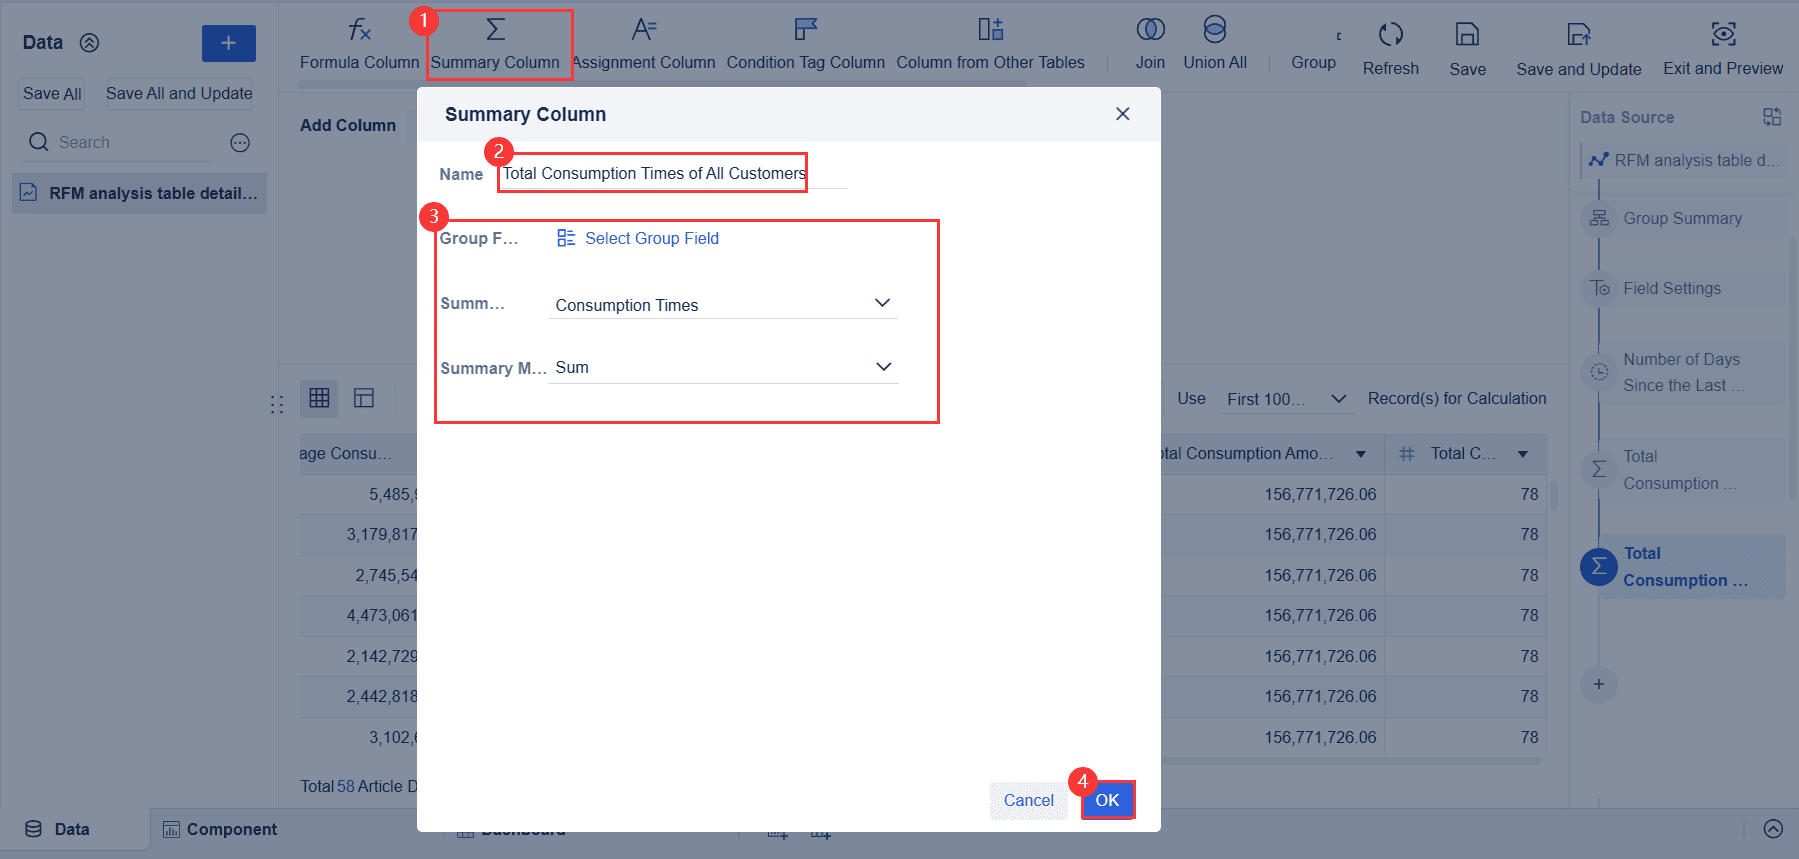
(2) Add a column to calculate the total consumption times of all customers, as shown in the following figure.
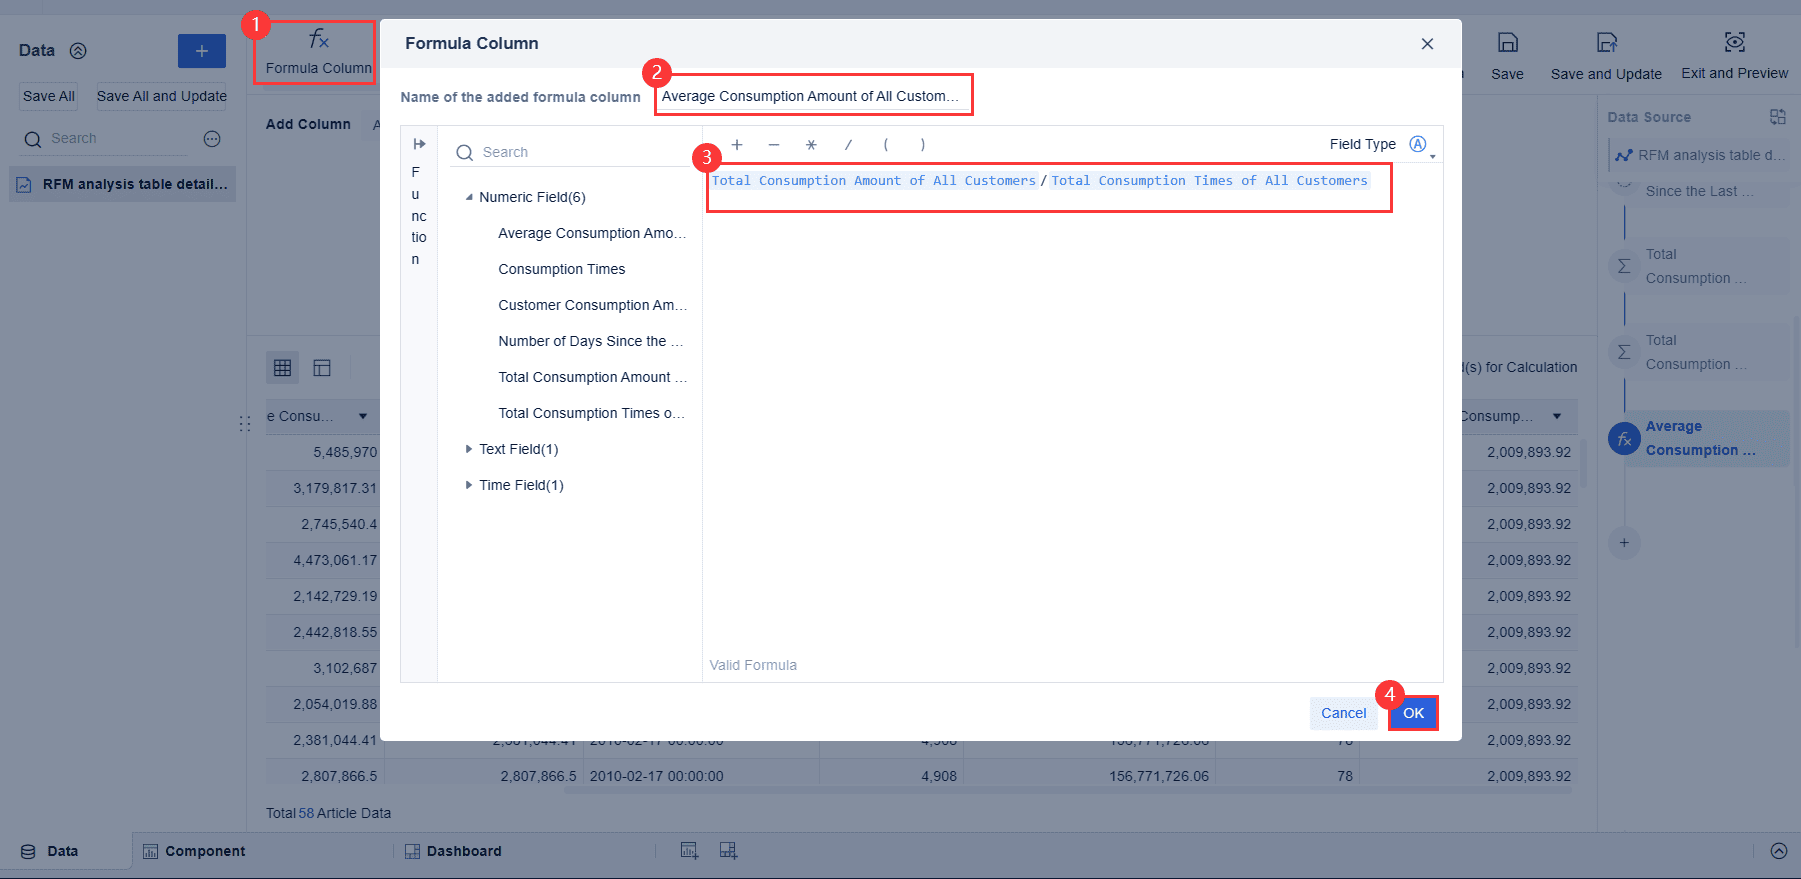
3) Add a column to calculate the average consumption amount of all customers (Average consumption amount of all customers = Total consumption amount of all customers/Total consumption times), as shown in the following figure.
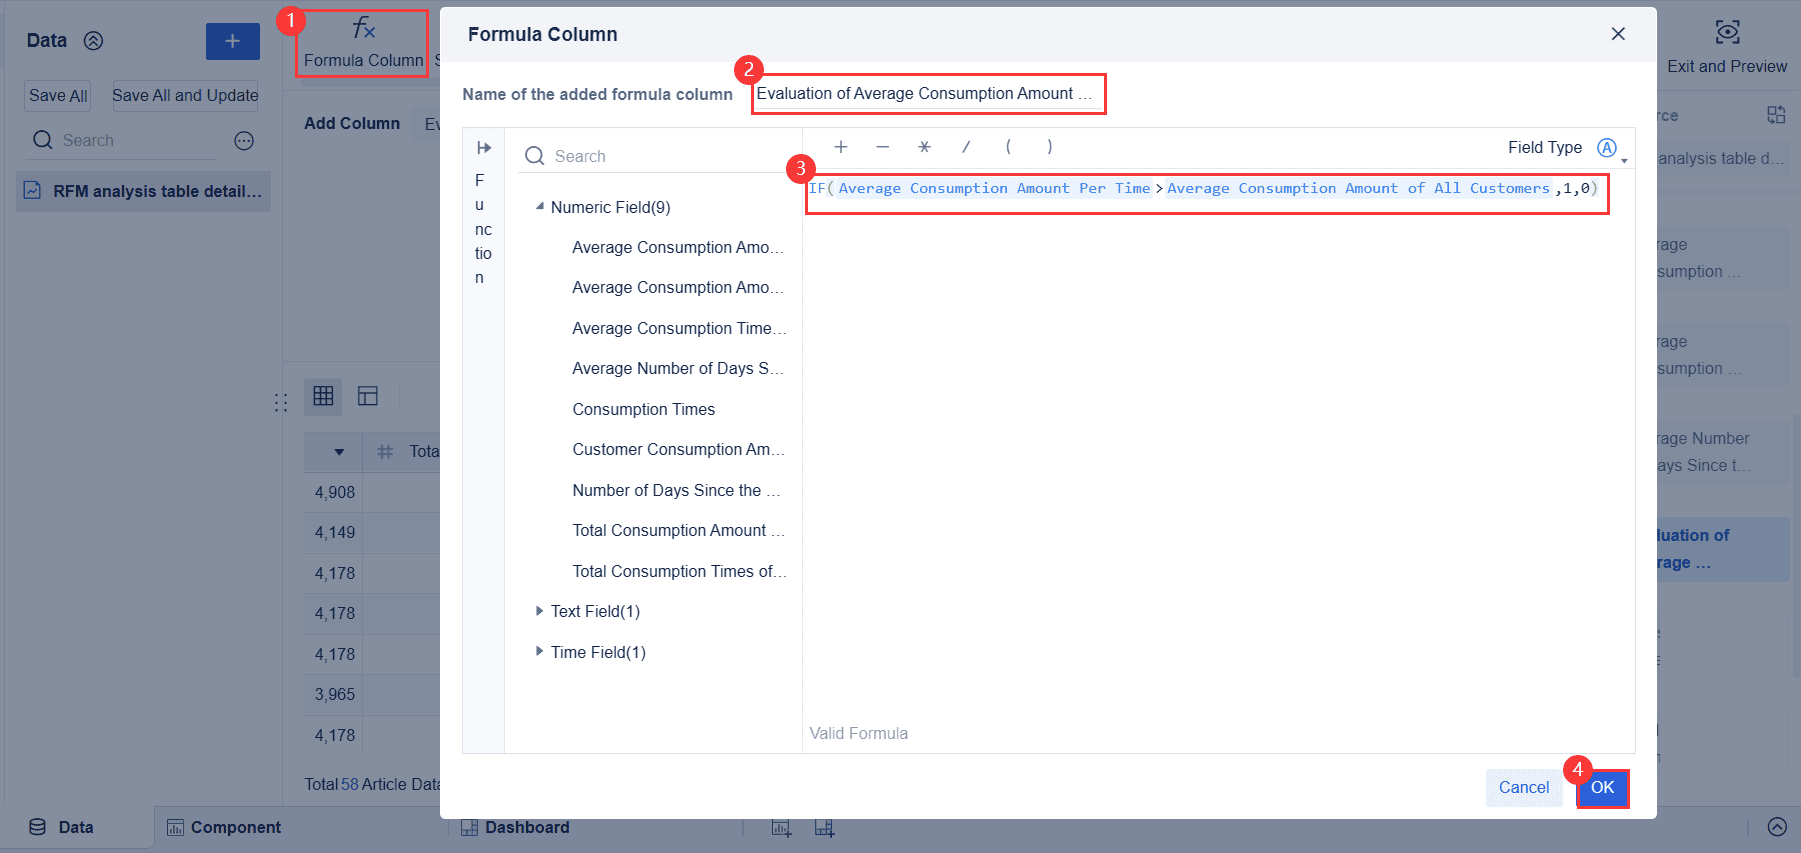
Perform evaluation based on whether the key indicators are higher than average levels of customers. In the IF(xxx>Average xxx of customers,1,0) formula, mark records lower than or equal to the average using 0 (indicating positive features) and records higher than the average using 1 (indicating negative features).
Evaluation of Average Consumption Amount Per Time
Add a formula column named Evaluation of Average Consumption Amount Per Time, and add the IF (Average Consumption Amount Per Time>Average Consumption Amount of All Customers,1,0) formula to mark records whose average consumption amount of a customer per time is greater than the average one of all customers using 1 and records whose average consumption amount of a customer per time is less than or equal to the average one of all customers using 0, as shown in the following figure.
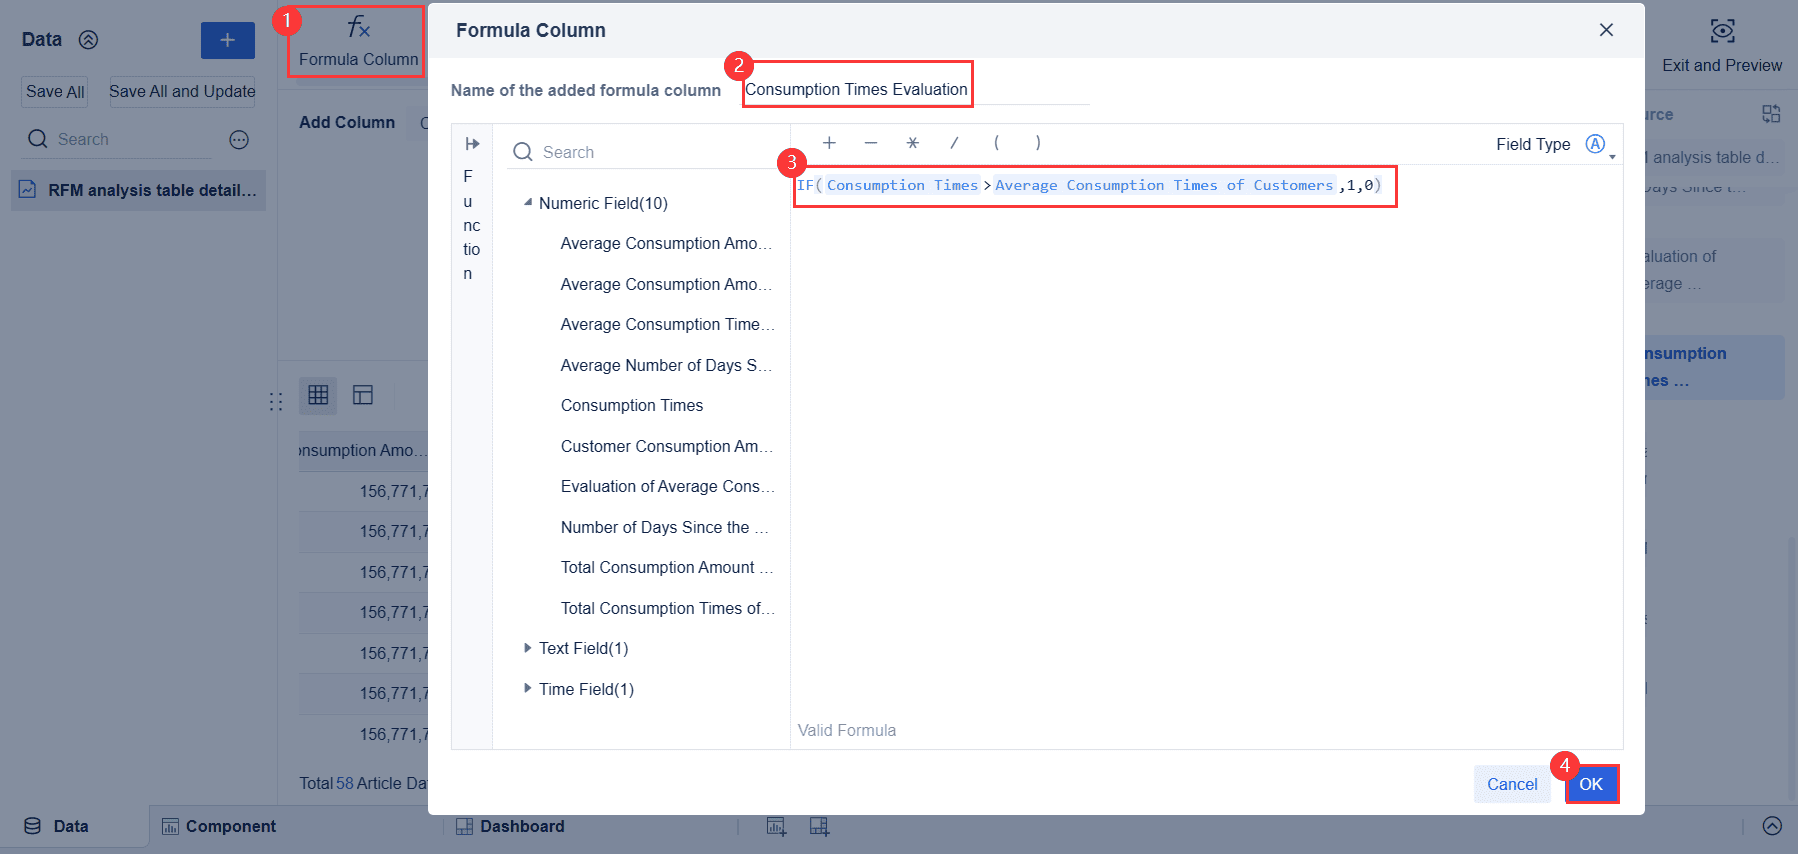
Consumption Times Evaluation
Add a formula column named Consumption Times Evaluation, and add the IF (Consumption Times>Average Consumption Times of Customers,1,0) formula to mark records whose average consumption times of a customer is greater than the average one of all customers using 1 and records whose average consumption times of a customer is less than or equal to the average one of all customers using 0, as shown in the following figure.
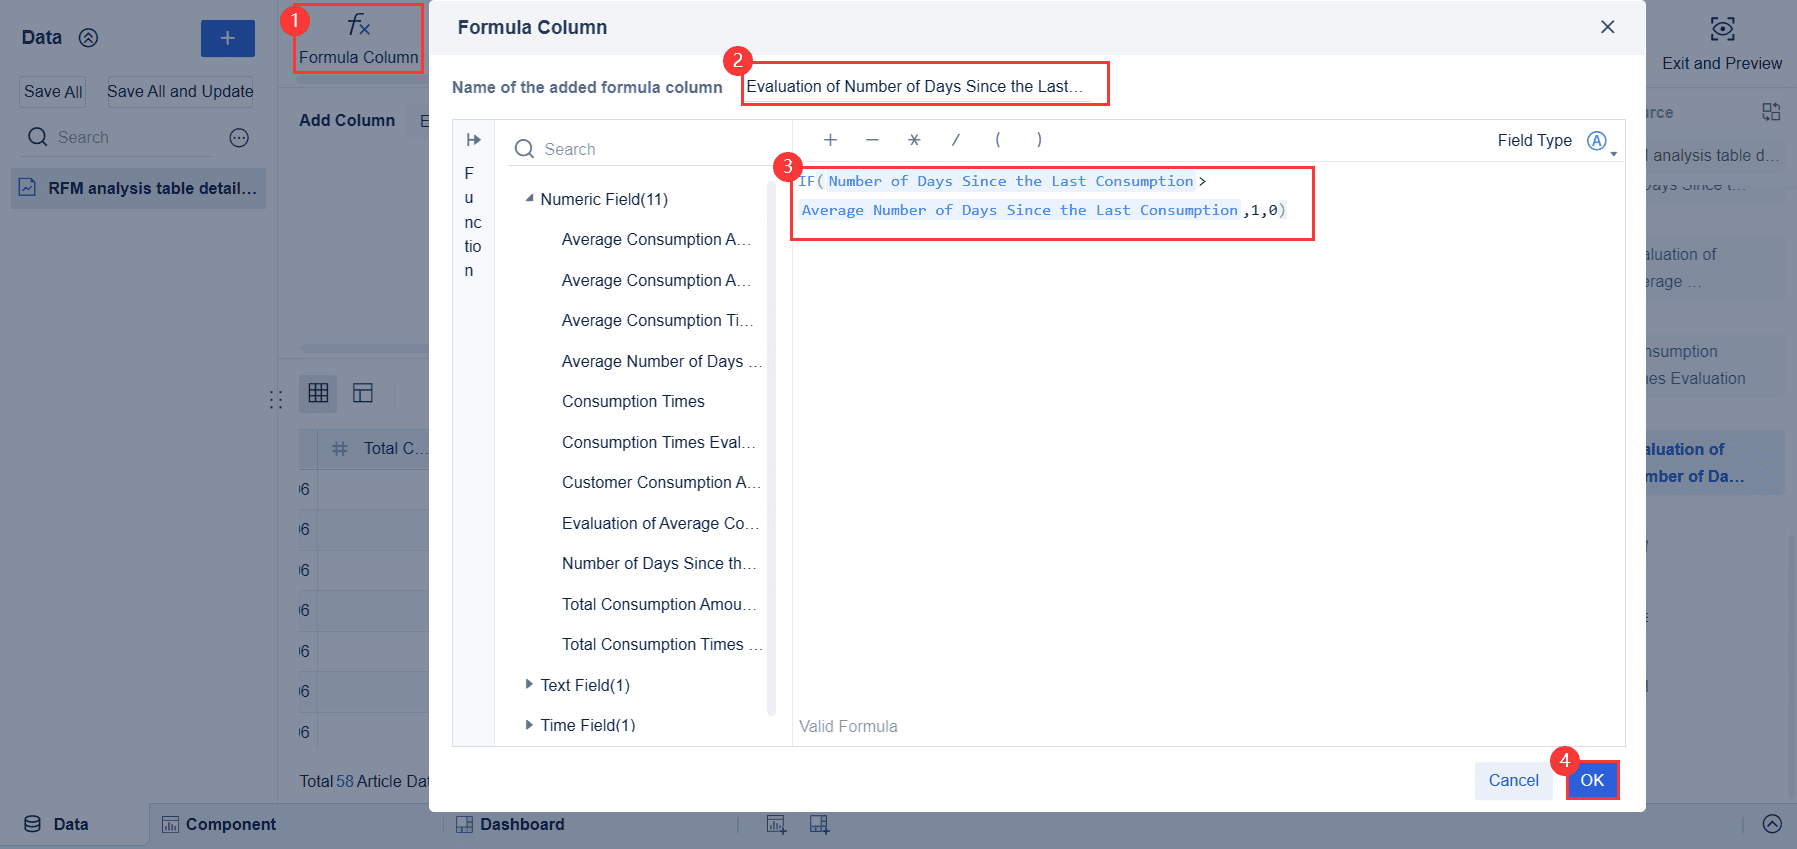
Evaluation of Number of Days Since the Last Consumption
Add a formula column named Evaluation of Number of Days Since the Last Consumption, and add the IF (Number of Days Since the Last Consumption>Average Number of Days Since the Last Consumption,1,0) formula to mark records whose average number of days since the last consumption is greater than the average one of all customers using 1 and records whose average number of days since the last consumption is less than or equal to the average one of all customers using 0, as shown in the following figure.
After scoring, you classify your customers. High-spending customers with recent and frequent purchases become your top group. Others may fall into groups like “potential,” “to maintain,” or “to recover.” This classification helps you target your marketing. You can focus on loyal customers or try to win back those who have not purchased in a while. Rfm analysis gives you a clear way to segment your audience and improve your business strategy.
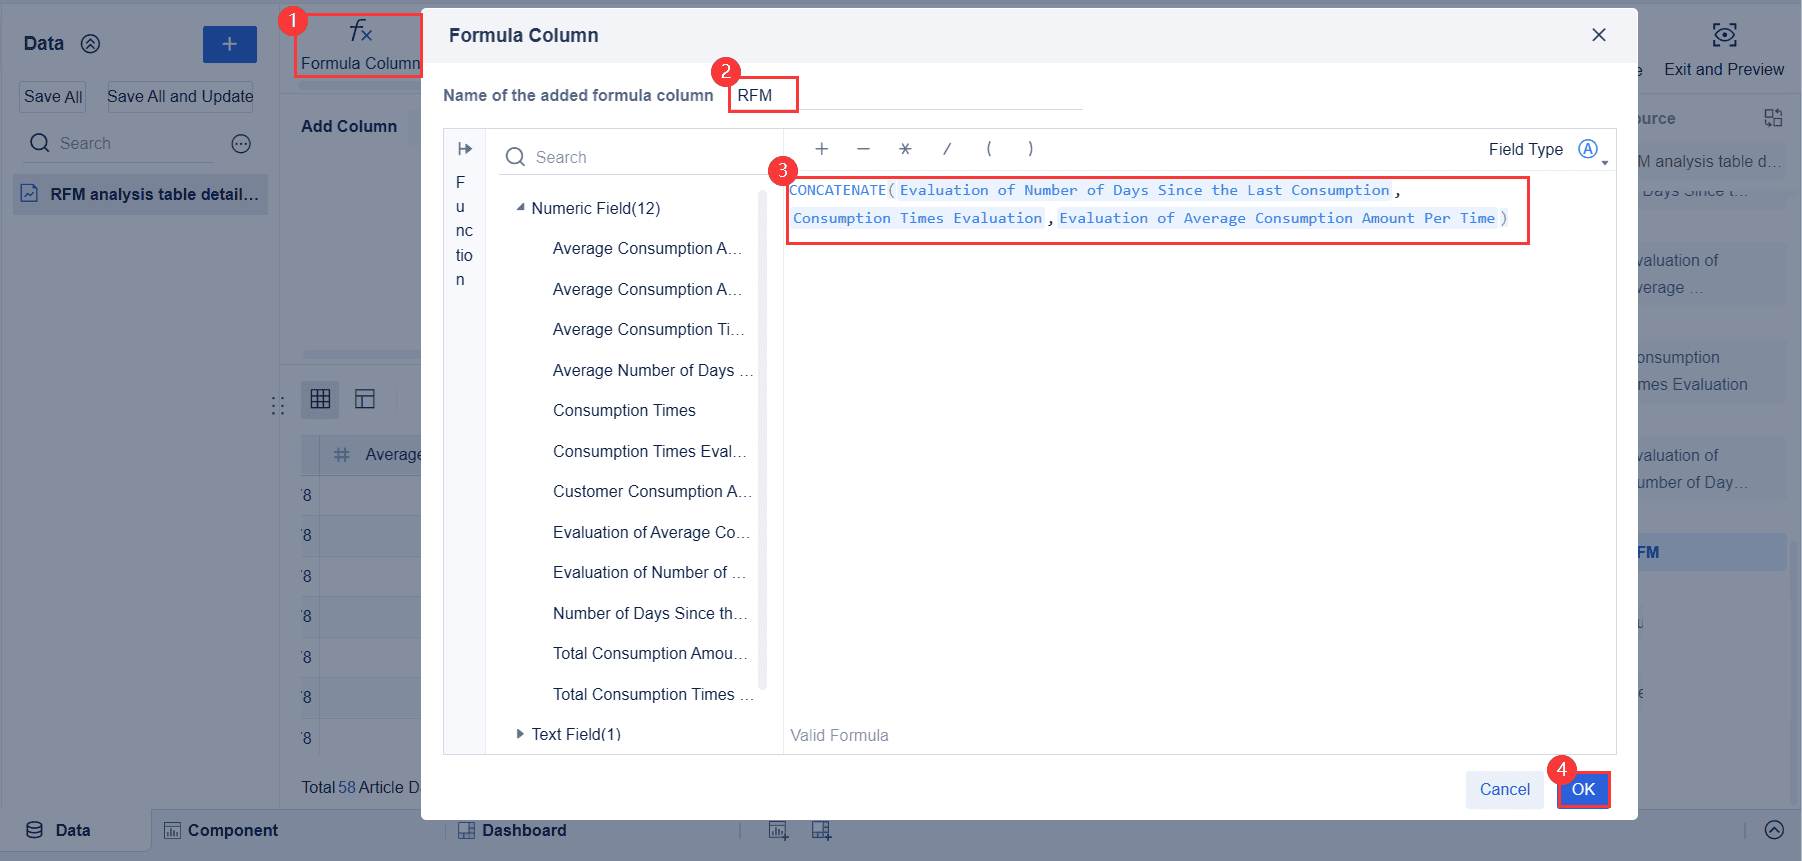
Adding RFM Indicators
Add a formula column named RFM, and use the CONCATENATE() function to concatenate the vectorized values of RFM in the order of evaluation of number of days since the last consumption, consumption times evaluation, and evaluation of average amount of consumption per time. The formula is CONCATENATE(Evaluation of Number of Days Since the Last Consumption,Consumption Times Evaluation,Evaluation of Average Amount of Consumption Per Time), as shown in the following figure.
Classifying RFM Indicators
Add an assignment column named Customer Type and assign values by grouping the records in the RFM column, as shown in the following figure.
Details of the creation process can be found in the RFM Analysis help file.
To get the most out of your rfm analysis, you need to calculate rfm metrics for each customer. FineBI makes this process simple and fast. You can use its self-service analytics tools to automate the calculations and handle large datasets without writing code. Let’s break down each metric step by step.
Recency tells you how long it has been since a customer’s last purchase. This metric helps you find out who your most active customers are. In FineBI, you can calculate recency by following these steps:
For example, if today is June 30 and a customer last bought something on June 20, their recency is 10 days.
You can use FineBI’s drag-and-drop interface to set up this calculation. FineBI lets you group customers by recency, such as “last 7 days,” “last month,” or “last 3 months.” This grouping helps you score customers and see who is most engaged.
Here is a table that shows how recency fits into the rfm model:
| Metric | Calculation Basis | Scoring Approach |
|---|---|---|
| Recency (R) | Time since the customer's last purchase | Graded on custom filters (e.g., last 7 days, 1 month, 3 months) depending on business context |
FineBI can automate this process, so you always have up-to-date recency scores for your customers.
Frequency measures how often a customer buys from you within a set period. This metric helps you spot loyal customers who return again and again. To calculate frequency in FineBI, follow these steps:
Tip: FineBI lets you filter and group data easily, so you can adjust the time frame to fit your business needs.
You can score frequency by creating buckets, such as “bought once a month,” “bought three times a year,” or other custom ranges. FineBI’s self-service analytics make it easy to visualize and compare frequency across your customer base.

Here is how frequency appears in the rfm scoring table:
| Metric | Calculation Basis | Scoring Approach |
|---|---|---|
| Frequency (F) | Number of purchases in a fixed time period | Graded on custom filters (e.g., bought thrice a year, once a month) depending on business context |
With FineBI, you can automate frequency calculations and update them as new data comes in.
Monetary value shows how much money each customer spends with your business. This metric helps you identify your highest-value customers. FineBI makes it easy to calculate monetary value with these steps:
Note: FineBI supports data from many sources, so you can bring in all your sales records for a complete view.
You can group customers by how much they spend, such as “spent more than $1,000,” “spent between $500 and $1,000,” and so on. FineBI’s automation means you can refresh these values whenever you update your data.
Here is the monetary value row from the rfm scoring table:
| Metric | Calculation Basis | Scoring Approach |
|---|---|---|
| Monetary Value (M) | Total amount spent by the customer | Graded on custom filters (e.g., spent more than $10,000, $30,000, $50,000) depending on business context |
FineBI’s self-service analytics let you calculate rfm metrics quickly and accurately. You can focus on analyzing your results and planning your marketing strategies, rather than spending time on manual calculations.
With FineBI, you can automate the entire rfm process, from data import to scoring and segmentation. This saves you time and ensures your analysis is always up to date.
You can start by assigning RFM scores to each customer. This step turns raw data into clear numbers that show how valuable each customer is to your business. FineBI helps you do this quickly and accurately.
First, you need to score each part of RFM—Recency, Frequency, and Monetary value. FineBI uses percentile ranks, often called quintiles, to do this. You divide your customers into five groups for each metric. Customers in the top 20% for spending get a score of 5 for Monetary value. Those in the bottom 20% get a score of 1. You repeat this for Recency and Frequency.
You combine these three scores to create an RFM code for each customer. For example, a customer with scores of 5 for Recency, 4 for Frequency, and 5 for Monetary value would have an RFM code of 545. This code helps you see which customers are most engaged and valuable.
FineBI makes this process easy. You can use its drag-and-drop tools to set up scoring rules. The platform calculates scores for you, even if you have thousands of customers. You do not need to write any code.

Tip: Assigning RFM scores helps you narrow down the segments that matter most for your business. You can focus your marketing on the right groups.
After you assign RFM scores, you can segment your customers into groups. This is the heart of customer behavior segmentation. FineBI gives you powerful ways to see and understand these segments.
You can use different methods to create segments based on RFM codes. Some businesses use simple rules, while others use clustering algorithms like K-Means or Decision Trees. These methods help you find patterns in your data and group customers who act in similar ways.
FineBI lets you visualize these segments with many chart types:
You can classify segments with clear names. For example, an RFM code of 111 might mean "Lost member." A code of 112 could mean "Important retention of members." These labels make it easy to spot which groups need special attention.
Here are some rfm segmentation examples you might see in FineBI:
You can use these segments to plan your next campaign. For example, you might send a loyalty reward to "Champions" or a win-back offer to "At Risk" customers. FineBI dashboards let you track how each campaign performs for every segment.
Note: RFM analysis helps you understand your customers better. You can use it to increase revenue, improve retention, and design campaigns that fit each segment.
When you use rfm analysis, you see real business results. You can increase your company’s revenue by focusing on the right customers. You can also improve customer retention, which is often more valuable than finding new customers. Targeted campaigns based on RFM segments help you get the most out of your marketing budget.
FineBI’s dashboards make it easy to monitor your segments. You can see which groups respond best to each campaign. You can also adjust your strategy as customer behavior changes over time.
With FineBI, you can turn complex data into clear insights. You can make smarter decisions and grow your business with confidence.
You can create a rfm model in excel to analyze your customer data without advanced software. Follow these steps to build your own model:
=DATEDIF(purchase_date, current_date, "D") to get days since the last purchase.You can repeat this process to create a rfm model in excel for different datasets. This method helps you spot high-spending customers and plan your next campaign.
When you use rfm, you can target your marketing more effectively. Many retail businesses group customers into segments like Core, Loyal, Whales, Promising, Rookies, and Slipping. You can design a campaign for each group. For example, you might send loyalty rewards to Core customers or special offers to Rookies.
Membership management systems work even better when you add rfm insights. You can spot Champions, At-Risk, Loyal, and Lost Customers. This lets you send the right message to each group. You can reduce churn and increase customer lifetime value by using targeted rewards and re-engagement offers.
FanRuan’s solutions help you combine rfm data from your CRM, e-commerce, or loyalty programs. You get a full view of each customer. You can automate campaigns and update rfm scores often. This keeps your retention strategies fresh and effective. With dashboards and visual tools, you can track how each campaign performs and adjust your approach for better results.

Tip: Use rfm segments to personalize every campaign. You will see higher engagement and better returns.
You now know how to use rfm to group your customers and improve your marketing. FineBI gives you the tools to automate each step, from data integration to customer segmentation. As more companies use AI for customer analysis, you can expect even smarter segmentation and real-time insights. New trends include predictive segmentation, privacy-focused AI, and real-time campaign activation. Try exploring advanced analytics or connect your rfm insights with other FanRuan business intelligence solutions to stay ahead.
Click the banner below to try FineBI for free and empower your enterprise to transform data into productivity!

What is RFM Model & RFM Analysis?
How to Conduct a Demand Analysis for Your Business
How to Do Retention Analysis for Your Business
What is Market Basket Analysis and Why it Matters?
Unlocking Startup Success with the AARRR Metrics Framework
Unlocking User Retention with Effective Life Cycle Analysis

The Author
Lewis
Senior Data Analyst at FanRuan
Related Articles
What is Ecommerce Analytics and Why Does It Matter
Ecommerce analytics helps online stores track data, optimize sales, and enhance customer experience for better growth and profitability.
Lewis
Jan 04, 2026
What is Ad-Hoc Analysis and Why is it Important
Ad-hoc analysis lets you answer unique business questions instantly, offering flexible, real-time insights that drive smarter, faster decisions.
Lewis
Sep 16, 2025

What Is a Data Model and Why Does It Matter
A data model defines how data is structured and connected, making information easier to manage, analyze, and use for smarter business decisions.
Lewis
Aug 04, 2025


