Customer behavior analysis is the study of how customers interact with a brand and make purchasing decisions. It involves examining both quantitative data (like purchase history) and qualitative data (like customer feedback) to understand customer preferences, needs, and motivations.Understanding customer behavior analysis drives growth and retention. Companies that analyze customer behavior with the right tools see measurable results.
A 5% increase in customer retention can boost profits by 25-95%.
Repeat customers spend 67% more than new customers.
Customer lifetime value rises by 300-500% for engaged customers.
Acquiring new customers costs up to 25 times more than retaining existing ones.
These facts show why consumer behavior analysis matters. Many leaders now ask if their approach delivers actionable insights and supports data-driven decisions. Reflecting on current methods can reveal gaps and opportunities for improvement.
Setting clear objectives forms the foundation of effective customer behavior analysis. Companies often start by defining business goals and setting measurable KPIs. These might include increasing repeat purchases, reducing drop-off rates, or boosting conversion rates. Teams segment customers by demographics, motivations, and challenges to identify valuable groups. They gather both quantitative data, such as metrics and analytics, and qualitative data, like observations and feedback. This approach helps them understand not only how many customers act in certain ways but also why they do so.
Tip: Automating data collection, such as session recordings, ensures a complete and efficient view of customer actions.
Alignment with Business
Aligning customer behavior analysis objectives with overall business goals ensures maximum impact. Companies segment customers by behavior and lifecycle stage. This allows them to tailor marketing strategies, nurture leads, and boost conversion rates. Customer journey mapping helps identify key touchpoints and improve the overall experience.
Many organizations use predictive analytics and AI to anticipate customer needs. This enables them to personalize marketing efforts and meet customers where they are in their buying journey. Data collection and analysis must follow privacy laws to build trust and ensure ethical practices. Tools like CRM platforms and analytics software help teams gather and interpret customer data effectively.
Pitfall
Impact
Avoidance Strategy
Lack of clarity and understanding
Project failure, wasted time, mistrust
Set clear, measurable goals and improve communication
Avoidance of challenging goals
Stifled growth, low motivation
Encourage realistic yet ambitious goals
Poor resource management
Frustration, wasted resources
Allocate resources to support key initiatives
Infrequent reviews & adaptation
Missed opportunities, rigidity
Review and adapt goals regularly
Ineffective use of frameworks
Reduced effectiveness
Apply frameworks like SMART and OKRs correctly
Note: Promoting cross-department collaboration and knowledge sharing accelerates progress and innovation.
Customer Behavior Analysis Data Collection
Data Sources
Companies collect customer behavior data from many sources. These include website visits, mobile app usage, purchase history, and social media interactions. Modern trends show a shift toward omnichannel data collection. This approach captures both online and offline customer actions, giving a complete view of each journey. Businesses also use global consumer panels and surveys to gather detailed behavioral data. AI-powered platforms help combine survey results with market data, making analysis more precise.
FanRuan and FineBI stand out as platforms that unify and integrate diverse data sources for analysis. FineBI connects to databases, files, APIs, and big data platforms. This flexibility allows companies to collect customer behavior data from multiple systems without manual effort.FineBI also supports real-time data updates, so teams always work with the latest information. By using these tools, businesses can build a strong foundation for accurate analysis.
Tip: Connecting all data sources in one platform reduces errors and saves time during customer behavior data collection.
Segmentation
Segmentation divides customers into groups based on behavioral data such as purchase history, browsing patterns, and engagement levels. This process improves the accuracy and relevance of analysis results. Companies can target marketing, sales, and service efforts more precisely by creating tailored segments. Segmentation also supports real-time updates, so groups stay relevant as customer behavior changes.
Segmentation groups customers by key behaviors, revealing common traits.
Tailored segments allow for precise targeting in marketing and service.
Dynamic segments update as customer behavior shifts, keeping insights fresh.
Personalized experiences increase engagement and conversion rates.
Using multiple data sources and refining segments over time ensures accuracy.
Avoiding over-segmentation keeps strategies effective and manageable.
Actionable analysis leads to higher customer loyalty and retention.
Machine learning models now help analyze behavioral data, finding patterns that traditional methods might miss. This leads to better identification of cross-selling and upselling opportunities. By leveraging real-time data and advanced segmentation, companies can deliver experiences that match customer needs and drive business growth.
Tool Selection for Customer Behavior Analysis
Analytics Platforms
Selecting the right analytics platform shapes the success of customer behavior analysis. FineBI stands out as a self-service analytics tool designed for both business users and analysts. FineBI allows users to connect to multiple data sources, prepare data with drag-and-drop features, and build interactive dashboards. This platform supports real-time analysis, which helps teams respond quickly to changes in customer behavior.
When comparing customer behavior analytics tools, each platform offers unique strengths.Tableau provides powerful data visualization and can join data from many databases. However, Tableau often requires advanced skills, making it better suited for data scientists and analysts. Google Analytics focuses on web and app data, offering insights into user journeys and conversion rates. FineBI, in contrast, emphasizes ease of use, enabling business users to explore analytics without coding. It also supports advanced analytics, such as natural language queries and automated insights, making it accessible for a wider audience.
Feature
FineBI
Tableau
Google Analytics
User Focus
Business users, analysts
Data scientists, analysts
Marketers, web analysts
Data Integration
Multiple sources, real-time
Multiple databases
Web/app data
Visualization
Interactive dashboards
Custom, flexible
Standard reports, dashboards
Ease of Use
Drag-and-drop, self-service
Steep learning curve
User-friendly
Tip: Choose analytics tools that match your team's skills and your business needs for the best results.
Integration Tools
Integration tools play a key role in customer behavior analysis by unifying data from different sources. FineDataLink, also from FanRuan-en, enables real-time data integration and stream processing. This tool consolidates information from various systems, ensuring that analytics always reflect the latest customer actions.FineDataLink empowers marketing teams to create real-time dashboards and analyze campaign performance independently, reducing IT dependency.
Unified data access improves collaboration and helps organizations track customer behavior more effectively. With real-time integration, teams can identify trends and respond to market changes faster. FineDataLink supports self-service analytics, allowing non-technical users to generate reports and insights quickly. This approach fosters a data-driven culture and ensures that decisions rely on accurate, up-to-date information.
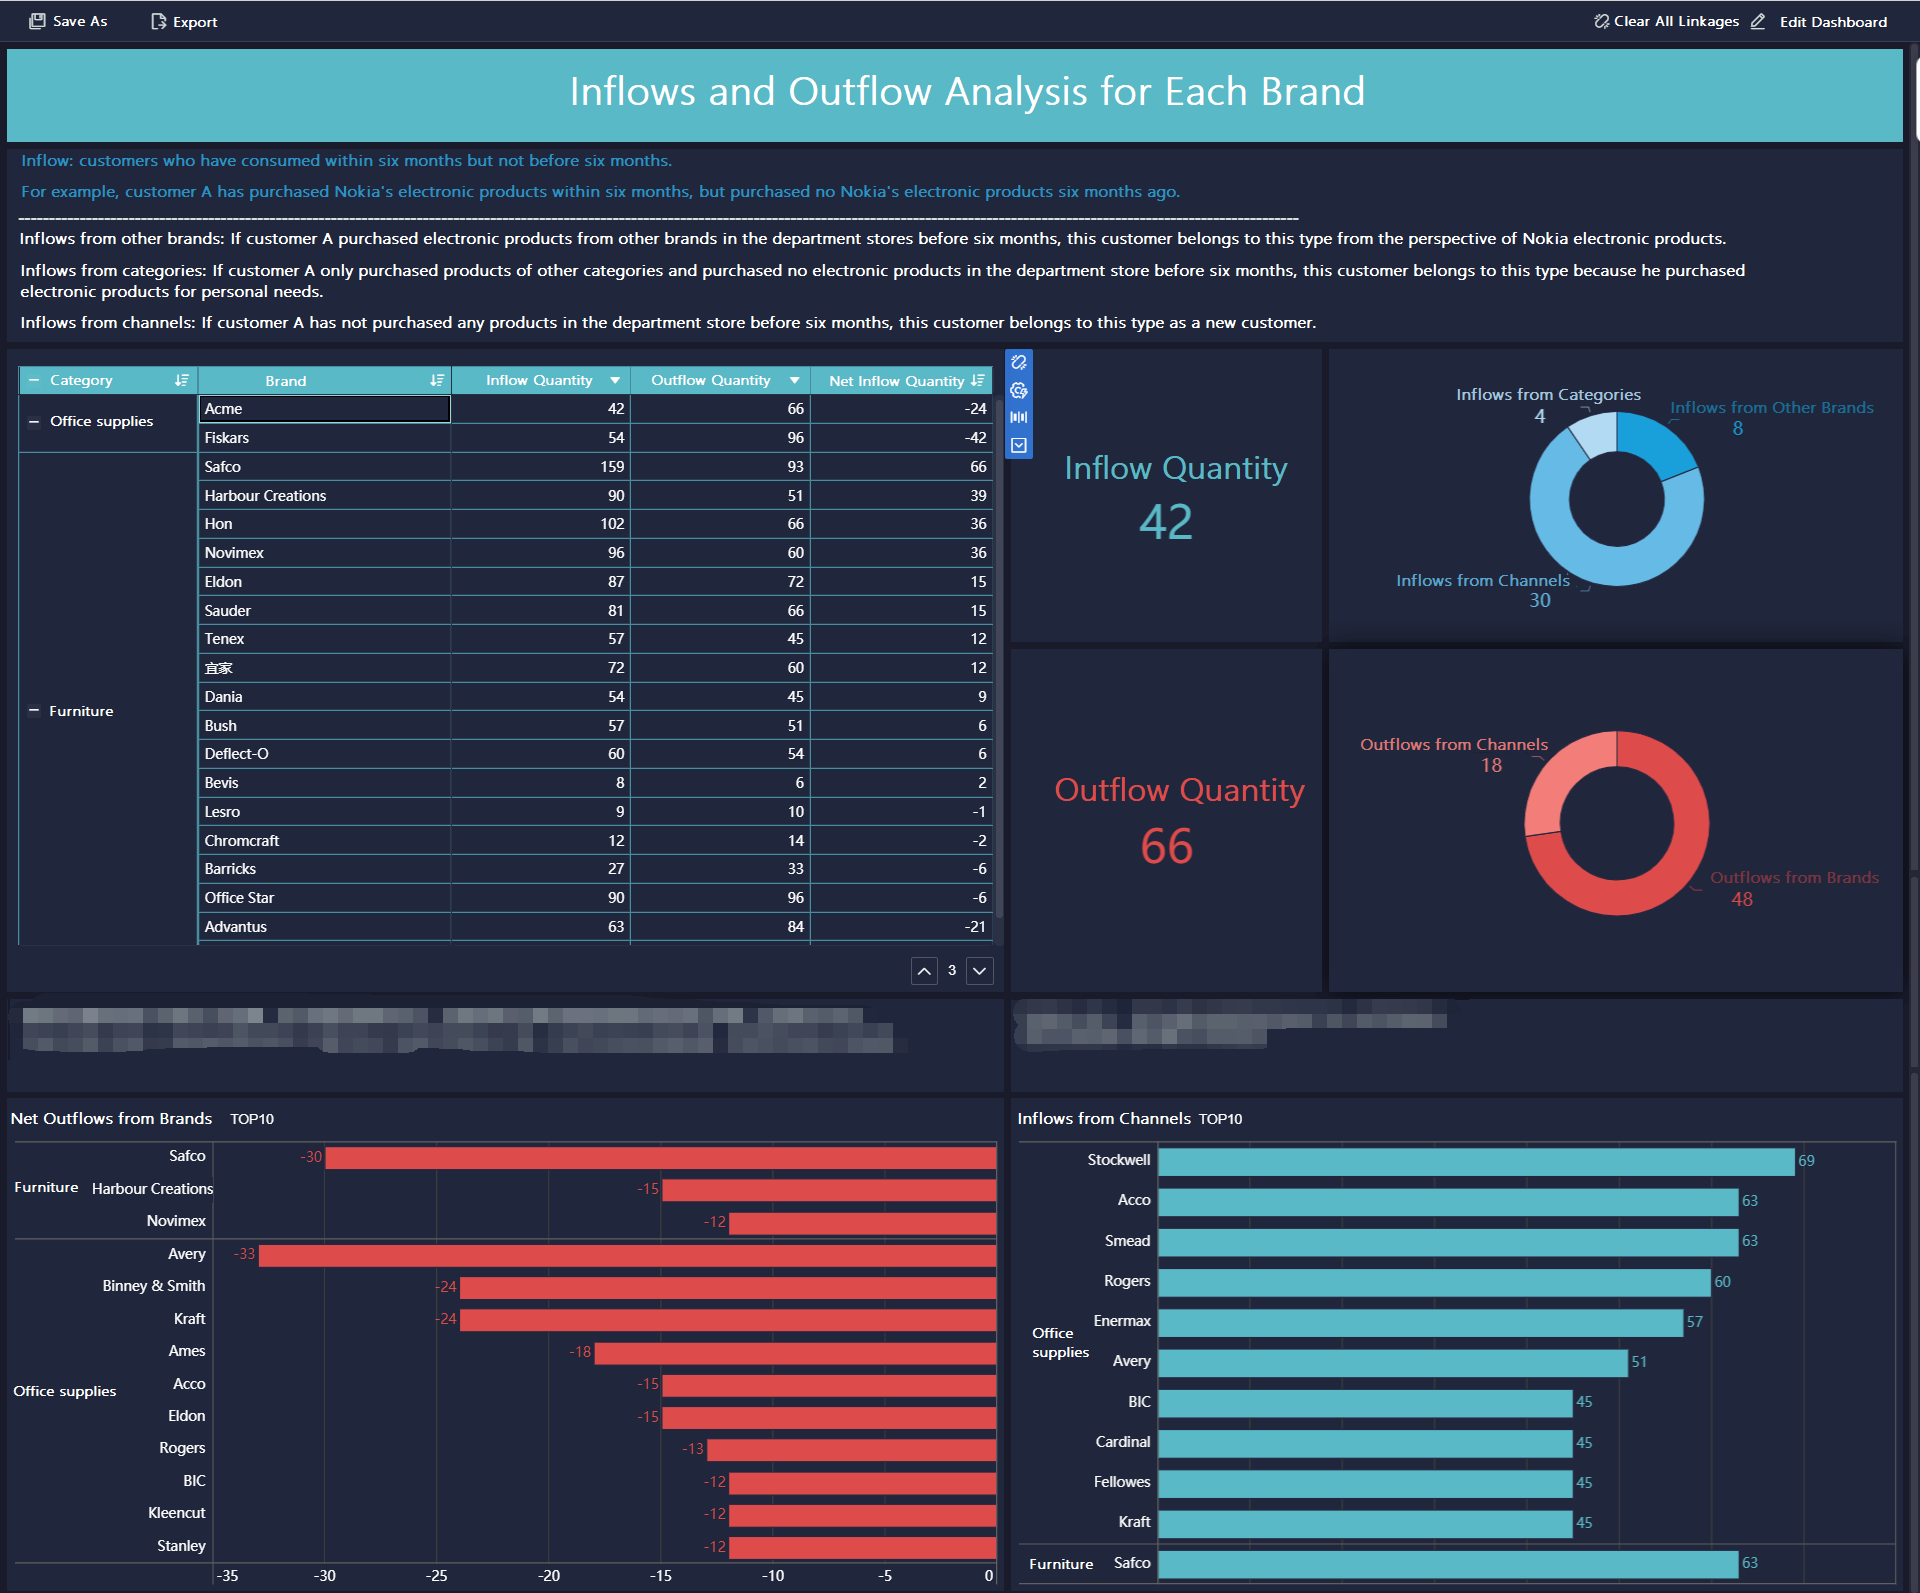
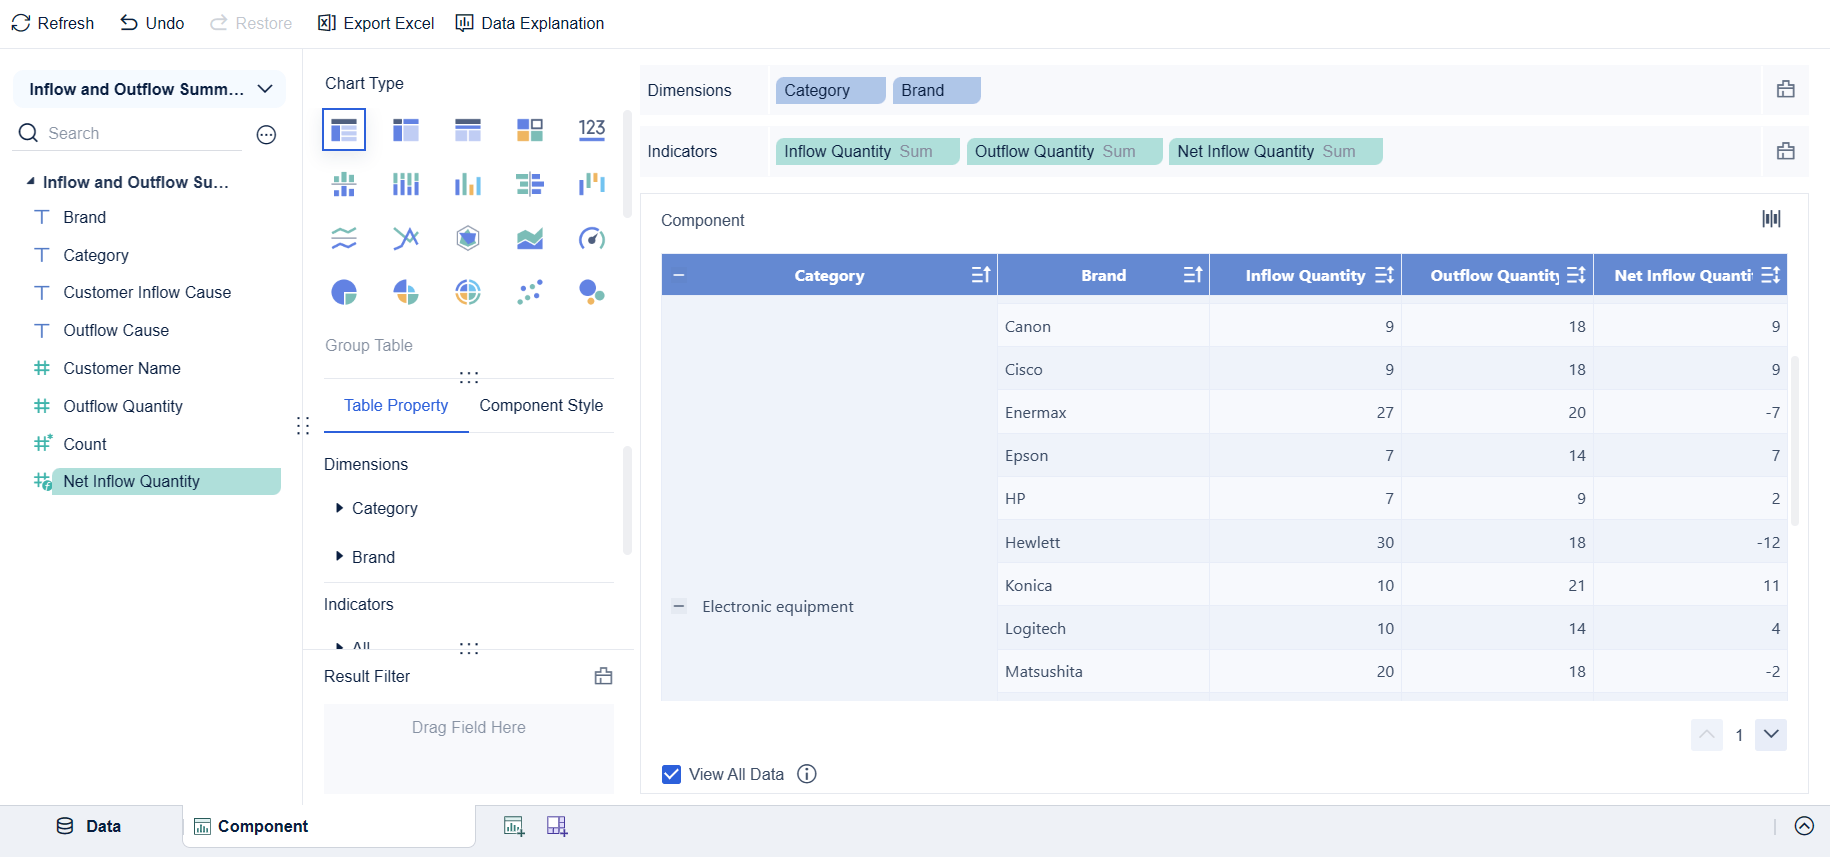
customer behavior analysis procedure
For more information about how to perform customer behavior analysis, refer to the Help Document.
Understanding customer behavior analysis requires a balanced approach. Teams use both quantitative and qualitative methods to gain a complete picture. FineBI supports these methods by offering dashboards, metrics, data interpretation, and anomaly detection. This combination helps organizations turn raw data into actionable insights.
Quantitative Methods
Quantitative methods focus on measurable data and statistical analysis. These methods help teams identify patterns, trends, and relationships in customer behavior. One common approach is the use of single-subject experimental designs. These designs compare baseline and intervention phases within individuals. Teams can observe changes in behavior over time and see the impact of specific actions. Group studies, such as randomized controlled trials, add another layer. They answer broader questions about what works across different customer groups.
Statistical techniques like the Chi-Square method also play a key role. Analysts use this method to examine customer reviews and assess behavior quality. By comparing patterns in reviews, teams can predict changes in customer actions. This approach provides a reliable way to evaluate the effectiveness of marketing campaigns or product changes.
FineBI makes it easy to apply these quantitative methods. Users can build interactive dashboards that track key metrics, such as conversion rates or purchase frequency. Real-time analytics allow teams to spot trends quickly and adjust strategies as needed.
RFM modeling stands out as a powerful tool for customer segmentation. This method scores customers based on Recency, Frequency, and Monetary value. Teams collect historical data, assign scores, and rank customers. By combining these scores, organizations create unique customer profiles. For example, a "5-5-5" profile represents highly engaged, high-spending customers. Other segments might include loyalists, big spenders with low frequency, or at-risk customers. This structured approach helps businesses target the right groups with personalized offers and retention strategies.
Step/Segment
Description
Collect Data and Score
Gather purchase recency, frequency, and monetary value. Score each customer on a 1-5 scale.
Rank Customers
Sort by recency, frequency, and monetary value. Divide into quintiles for scoring.
Combine Scores
Create profiles by combining scores (e.g., 5-5-5 for top customers).
Sample Segments
Champions, Loyalists, Big Spenders, New but Promising, At-risk, Low-value.
Real-world examples show the impact of RFM modeling. Companies like Blacklane increased lifecycle conversions by 194% after using RFM-based segmentation. Floward improved engagement and conversions during seasonal campaigns by combining RFM with personalized messaging. These results highlight the value of quantitative methods in customer behavior analysis.
Tip: FineBI’s dashboards and segmentation tools make it easy to apply RFM modeling and track results in real time.
Qualitative methods help teams understand the reasons behind customer actions. These methods focus on collecting and interpreting non-numerical data. Thematic analysis is a popular approach. Teams review customer feedback to find common themes, such as navigation issues or product preferences. Narrative analysis goes deeper by examining stories from interviews or social media. This helps organizations build detailed customer personas.
Grounded theory analysis allows teams to develop new ideas based on real-world observations. Instead of starting with a hypothesis, analysts let the data guide their understanding of customer behavior.
Several qualitative methods provide valuable insights:
In-depth interviews: One-on-one conversations reveal the motivations behind customer choices. For example, a retail brand learned about sustainability preferences through interviews.
Focus groups: Group discussions uncover collective opinions. A tech company improved app usability by identifying confusing features in focus groups.
Observational research: Watching customers in real settings shows how they interact with products. A coffee shop optimized its layout by observing customer movement.
Case studies: Detailed stories highlight how customers solve problems using a product or service.
Surveys with open-ended questions: These surveys let customers share thoughts in their own words, bridging structured and personal insights.
Ethnographic research: Researchers immerse themselves in customer environments to understand culture and motivations.
Customer support chat history: Analyzing chat logs helps identify recurring issues and customer sentiments.
Social media monitoring: Tracking brand mentions reveals trends and customer opinions.
Review site analysis: Mining reviews uncovers satisfaction levels and areas for improvement.
FineBI enhances qualitative analysis with features like data interpretation and anomaly detection. Users can click on visualizations to explore the factors behind unusual patterns. This helps both experienced analysts and new users gain deeper insights.
Note: Combining quantitative and qualitative methods gives organizations a full view of customer behavior. FineBI’s analytics platform supports both approaches, making customer behavior analysis more effective.
Successful customer behavior analysis starts with clear goals and strong data collection. Teams use integrated tools like FineBI to connect sources and uncover insights. They apply both quantitative and qualitative methods to reveal patterns and drive improvements. These insights help shape effective strategies and support data-driven decisions. Every team can begin today by choosing one method or tool. Continuous learning and action will lead to better results and deeper insights.
Start Free Trial of FineBI to unlock your business potential. For more infomation about its functions, refer to the product guide.
Smarter product, pricing, and inventory management across retail sectors.
FAQ
What is the main benefit of using FineBI for customer behavior analysis?
FineBI allows teams to connect multiple data sources and create interactive dashboards. Users can analyze customer behavior in real time. This leads to faster insights and better business decisions.
How does FineDataLink help with data integration?
FineDataLink synchronizes data from different systems in real time. It supports over 100 data sources. Teams can build a unified data layer for analysis without manual effort.
Can non-technical users work with FineBI?
Yes. FineBI uses a drag-and-drop interface. Business users can create reports and dashboards without coding. This makes data analysis accessible to everyone in the organization.
What is RFM modeling, and why is it important?
RFM modeling scores customers by recency, frequency, and monetary value. Teams use these scores to segment customers. This helps target marketing and retention strategies more effectively.
How often should companies review their customer behavior analysis?
Teams should review customer behavior analysis regularly. Monthly or quarterly reviews help track changes and adjust strategies. Frequent analysis ensures that insights stay relevant and actionable.