Life Cycle Analysis stands as a proven approach for increasing user retention in digital products. Many organizations face challenges like difficulty identifying churn points, poor onboarding, and delayed support, which often leads to reactive retention strategies. By leveraging Life Cycle Analysis, companies gain clear insights into when and why users engage or disengage.
Life Cycle Analysis and User Retention
What Is Life Cycle Analysis?
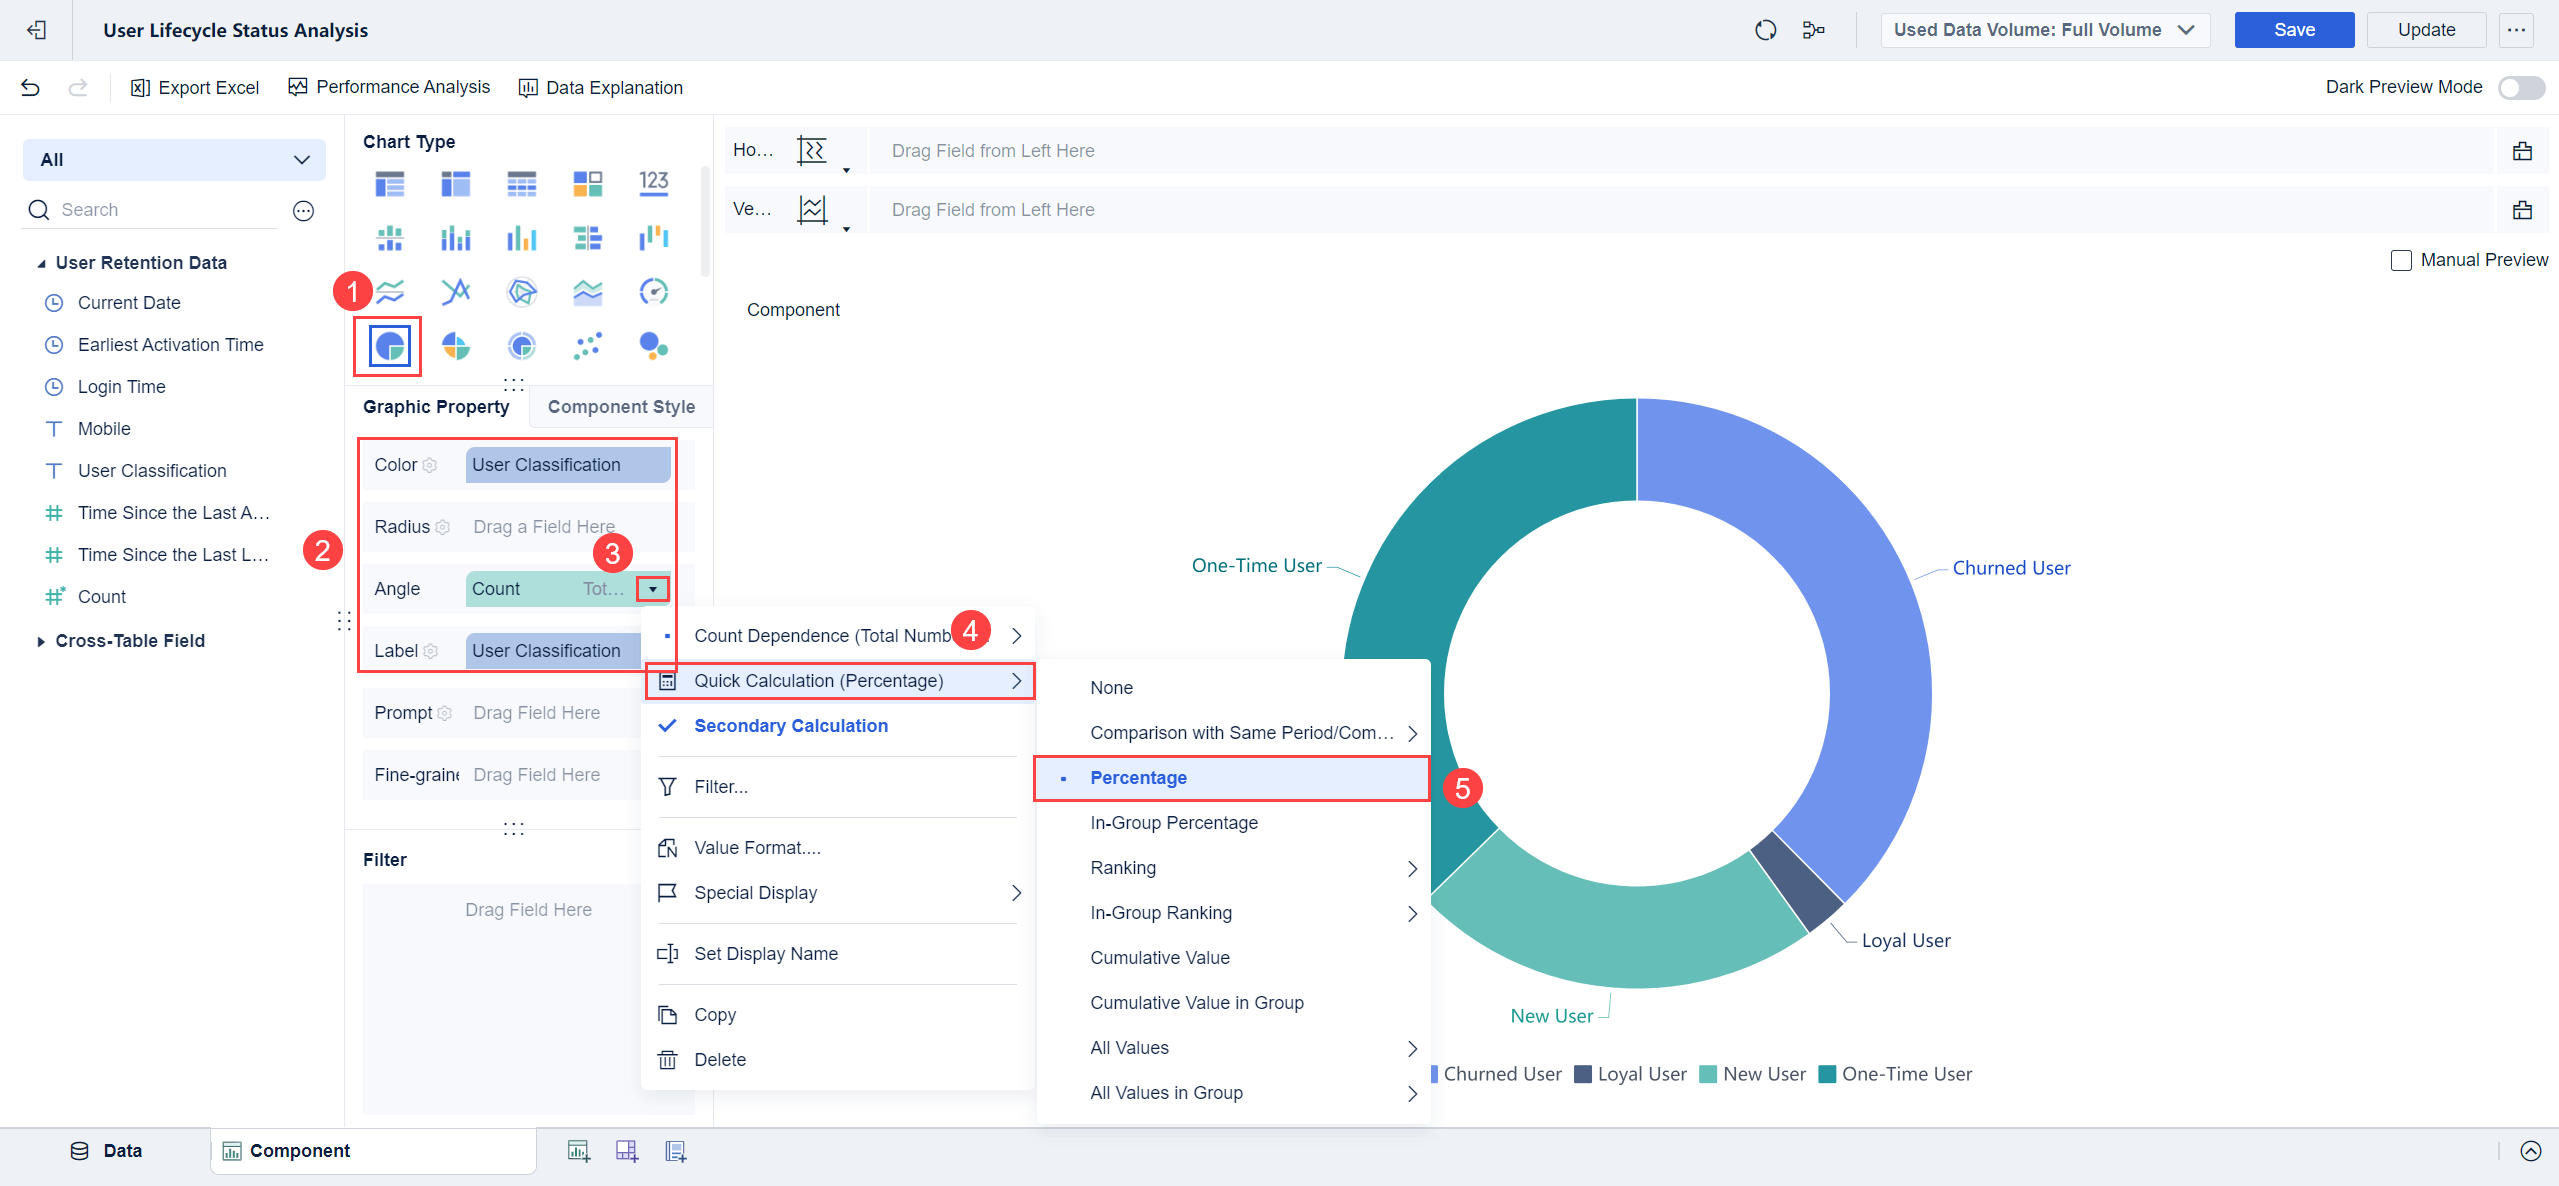
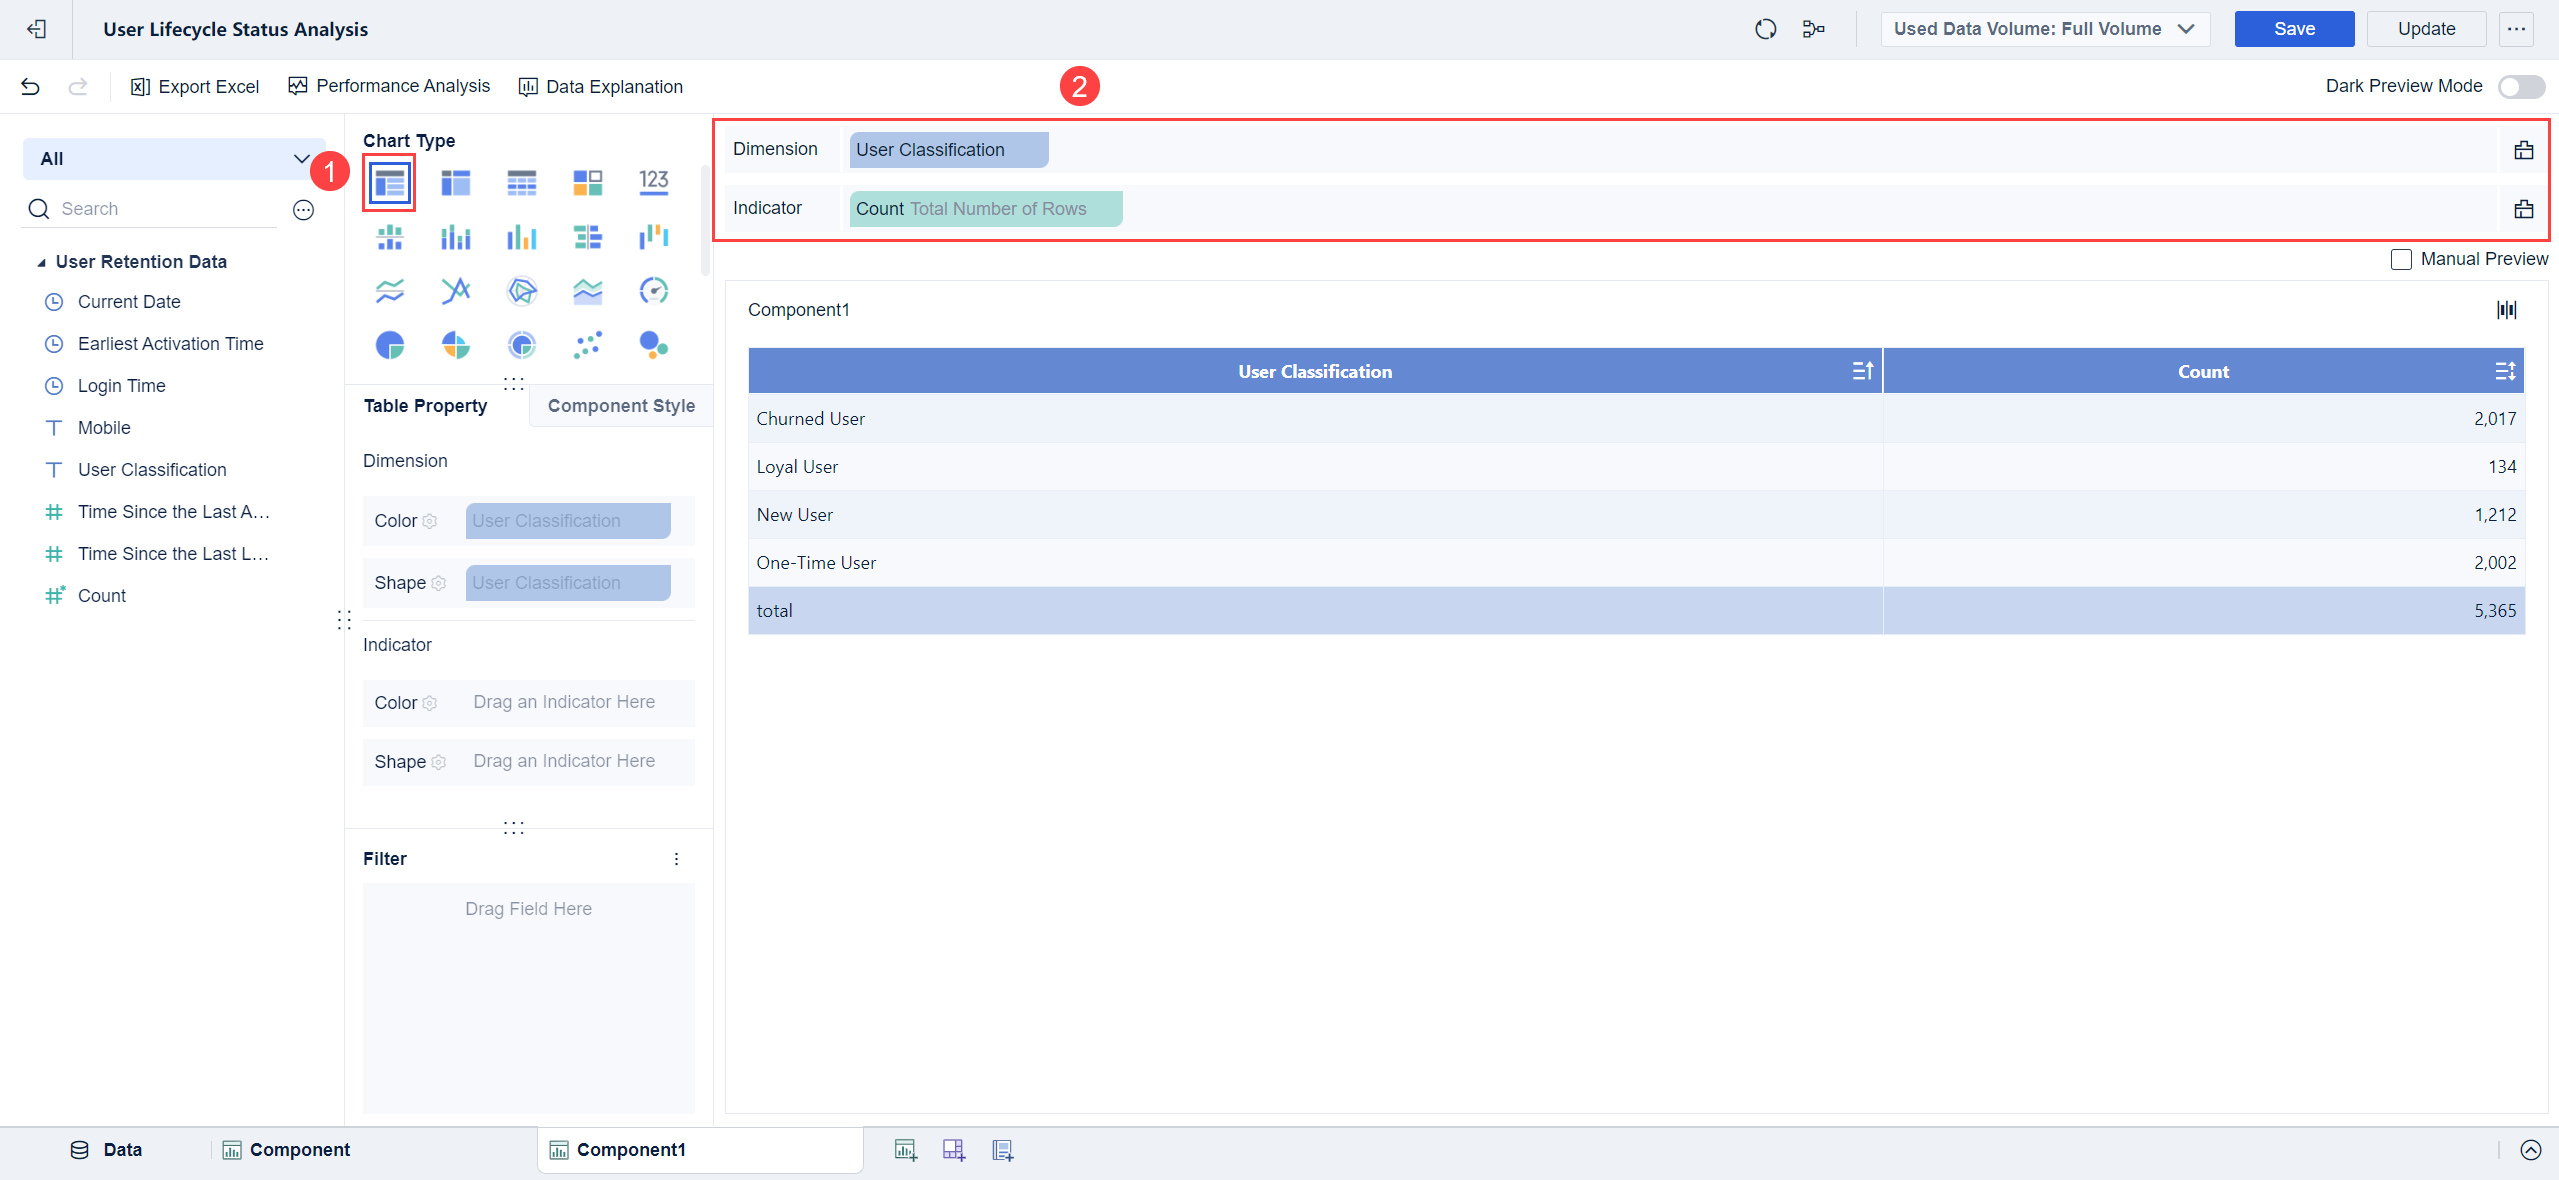
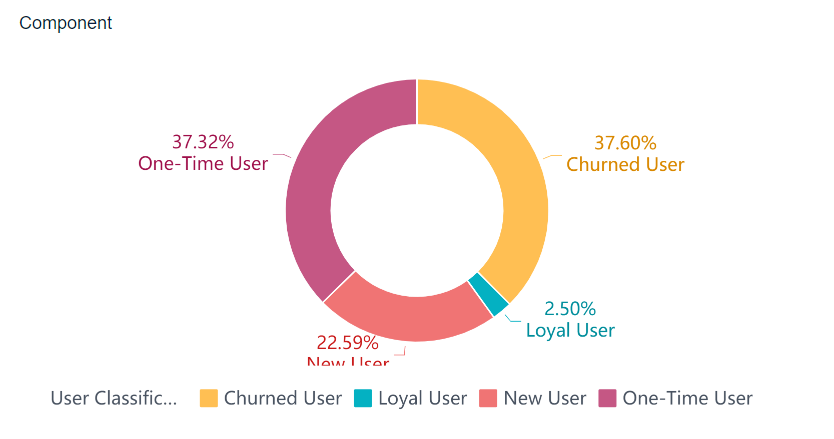
Life Cycle Analysis in user retention involves categorizing customers into distinct stages to better understand and improve engagement. Customers can be classified into four simple categories based on the two dimensions: the time since the last login and the time since the first login.
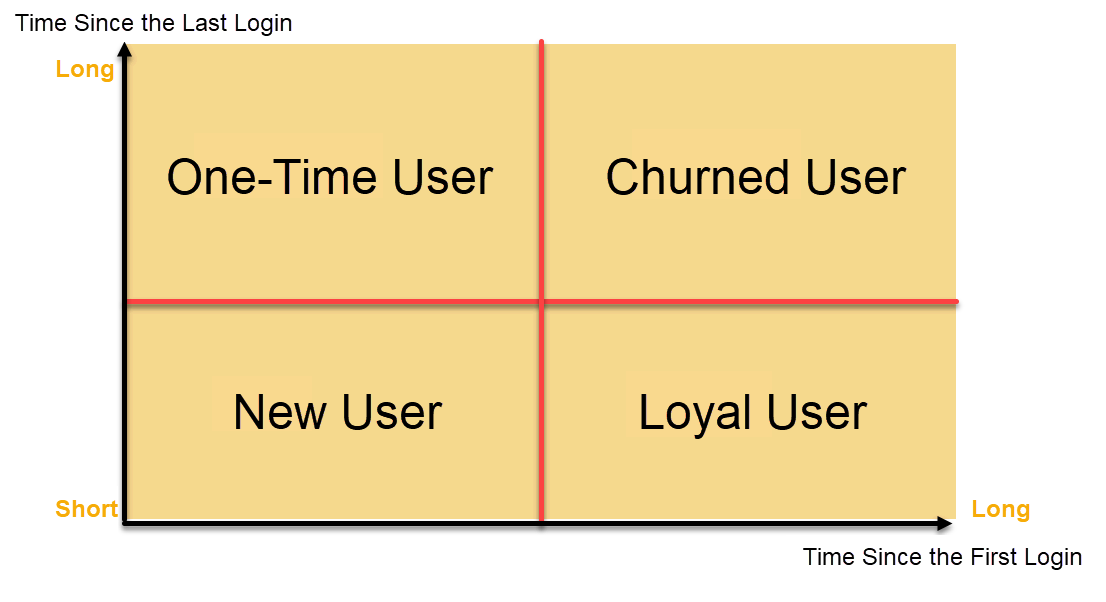
New users: customers who logged in/purchased a product within a short period at the beginning.
One-time users: customers who logged in/purchased a product within a short period but have not continued to purchase recently.
Loyal users: customers who have consistently logged in/purchased a product over a long period and continued to purchase recently.
Churned users: customers who have consistently logged in/purchased a product over a long period but have not continued to purchase recently.
Life Cycle marketing strategies focus on moving customers through these stages, using tailored approaches to boost retention. The customer experience lifecycle also includes awareness, research, purchase, and post-purchase engagement. Customer lifecycle marketing recognizes that the journey does not end at the sale. Instead, it continues through retention and advocacy, requiring ongoing strategies to adapt to evolving customer needs.
Why Retention Matters
Retention plays a critical role in business growth and profitability. Customer retention strategies help companies build long-term relationships, reduce churn, and increase revenue. Research shows that a 5% increase in customer retention can boost profits by 25% or more. Loyal customers spend more and cost less to serve than new ones. Customer lifecycle marketing also lowers acquisition costs, as businesses do not need to replace lost customers as frequently. Retained customers provide valuable feedback, which improves products and services. High retention rates create stable revenue streams and support sustainable growth.
Guide to Life Cycle Analysis
Mapping Lifecycle Stages
Life Cycle Analysis begins with mapping the journey each user takes within a digital product. Companies often define standard lifecycle stages, which include:
- Strategy and Conceptualization: Teams identify user personas and set the product vision.
- Design: Designers create user interfaces that address user needs.
- Development: Developers build the product through iterative sprints.
- Launch: Organizations execute marketing strategies and monitor user acquisition.
- Growth: Teams focus on scaling, acquiring, and retaining users.
- Evolution: Businesses gather feedback, provide support, and update the product.
FineBI from FanRuan enables organizations to visualize these stages by integrating data from multiple sources. Teams can use dashboards to track user movement across each phase, ensuring a clear view of the entire lifecycle.
For more information about how to carry out effective life cycle analysis, refer to the Help Document.
Identifying User Behaviors
Life Cycle Analysis relies on understanding both user properties and event properties. User properties describe traits such as activity status or demographics. Event properties capture actions like clicks, purchases, or feature usage. FineBI’s data integration capabilities allow teams to combine these data types for a comprehensive view. Analysts can segment users into groups—such as Power Users, Core Users, or Dormant Users—based on behavior patterns. By leveraging FineBI’s visualization tools, teams can quickly spot trends, friction points, and opportunities for engagement.
Tip: Monitoring feature usage patterns and customer feedback helps predict retention or churn at each lifecycle stage.
Analyzing Drop-Off Points
A critical part of user Life Cycle Analysis involves identifying where users disengage. Analytics often reveal high drop-off rates during onboarding, especially if the sign-up process is lengthy or confusing. Technical issues, lack of communication, and poor documentation also contribute to user abandonment. FineBI empowers teams to pinpoint these drop-off points by visualizing user flows and tracking support tickets. With real-time dashboards, organizations can act quickly to address friction, improve onboarding, and enhance user satisfaction.
| Drop-Off Cause | Detection Method | Solution Example |
|---|---|---|
| Lengthy Sign-Up | Funnel Analysis | Simplify registration steps |
| Technical Issues | Support Ticket Monitoring | Rapid bug resolution |
| Poor Documentation | Feedback Surveys | Update help resources |
Life Cycle Analysis, when powered by tools like FineBI, transforms raw data into actionable insights. This approach helps businesses optimize every stage of the user journey and drive long-term retention.
To explore more functions of FineBI, refer to the product guide.
Customer Retention Strategies of Life Cycle Analysis

Awareness and Onboarding
Effective customer retention strategies begin at the very first interaction. During the awareness and onboarding stages, companies must focus on creating a seamless introduction to their product or service. Lifecycle marketing strategies at this stage include clear communication, guided tours, and easy access to support. FineBI’s self-service analytics and dashboard features allow teams to monitor onboarding progress in real time, identifying where users succeed or struggle.
Personalized onboarding plays a crucial role in user retention. By tailoring the onboarding process to individual customer needs, organizations can reduce friction and accelerate the time to value. FineBI enables teams to segment users and track key onboarding metrics, such as activation rate, time to complete onboarding, and customer satisfaction. The following table outlines essential metrics for evaluating onboarding effectiveness:
| Metric Name | Description | How it Supports Evaluating Onboarding Effectiveness in User Retention |
|---|---|---|
| Trial to Paid Conversion Rate | Percentage of free trial users who become paying customers. | Indicates how well onboarding convinces users of product value, leading to paid subscriptions and retention. |
| Customer Retention Rate | Percentage of customers who continue their subscription over time. | Directly measures the success of onboarding in keeping customers engaged and renewing subscriptions. |
| User Retention Rate | Percentage of users who continue using the product over a period. | Reflects ongoing engagement and satisfaction influenced by onboarding quality. |
| Customer Effort Score (CES) | Measures how easy it is for customers to interact with the product. | Lower effort during onboarding correlates with higher retention and conversion rates. |
| Customer Satisfaction Rate | Measures user happiness and satisfaction with the onboarding experience. | High satisfaction indicates effective onboarding that meets user expectations, promoting retention. |
| Time to Value (TTV) | Time taken for a user to realize the product’s value (Aha! moment). | Shorter TTV suggests efficient onboarding that quickly demonstrates value, improving retention and conversion. |
| User Activation Rate | Percentage of users reaching key activation milestones. | Shows how effectively onboarding guides users to meaningful product engagement, which predicts retention. |
| Time to Complete Onboarding | Duration for a user to finish the onboarding process. | Helps identify friction points; faster completion often leads to better retention. |
| Product Adoption Rate | Ratio of new active users to sign-ups. | Indicates how well onboarding drives users to adopt and regularly use the product, reducing churn. |
| Product Stickiness | Ratio of daily active users to monthly active users. | Measures ongoing engagement and likelihood of users returning, reflecting onboarding’s role in creating habitual use. |
| Number of Support Tickets | Count of customer support requests related to onboarding issues. | High ticket volume signals onboarding friction points that may harm retention; reducing tickets improves user experience and retention. |
FineBI’s dashboards help teams visualize these metrics, enabling quick adjustments to onboarding flows. Automated lifecycle email marketing campaigns can welcome new users, provide helpful tips, and encourage first actions. Personalized onboarding emails and in-app messages guide users through key features, increasing activation and reducing drop-off. Companies that invest in onboarding as part of their lifecycle marketing strategies see higher customer retention and improved customer experience.
Tip: Surveying new users about their onboarding experience and tracking their time to productivity can reveal hidden barriers and opportunities to improve customer retention.
Engagement and Value Delivery
Once users complete onboarding, the focus shifts to deepening engagement and delivering ongoing value. Lifecycle marketing strategies at this stage rely on understanding user behavior and preferences. FineBI’s analytics capabilities allow teams to segment users, monitor feature adoption, and identify opportunities for personalized user experiences.
Personalization drives engagement and retention. Companies use AI-driven recommendations, automated lifecycle email marketing, and targeted content to keep users active. FineBI enables the creation of dynamic dashboards that track engagement metrics, such as product stickiness, daily active users, and customer satisfaction. Automated lifecycle email marketing campaigns can deliver personalized product recommendations, nurture campaigns, and post-purchase follow-up campaigns to re-engage inactive customers.
- Personalized onboarding processes tailored to customer data and preferences improve retention rates.
- Ongoing personalized support through multiple channels enhances customer satisfaction.
- Customer data segmentation and AI-driven recommendations increase relevance and engagement.
- Continuous adaptation to customer feedback strengthens personalization efforts.
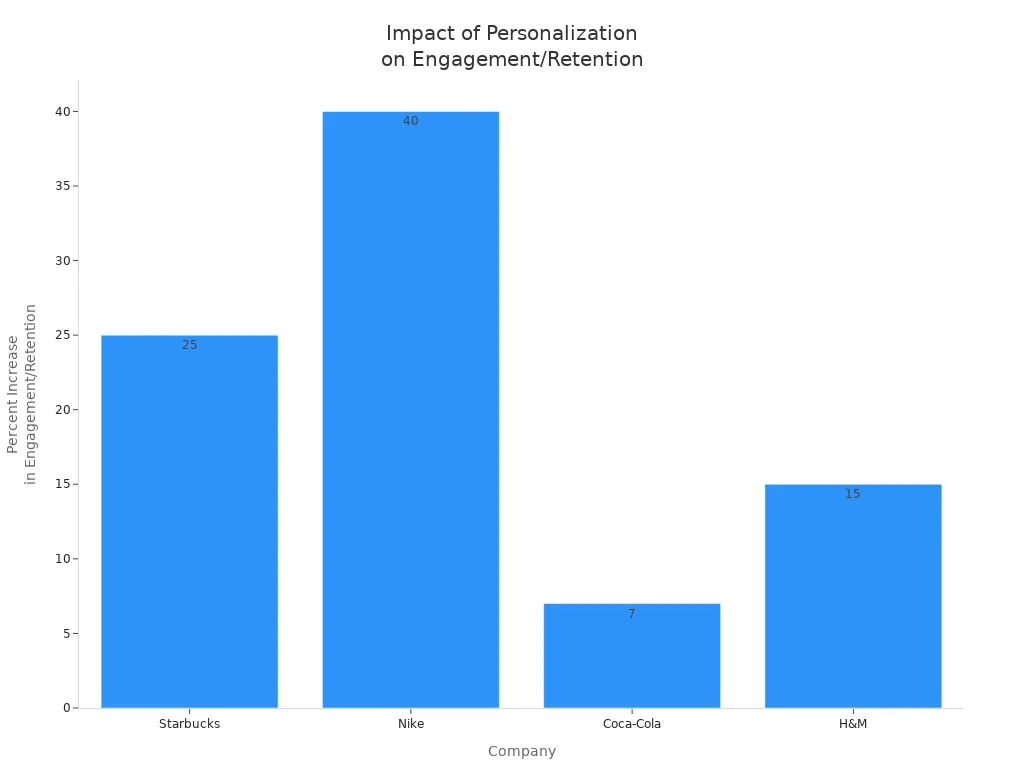
Companies like Starbucks, Nike, and H&M have demonstrated that personalized user experiences lead to significant increases in engagement, loyalty, and sales. FineBI’s self-service analytics empower teams to experiment with A/B testing, contextual upgrade prompts, and automated nurture campaigns. Lifecycle marketing strategies such as loyalty programs, geo-targeted offers, and mobile wallet integration further improve customer retention and customer engagement.
Note: 80% of consumers are more likely to buy from brands offering personalized experiences, and 86% are more likely to stay loyal after receiving educational and welcoming post-purchase engagement.
Advocacy and Loyalty
The final stage of the lifecycle focuses on transforming satisfied customers into loyal advocates. Customer retention strategies here include proactive customer service, omnichannel support, and incentivized loyalty programs. FineBI’s dashboards help teams monitor advocacy metrics, such as referral rates, repeat purchase frequency, and customer lifetime value.
Loyalty programs and referral incentives play a vital role in long-term retention strategies. Companies reward repeat purchases, offer tiered benefits, and encourage customers to refer friends. Automated lifecycle email marketing campaigns can prompt satisfied users to leave reviews, participate in referral programs, or share their experiences on social media. These strategies not only improve customer retention but also attract new users through word-of-mouth.
- Proactive customer service addresses issues before they escalate, using automation and predictive analytics.
- Omnichannel support ensures seamless customer experience across all channels.
- Centralized order tracking and branded returns portals reduce friction and foster loyalty.
- Personalized marketing and flexible return policies enhance customer satisfaction and retention.
- Automated post-purchase follow-up campaigns gather feedback and encourage advocacy.
Referral programs and loyalty incentives create a win-win for both customers and companies. Customers feel valued and appreciated, which strengthens emotional connections and increases customer loyalty. Companies benefit from organic growth, higher retention, and a competitive edge in the market.
Tip: Combining referral programs with loyalty incentives maximizes user retention by nurturing existing customers and attracting new ones, making these strategies essential for any comprehensive lifecycle marketing plan.
FineBI for Life Cycle Analysis
FineBI empowers organizations to unlock the full potential of lifecycle marketing. Teams use FineBI to track every customer interaction, from onboarding to advocacy. The platform enables behavioral analytics, which helps companies understand how each customer moves through the lifecycle marketing journey. By analyzing user actions, teams can identify which features drive engagement and which touchpoints lead to customer drop-off.
Consider a scenario where a SaaS provider wants to reduce churn. The team uses FineBI to analyze customer behavior during onboarding. They discover that customers who complete three key actions in the first week have a 40% higher retention rate. The company then adjusts its lifecycle marketing strategy to guide every new customer toward these actions. As a result, customer retention improves, and the business sees measurable growth.
Tip: Use FineBI’s alert system to notify teams when customer engagement drops below a set threshold. This proactive approach supports effective lifecycle marketing and boosts customer loyalty.
| FineBI Feature | Lifecycle Marketing Benefit | Customer Impact |
|---|---|---|
| Behavioral Analytics | Identifies engagement drivers | Higher satisfaction |
| Segmentation | Enables targeted campaigns | Personalized experiences |
| Real-Time Reporting | Tracks campaign effectiveness | Faster response to feedback |
| Unified Dashboards | Centralizes lifecycle marketing data | Consistent customer insights |
Start free trial of FineBI to perform Life Cycle Analysis for business success right now.

Continue Reading about Life Cycle Analysis
What is Pareto Chart and How Does it Work
How DuPont Analysis Helps You Understand Your Business
How to Do Retention Analysis for Business Success
Perform Market Basket Analysis to Upgrade Your Business
Unlocking Business Success with the AARRR Metrics Framework


FAQ

The Author
Lewis
Senior Data Analyst at FanRuan
Related Articles

What is Ecommerce Analytics and Why Does It Matter
Ecommerce analytics helps online stores track data, optimize sales, and enhance customer experience for better growth and profitability.
Lewis
Jan 04, 2026
What is Ad-Hoc Analysis and Why is it Important
Ad-hoc analysis lets you answer unique business questions instantly, offering flexible, real-time insights that drive smarter, faster decisions.
Lewis
Sep 16, 2025

What Is a Data Model and Why Does It Matter
A data model defines how data is structured and connected, making information easier to manage, analyze, and use for smarter business decisions.
Lewis
Aug 04, 2025