A well-structured sales report template serves as a powerful tool for smarter business decisions. It streamlines your sales analysis by saving time with ready-made structures, allowing you to focus on interpreting data rather than compiling it. Modern templates integrate automation and real-time data updates, reducing errors and ensuring accuracy. Visual elements like charts and dashboards transform complex numbers into clear insights. By highlighting key metrics and standardizing data presentation, these templates empower you to make informed decisions that drive success.
Understanding Sales Report Templates for Business Analysis
What is a sales report template?
A sales report template is a pre-designed framework that helps you organize and present sales data effectively. It provides a structured layout to capture key metrics, such as revenue, sales performance, and customer trends. By using a template, you can streamline the process of compiling sales data, ensuring consistency and clarity in your reports.
Creating a sales report template involves several steps. First, you select a reporting tool that allows for easy data import and manipulation. Next, you design a framework that includes sections like a header, executive summary, and sales performance metrics. Incorporating visual elements, such as charts and graphs, makes the data more digestible. Finally, you test the template with real data and refine it based on feedback. This process ensures that your template is both functional and user-friendly.
Purpose of sales report templates in sales analysis
Sales report templates play a crucial role in sales analysis by providing a standardized way to evaluate performance and identify trends. They help you focus on actionable insights rather than spending time formatting data. For example, a well-designed template can highlight sales pipeline insights, showing how deals at various stages impact overall revenue. It can also clarify sales cycles, making it easier to pinpoint bottlenecks and optimize processes.
The purpose of these templates extends beyond internal analysis. They foster transparency and trust among stakeholders by presenting data in a clear and consistent manner. Whether you are tracking monthly sales performance or analyzing customer lifetime value, a sales report template ensures that your findings are accurate and easy to understand.
Here’s a quick overview of how sales report templates support business analysis:
| Aspect | Description |
|---|---|
| Standardization | Provides a consistent view of performance, enabling comparisons across time frames. |
| Clarity and Transparency | Reassures stakeholders of the accuracy and insightfulness of the reports, fostering trust. |
| Sales Pipeline Insights | Highlights the value of the sales pipeline and its impact on revenue. |
| Clarity in Sales Cycles | Outlines key stages of deals, making sales cycles clear and actionable. |
How FineReport simplifies the process of producing sales reports
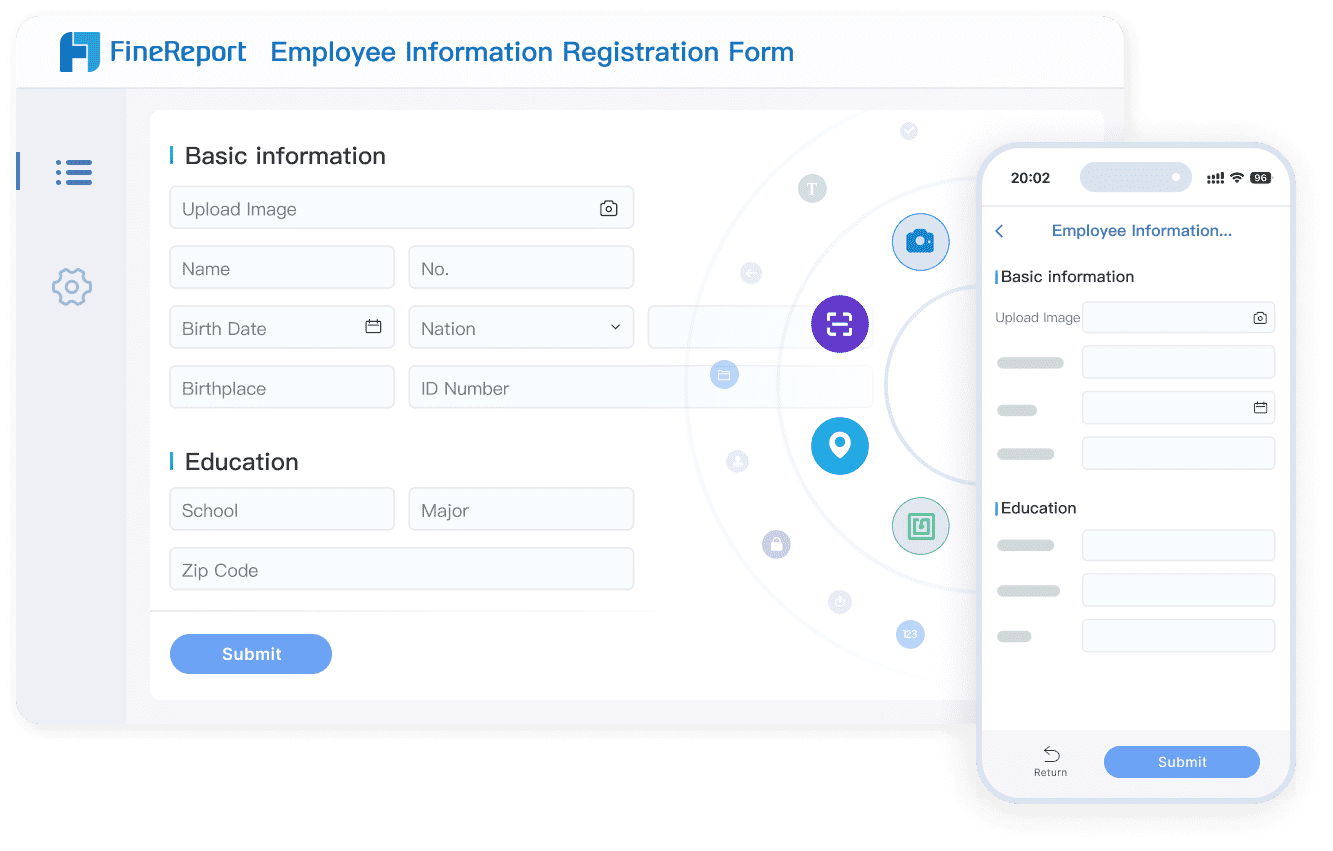
FineReport takes the complexity out of producing sales reports by offering a user-friendly interface and advanced features. Its drag-and-drop functionality allows you to create ready-to-use templates without extensive technical knowledge. You can connect FineReport to multiple data sources, enabling seamless integration of sales data from various systems.

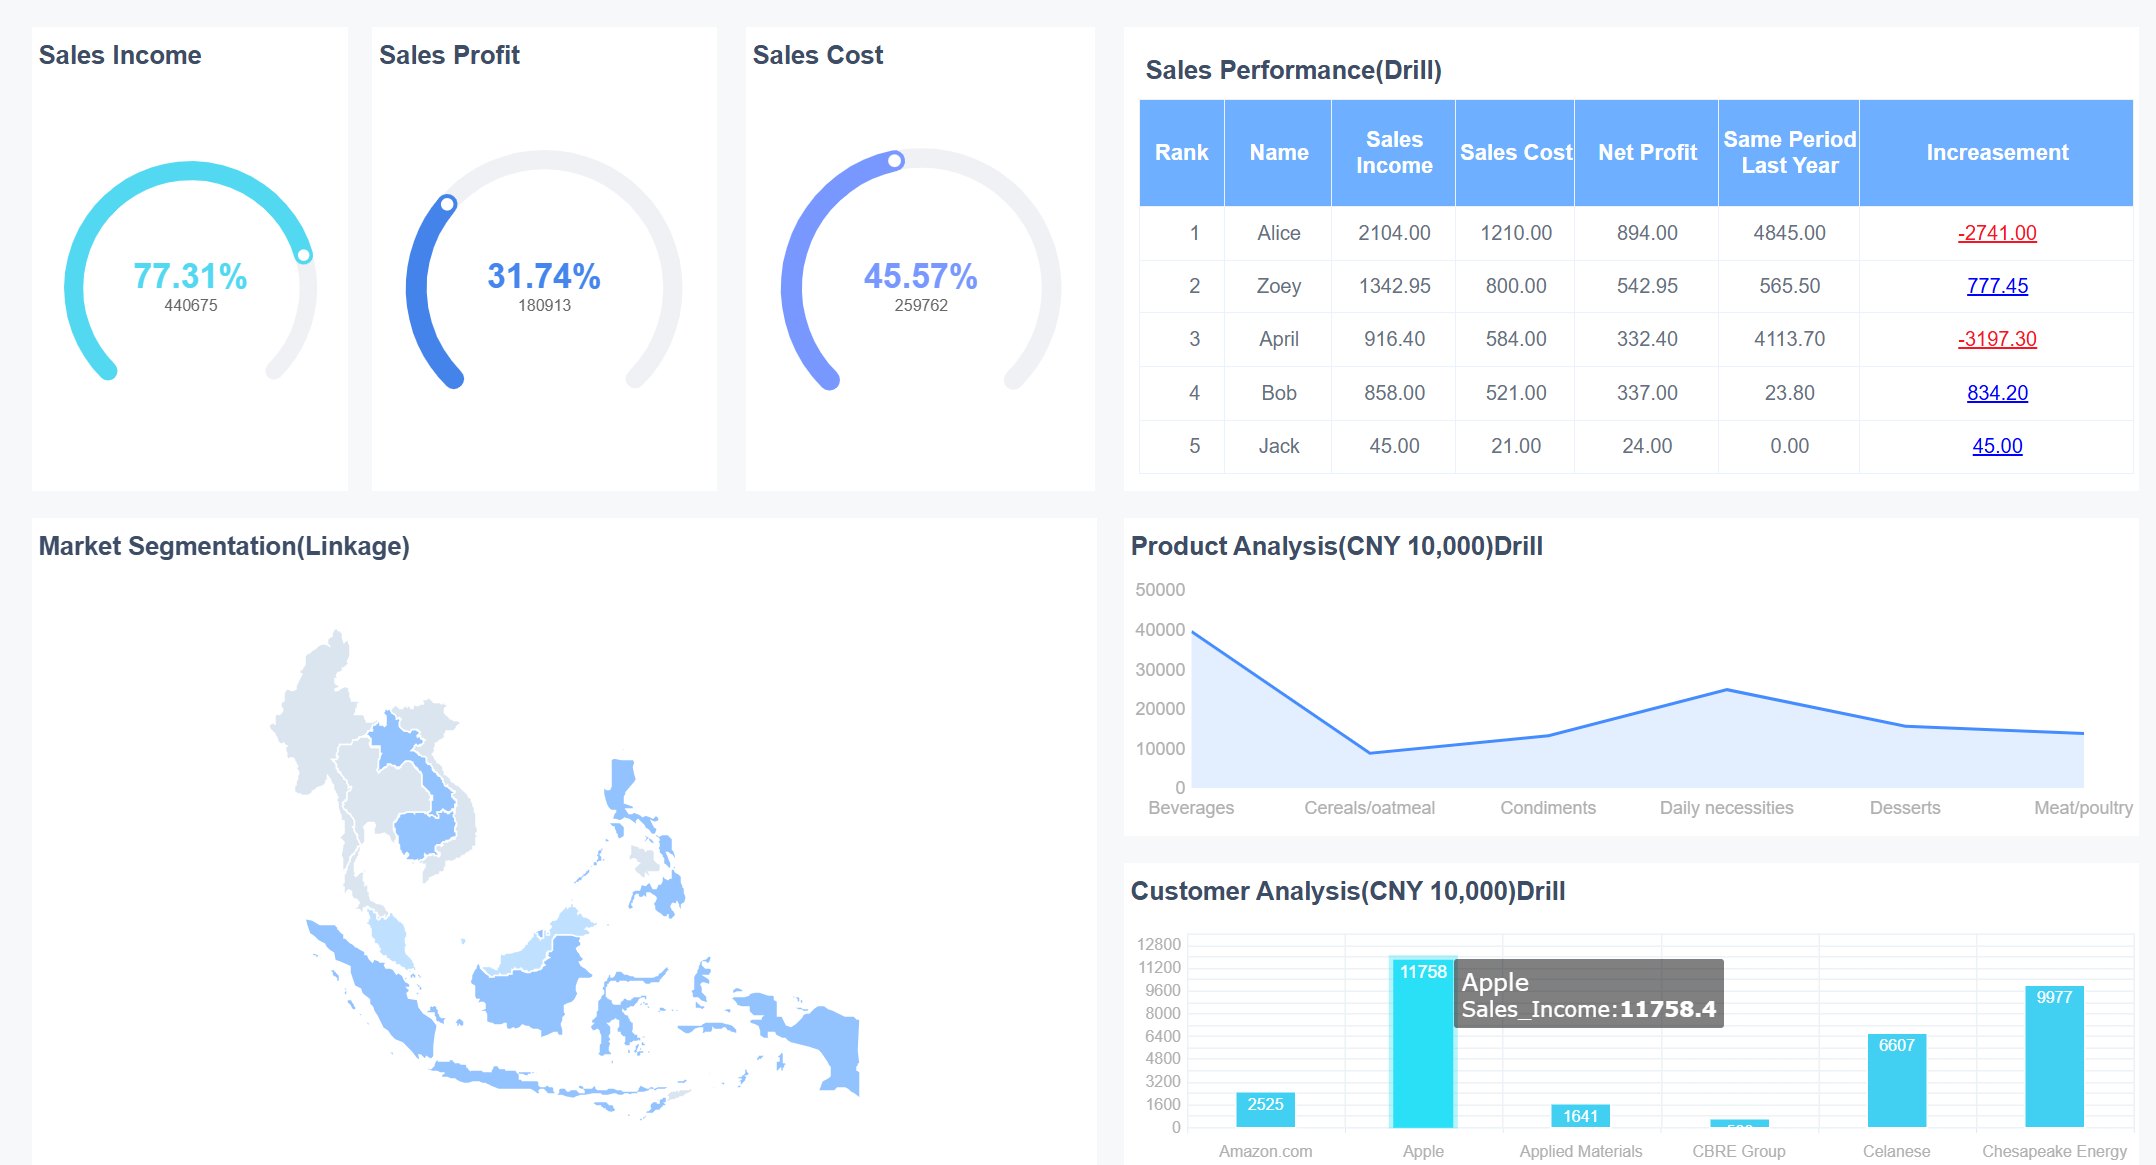
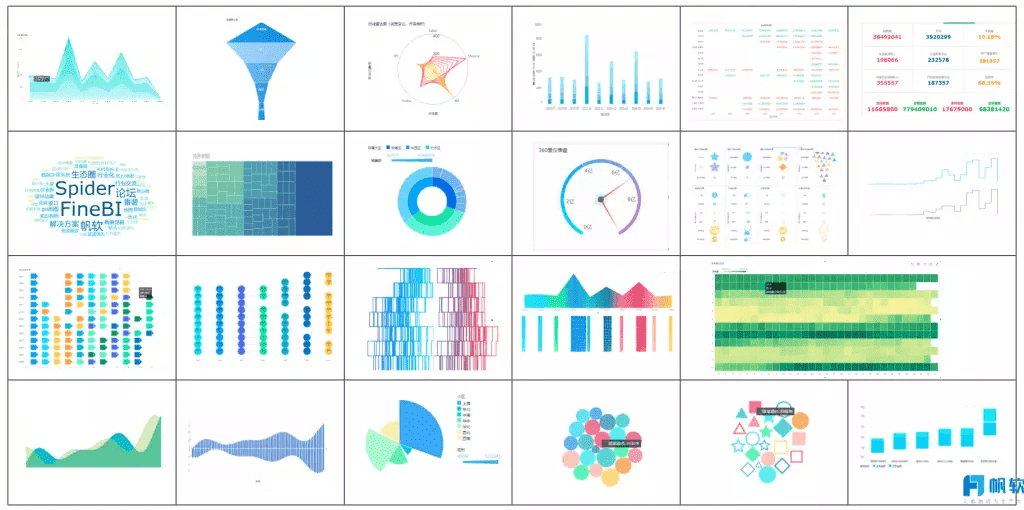
One of FineReport’s standout features is its ability to visualize data intuitively. With over 70 chart styles and interactive dashboards, you can transform raw sales data into actionable insights. For example, FineReport’s cockpit-style dashboards provide a comprehensive view of key operational indicators, such as sales performance and inventory levels. This makes it easier to track progress and identify areas for improvement.
FineReport also excels in automating repetitive tasks. You can schedule reports to be generated and distributed automatically, saving time and reducing errors. Additionally, its KPI system supports comparative analysis, helping you evaluate performance across teams or departments. By aggregating data from all dealers, FineReport ensures that corporate headquarters have a unified view of sales performance.
Here’s a closer look at how FineReport simplifies sales reporting:
| Aspect | Description |
|---|---|
| User-friendly interface | Simplifies the process of producing reports, making it accessible for users. |
| Efficient reporting | Enhances the ability to visualize data intuitively, aiding in comparative analysis. |
| KPI system | Supports comparative incentives, regulatory reports, and meeting reviews. |
| Data aggregation | Regularly compiles data from all dealers for unified analysis at corporate headquarters. |
| Dashboard capabilities | Provides a cockpit-style dashboard for key operational indicators like sales and inventory. |
By leveraging FineReport, you can produce sales reports that are not only accurate but also insightful, empowering your team to make smarter business decisions.
Benefits of Using Sales Report Templates
Enhancing consistency and accuracy in sales analysis
Sales report templates ensure consistency and accuracy in your sales analysis by standardizing how data is collected, organized, and presented. When you use a template, you eliminate the risk of discrepancies caused by manual formatting or inconsistent data entry. This standardization allows you to compare sales metrics across different time periods or teams without confusion. For example, a sales performance report generated from a template ensures that all key metrics, such as revenue and customer trends, are consistently tracked.
Templates also reduce errors by automating calculations and data integration. Tools like FineReport allow you to connect multiple data sources, ensuring that your sales analysis report reflects real-time and accurate information. This level of precision builds trust among stakeholders and helps you make decisions based on reliable insights.
Saving time with automated reporting tools like FineReport
Time is a critical resource in sales reporting. Automated tools like FineReport save you hours by enabling you to produce sales reports with minimal effort. Instead of manually compiling data, you can use ready-to-use templates that streamline the entire process. FineReport’s drag-and-drop interface simplifies report creation, while its scheduling feature automates the generation and distribution of reports.
Imagine needing to prepare a monthly sales forecast. With FineReport, you can set up a template once and schedule it to run automatically. This automation not only saves time but also ensures that your reports are delivered on time, every time. By reducing manual tasks, you can focus more on analyzing sales performance and less on administrative work.
Driving smarter decisions with actionable insights
Sales report templates empower you to make smarter decisions by providing actionable insights. For instance, Opportunity Highlight Templates help you identify promising leads and track performance trends. By documenting interactions and outcomes, these templates reveal patterns that guide your strategy. This structured approach improves sales performance and ensures that your decisions are data-driven.
When you analyze sales data using templates, you gain a clearer understanding of your sales pipeline and customer behavior. This clarity helps you optimize processes, allocate resources effectively, and set realistic sales targets. The benefits of sales report templates extend beyond efficiency—they enable you to uncover insights that drive business growth.
Tip: Use templates with visual elements like dashboards and charts to make insights more accessible and actionable for your team v.
Steps to Create and Customize Sales Report Templates
Identifying business goals and KPIs for sales analysis
To create an effective sales report template, you must first define your goals and identify the key performance indicators (KPIs) that align with those objectives. Start by asking yourself what you aim to achieve with your sales analysis. Are you looking to track revenue growth, improve customer retention, or evaluate team performance? Clear goals provide direction and ensure that your reports focus on actionable insights.
KPIs act as measurable benchmarks that help you assess progress toward your goals. For example, tracking close rates, average ticket prices, and customer feedback can provide a comprehensive view of your sales performance. These metrics not only highlight areas for improvement but also motivate your team by setting clear targets. Additionally, KPIs deliver quantifiable insights that reveal growth opportunities and inefficiencies, enabling you to make informed decisions.

Tip: Use KPIs to create a feedback loop. Regularly review your metrics to identify trends and adjust your strategies for continuous improvement.
Gathering and integrating data with tools like FineDataLink
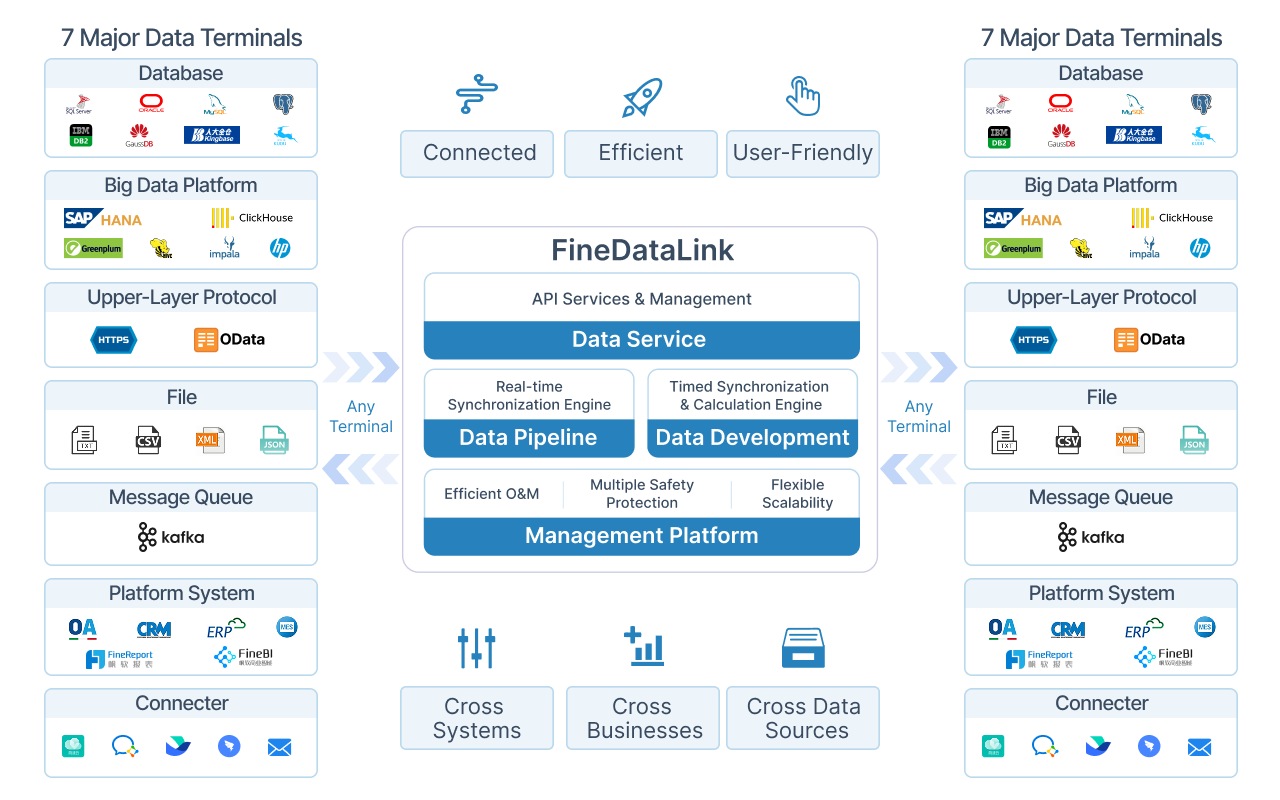
Once you’ve defined your goals and KPIs, the next step is to gather data from various sources. Sales data often resides in multiple systems, such as CRM platforms, spreadsheets, and databases. Integrating this data into a unified platform is essential for accurate sales analysis. Tools like FineDataLink simplify this process by enabling real-time data synchronization and seamless integration across different systems.
FineDataLink supports over 100 common data sources, allowing you to gather data efficiently without manual intervention. Its visual interface makes it easy to map and transform data, ensuring that your sales reports reflect accurate and up-to-date information. For instance, you can use FineDataLink to consolidate sales figures from regional offices, providing a comprehensive view of your business performance.
By automating data integration, you save time and reduce errors, allowing you to focus on analyzing trends and making strategic decisions. This streamlined approach ensures that your sales reporting process is both efficient and reliable.
Designing templates with visuals for better sales analysis
Visual elements play a crucial role in enhancing the effectiveness of your sales report templates. Charts, graphs, and dashboards help you visualize complex data, making it easier to identify trends and patterns. For example, funnel charts can illustrate the stages of your sales pipeline, highlighting areas where deals are stalling. This visual context enables you to address bottlenecks and optimize your processes.
When designing your template, include visuals that align with your KPIs and goals. Interactive dashboards, like those offered by FineReport, allow you to drill down into specific metrics for deeper insights. These features not only make your reports more engaging but also help stakeholders grasp the data quickly.

Note: Visualization simplifies data comprehension, enabling stakeholders to make informed decisions faster. Always choose visuals that provide context and align with your analysis objectives.
Incorporating visuals into your templates transforms raw data into actionable insights. This approach not only improves the clarity of your sales analysis but also empowers your team to make smarter, data-driven decisions.
Testing and refining templates for usability
Testing and refining your sales report templates ensures they meet the needs of your team and stakeholders. Usability testing helps you identify areas that need improvement, making your templates more effective and user-friendly. By focusing on real-world application, you can refine your templates to deliver actionable insights and streamline your sales reporting process.
Why Testing Matters
Testing allows you to evaluate how well your templates perform under actual conditions. It highlights usability issues, such as unclear layouts or missing data points, that could hinder your sales analysis. Engaging users directly helps you capture their feedback and pinpoint pain points. Real-time feedback reveals areas for improvement and highlights what resonates with your audience. This iterative process ensures your templates align with your business goals and provide value to your team.
Tip: Involve team members from different departments during testing. Their diverse perspectives can uncover issues you might overlook.
Steps to Test and Refine Your Templates
- Conduct User Testing
Share your templates with team members who will use them regularly. Ask them to perform typical tasks, such as analyzing sales trends or generating reports. Observe how they interact with the template and note any challenges they face. - Gather Feedback
Collect feedback through surveys or informal discussions. Focus on questions like:- Is the template easy to navigate?
- Are the visuals clear and helpful?
- Does the template provide all necessary data for decision-making?
- Analyze Results
Review the feedback to identify recurring issues. For example, users might find certain charts confusing or struggle to locate specific metrics. Prioritize these issues for refinement. - Refine the Template
Make adjustments based on the feedback. Simplify complex visuals, add missing data points, or reorganize sections for better clarity. Test the updated template to ensure the changes address the identified problems. - Iterate Regularly
Usability testing isn’t a one-time process. Regularly revisit your templates to ensure they adapt to evolving sales needs and business dynamics. Continuous improvement keeps your templates relevant and effective.
Tools to Enhance Usability Testing
Using tools like FineReport can simplify the testing and refinement process. FineReport’s interactive dashboards allow users to explore data intuitively, making it easier to identify usability issues. Its drag-and-drop interface lets you quickly implement changes based on feedback. Additionally, FineReport supports real-time data integration, ensuring your templates reflect accurate and up-to-date information during testing.
Benefits of Refining Templates
Refining your templates improves their usability and effectiveness. Clear layouts and intuitive visuals make it easier for your team to analyze sales data and extract actionable insights. Enhanced templates save time by reducing the need for manual adjustments, allowing you to focus on strategic decision-making. Ultimately, well-tested templates empower your team to drive better sales performance and achieve business goals.
Note: Regular testing and refinement foster a culture of continuous improvement, ensuring your sales reporting process stays ahead of challenges.
Types of Sales Report Templates and Their Applications
Sales Leaderboard
A Sales Leaderboard template ranks your sales team based on performance metrics, fostering healthy competition and accountability. This template provides real-time tracking of individual and team achievements, helping you identify top performers and areas needing improvement. By displaying metrics like total sales volume, revenue generated, and new customers acquired, the leaderboard motivates your team to strive for better results.
For example, a leaderboard can show how many units each salesperson has sold or the revenue they’ve generated. This transparency encourages accountability and helps you make quick, data-driven decisions. Additionally, tracking metrics like the pipeline generated ensures you stay informed about future revenue opportunities. The competitive nature of this template boosts team morale and aligns everyone toward achieving business goals.
| Performance Indicator | Description |
|---|---|
| Real-Time Performance Tracking | Provides an up-to-the-second overview of team performance, enhancing visibility and alignment. |
| Motivating Sales Teams through Competition | Ranks performance, encouraging reps to improve their standings and strive for rewards. |
| Creating Transparency and Accountability | Displays performance openly, fostering accountability among team members. |
| Quick Decision-Making | Enables immediate data-driven decisions without waiting for reports. |
Overall Sales Performance
The Overall Sales Performance template offers a comprehensive view of your sales activities over a specific period. This template consolidates data from multiple sources, allowing you to assess team performance, revenue trends, and customer acquisition rates. It’s ideal for evaluating the effectiveness of your sales strategies and identifying areas for improvement.
For instance, a Monthly Sales Report Dashboard visualizes team metrics and sales channels. You can use this to compare estimated versus actual sales, track progress, and adjust strategies accordingly. This template simplifies sales reporting by presenting data in an easy-to-understand format, ensuring you make informed decisions that drive growth.
| Template Name | Description | Business Application |
|---|---|---|
| Monthly Sales Report Dashboard | Visualizes team performance metrics and sales channels. | Helps in assessing overall sales strategies and channel effectiveness. |
| Annual Sales Performance Report | Compares estimated vs actual sales quarterly. | Essential for long-term sales analysis and forecasting. |
Here is an interactive demo of overall sales performance created by FineReport, click to experience it.
Multi-dimensional Sales Analysis
A Multi-dimensional Sales Analysis template allows you to explore sales data from various perspectives, such as product categories, regions, or customer segments. This template helps you uncover trends and patterns that might not be visible in standard reports. By analyzing data across multiple dimensions, you can identify high-performing products, profitable regions, or customer preferences.
For example, a Weekly Sales Activity Report tracks activities like calls, visits, and revenue. This granular view helps individual sales reps monitor their performance against goals. Similarly, a Basic Daily Sales Report provides insights into daily sales trends, making it easier to manage inventory and adjust tactics. These templates empower you to make data-driven decisions that optimize your sales processes.
| Template Name | Description | Business Application |
|---|---|---|
| Weekly Sales Activity Report | Tracks weekly sales activities including calls, visits, leads, and revenue. | Ideal for individual sales reps to monitor performance against goals. |
| Basic Daily Sales Report | Simple daily tracking of sales, including products and prices. | Useful for daily sales management and inventory tracking. |
Here is an interactive demo of multi-dimensional sales analysis created by FineReport, click to experience it.
Tip: Use multi-dimensional templates to analyze sales data from different angles. This approach reveals actionable insights that drive smarter decisions.
Tips for Maximizing the Effectiveness of Sales Report Templates
Automating sales report generation with FineReport
Automating your sales report generation can save time and reduce errors. FineReport simplifies this process with its drag-and-drop interface and scheduling features. You can set up templates once and schedule them to generate reports automatically. This ensures timely delivery of accurate data without manual intervention. For instance, you can automate monthly sales forecasts or weekly performance summaries, allowing your team to focus on strategy rather than repetitive tasks.
Experts highlight that automation enhances efficiency by eliminating manual calculations. FineReport’s data visualization capabilities transform raw numbers into professional reports, enabling you to focus on interpreting trends and making strategic decisions. For example, its structured framework provides a clear layout to assess sales strategies and track key metrics across products and quarters. By automating these processes, you can ensure consistency and accuracy in your sales analysis.
Regularly updating templates to align with business dynamics
Sales environments evolve rapidly, and your templates must keep pace. Regular updates ensure your templates reflect current business goals and market conditions. For example, if your sales strategy shifts to focus on a new product line, updating your templates to include relevant KPIs will help track its performance effectively.
Case studies show that regular updates can significantly improve sales performance. For instance, Renault achieved a 13% increase in conversions by improving their processes. Similarly, Swappie saw a 42% revenue increase from mobile visitors after optimizing their systems. These examples demonstrate how adapting to changing dynamics can drive better results. Regularly reviewing and refining your templates ensures they remain relevant and effective.
Training teams to interpret and utilize sales report templates effectively
Even the best templates are only as good as the people using them. Training your team to interpret and utilize sales report templates ensures they can extract actionable insights. Start by explaining the purpose of each template and the metrics it tracks. Provide examples of how these metrics relate to your sales goals.
Performance tracking plays a vital role in this process. It enables constructive feedback and coaching, helping team members understand their strengths and areas for improvement. Clear goals motivate your team and make it easier to measure effectiveness. Regular training sessions foster a culture of continuous learning, ensuring everyone stays aligned with your business objectives.
Tip: Use interactive tools like FineReport to make training sessions more engaging. Its intuitive dashboards allow team members to explore data and gain hands-on experience.

Leveraging advanced features of FineReport for enhanced sales analysis
FineReport offers advanced features that elevate your sales analysis to a new level. These tools help you uncover deeper insights, streamline processes, and make data-driven decisions with confidence.
1. Real-Time Data Integration
FineReport connects seamlessly to multiple data sources, ensuring your sales data stays up-to-date. This real-time integration eliminates delays and provides accurate insights whenever you need them. For example, you can monitor regional sales performance instantly, helping you respond quickly to market changes.
2. Interactive Dashboards
FineReport’s interactive dashboards transform raw data into actionable insights. You can drill down into specific metrics, such as product sales or customer segments, to identify trends and opportunities. These dashboards make complex data easy to understand, empowering you to make smarter decisions.

3. Automated Reporting
Automation is a game-changer for sales reporting. FineReport allows you to schedule reports, ensuring timely delivery without manual effort. Whether you need daily sales updates or monthly performance summaries, automation saves time and reduces errors.
4. Advanced Visualizations
FineReport supports over 70 chart styles, enabling you to present sales data in visually compelling ways. Use heatmaps to analyze regional sales or funnel charts to track your pipeline. These visuals make it easier to communicate insights to your team and stakeholders.

Tip: Leverage FineReport’s mobile capabilities to access sales dashboards on the go. This ensures you stay informed, even when you’re away from your desk.
By utilizing these advanced features, you can optimize your sales processes and drive better business outcomes. FineReport not only simplifies reporting but also empowers you to focus on strategies that boost performance.
Sales report templates play a vital role in driving smarter business decisions. They provide structured insights that help you predict future sales, track deals won and lost, and understand revenue generation per deal. These templates highlight effective strategies and growth opportunities, enabling you to optimize sales processes and allocate resources efficiently. Tools like FineReport simplify this process by automating report generation and integrating real-time data, ensuring accuracy and efficiency. By leveraging these templates, you can transform your sales report summary into actionable insights that fuel business growth.
| Evidence Description | Importance |
|---|---|
| Predict future sales by rep, team, location, or lead type. | Helps in setting realistic sales goals and expectations. |
| Tracking deals won and lost reveals business performance and sales strategy efficacy. | Identifies successful sales efforts and areas needing improvement. |
| Understanding revenue generation per deal aids in planning sales capacity. | Assists in resource allocation and meeting sales targets effectively. |
| Sales reports highlight effective strategies and growth opportunities. | Essential for business growth and optimizing sales processes. |
| CRM tools facilitate immediate report generation by tracking sales data in real-time. | Increases efficiency and accuracy in sales reporting, leading to better decision-making. |
Explore tools like FineReport to create and optimize your sales report templates. They empower you to make informed business decisions and achieve your goals with confidence.
Click the banner below to try FineReport for free and empower your enterprise to transform data into productivity!
Continue Reading About Sales Report
Sales Report Sample: Templates and Guidelines
Daily Sales Report: Key Elements, Samples & How to Create
The Ultimate Guide to Creating a Sales Dashboard: Tips and Tricks


FAQ

The Author
Lewis
Senior Data Analyst at FanRuan
Related Articles

How to Calculate Free Cash Flow: Formula, Example, and Uses from Financial Statements
Free cash flow tells you how much cash a business generates after funding the capital spending required to keep the business running and growing. For CFOs, FP&A teams, investors, and operators, this is one of the fastest
Yida Yin
May 22, 2026

What Are Financial Reporting Services? A Practical Guide to Statements, Close Processes, and Decision Support
$1 services help organizations turn raw accounting activity into accurate statements, management insight, and decision ready reporting. For finance leaders, controllers, operations directors, and business owners, the val
Yida Yin
Jun 18, 2026

Financial Reporting Automation for Month-End Close: 9 Ways to Cut Close Cycles Without Losing Control
Month end close is where finance teams feel process debt most painfully. Data arrives late, reconciliations drag, journal approvals stall, and reporting packs get rebuilt manually under deadline pressure. $1 automation a
Yida Yin
Jun 16, 2026