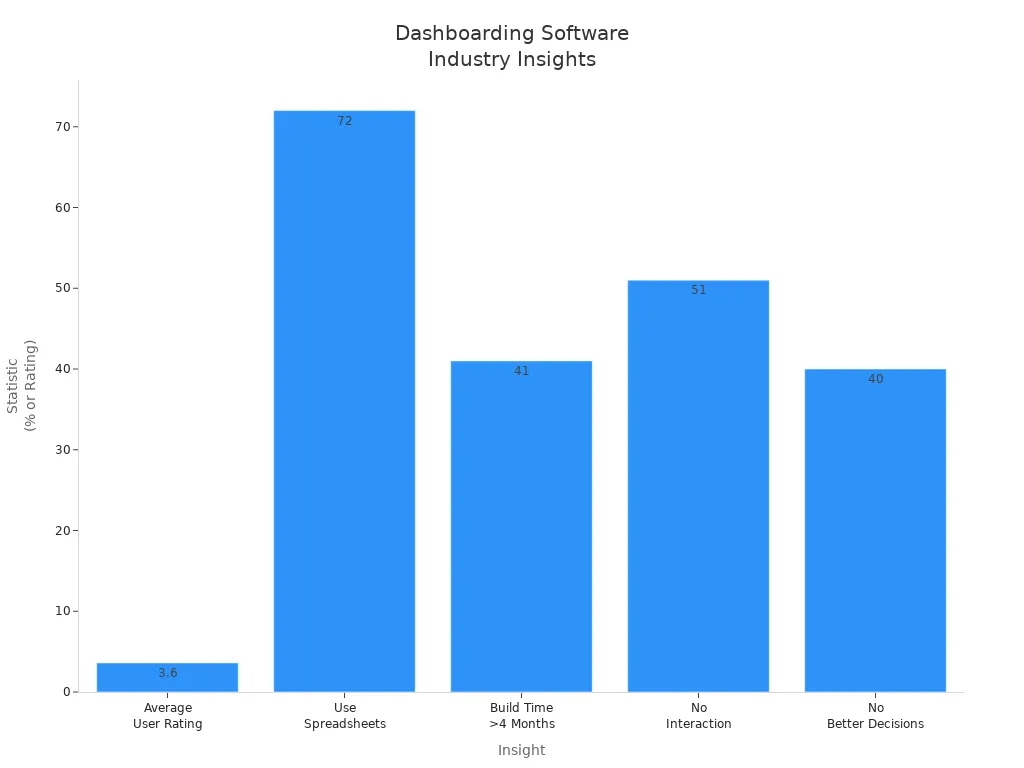
Introduction
Dashboard software is a data visualization tool that consolidates and displays key metrics, reports, and analytics from multiple sources in a single, easy-to-read interface.Looking at the data landscape in 2026, you have more choices than ever for dashboarding software. Here are the most widely used platforms:
- FineReport
- Tableau Software
- Microsoft Power BI
- Google Looker Studio
- Qlik Technologies
- Domo
- Zoho Analytics
You can use dashboards to turn business reporting into actionable insights. AI-powered dashboards now go far beyond static charts. They spot trends, recommend actions, and help you make data-driven decisions faster. No matter your industry or company size, dashboards let you track kpi dashboards, boost business intelligence, and support data-driven analysis. The right dashboards help you see what matters most and focus on what drives results.
Best Dashboarding Software Platforms for 2026
When you look for the best dashboard software for your business, you want something that fits your needs and helps you make data-driven decisions. The dashboard software for 2026 offers more options than ever, each with unique strengths. Let’s break down the top dashboard platforms you should consider.
1.FineReport
FineReport by FanRuan stands out as a flexible and powerful dashboarding software. You can use it to create dashboards that bring together data from many sources. The drag-and-drop dashboard creation makes it easy for you to build custom dashboards, even if you don’t have a technical background. FineReport supports funnel analysis, communication management, and collaboration tools. These features help you streamline business reporting and improve process efficiency.
Website: https://www.fanruan.com/en/finereport
Here’s a quick look at what makes FineReport a top choice:
| Core Strengths | Ideal Use Cases |
|---|---|
| Robust data import and custom reporting | Collaborative tools |
| Effective funnel analysis | Sales document management |
| Communication management | Business development |
| Focus on operational efficiency | Process efficiency |
You’ll find FineReport especially useful if you work in a large enterprise or government setting. It helps you manage complex data, automate reporting, and boost operational effectiveness. If you need dashboards for kpi dashboards, sales, or communication, FineReport gives you the tools to get actionable insights fast.
2.Tableau
Tableau is one of the most popular dashboard platforms for 2026. You can use Tableau to turn raw data into interactive dashboards with advanced visualizations. The platform offers features like infographics, cluster maps, and deep analytics tools. These go beyond what simpler dashboard tools provide.

Website: https://www.tableau.com/
Tableau shines in industries like consumer goods, retail, nonprofit, and technology. You might use it to optimize stock levels, measure organizational impact, or target SaaS sales. If you want dashboards that help you explore data visually and uncover trends, Tableau is a strong pick.
Tip: Tableau’s customization options let you build dashboards that match your brand and reporting needs.
3.Microsoft Power BI
Microsoft Power BI is a favorite for businesses that already use Microsoft products. You can connect Power BI with Azure, Office 365, SharePoint, and Teams. This integration makes it easy to share dashboards and collaborate with your team. Power BI also connects with Power Automate and Power Apps, so you can automate tasks and create interactive dashboards.
You’ll appreciate Power BI’s user-friendly interface and strong data modeling. It’s cost-effective and works well for companies of all sizes. If you want dashboard software that fits into your existing Microsoft ecosystem, Power BI is a smart choice for dashboard software for 2025.

Website: https://www.microsoft.com/en-us/power-platform/products/power-bi
4.Google Looker Studio
Google Looker Studio (formerly Data Studio) is a cloud-based dashboard software that focuses on real-time analytics. You can connect it directly to BigQuery and other Google services. This gives you access to fresh data for immediate analysis. Looker Studio lets you build fully customizable dashboards and reports. You can stream data in real time and make decisions on the fly.

Website: https://lookerstudio.google.com/navigation/reporting
| Feature | Description |
|---|---|
| Integration with BigQuery | Direct access to fresh, detailed data for real-time insights. |
| Customizable Reports | Create fully tailored dashboards and reports. |
| Data Streaming | Real-time updates for immediate analysis and decision-making. |
| Elimination of Export Limits | No daily export restrictions, so you can access large data volumes. |
| Real-time Decision Making | Adjust strategies based on current user behavior. |
If you need dashboards that update instantly and support fast business reporting, Looker Studio is a great fit.
5.Qlik Sense
Qlik Sense is a flexible dashboard platform known for its strong data integration and connectivity. You can connect to a wide range of data sources and bring everything together in one place. Qlik Sense supports real-time data extraction, which is perfect if you need up-to-date dashboards for your business.

Website: https://www.qlik.com/us/products/qlik-sense
| Advantage | Description |
|---|---|
| Extensive Connectivity Options | Connects to many data sources for seamless integration. |
| Data Extraction and Loading | Transfers large amounts of data for analysis and visualization. |
| Real-Time Data Integration | Keeps dashboards updated with the latest information. |
Qlik Sense is popular in retail, healthcare, manufacturing, and financial services. If you want dashboard software that handles complex data and supports real-time analysis, Qlik Sense is a top contender among dashboard tools for 2026.
6.Domo
Domo is a cloud-based dashboard software that makes data accessible anywhere. You can use Domo’s mobile dashboards to monitor your business on the go. The platform offers a clean visualization layer and lets you build dashboards without technical skills. Domo’s integration tools help you connect to over 1,000 data sources, making it easy to centralize your data.
Domo’s infrastructure supports unlimited users and data, so it grows with your business. You can transform and analyze massive datasets quickly. If you want dashboards that are mobile-friendly and scalable, Domo is a strong choice for dashboard software for 2026.

Website: https://www.domo.com/
7.Zoho Analytics
Zoho Analytics is a user-friendly dashboard platform that works well for small and medium businesses. You can create dashboards with drag-and-drop tools and connect to many data sources. Zoho Analytics offers automated insights and customizable reports. It’s a good option if you want affordable dashboard software that covers your basic reporting needs.
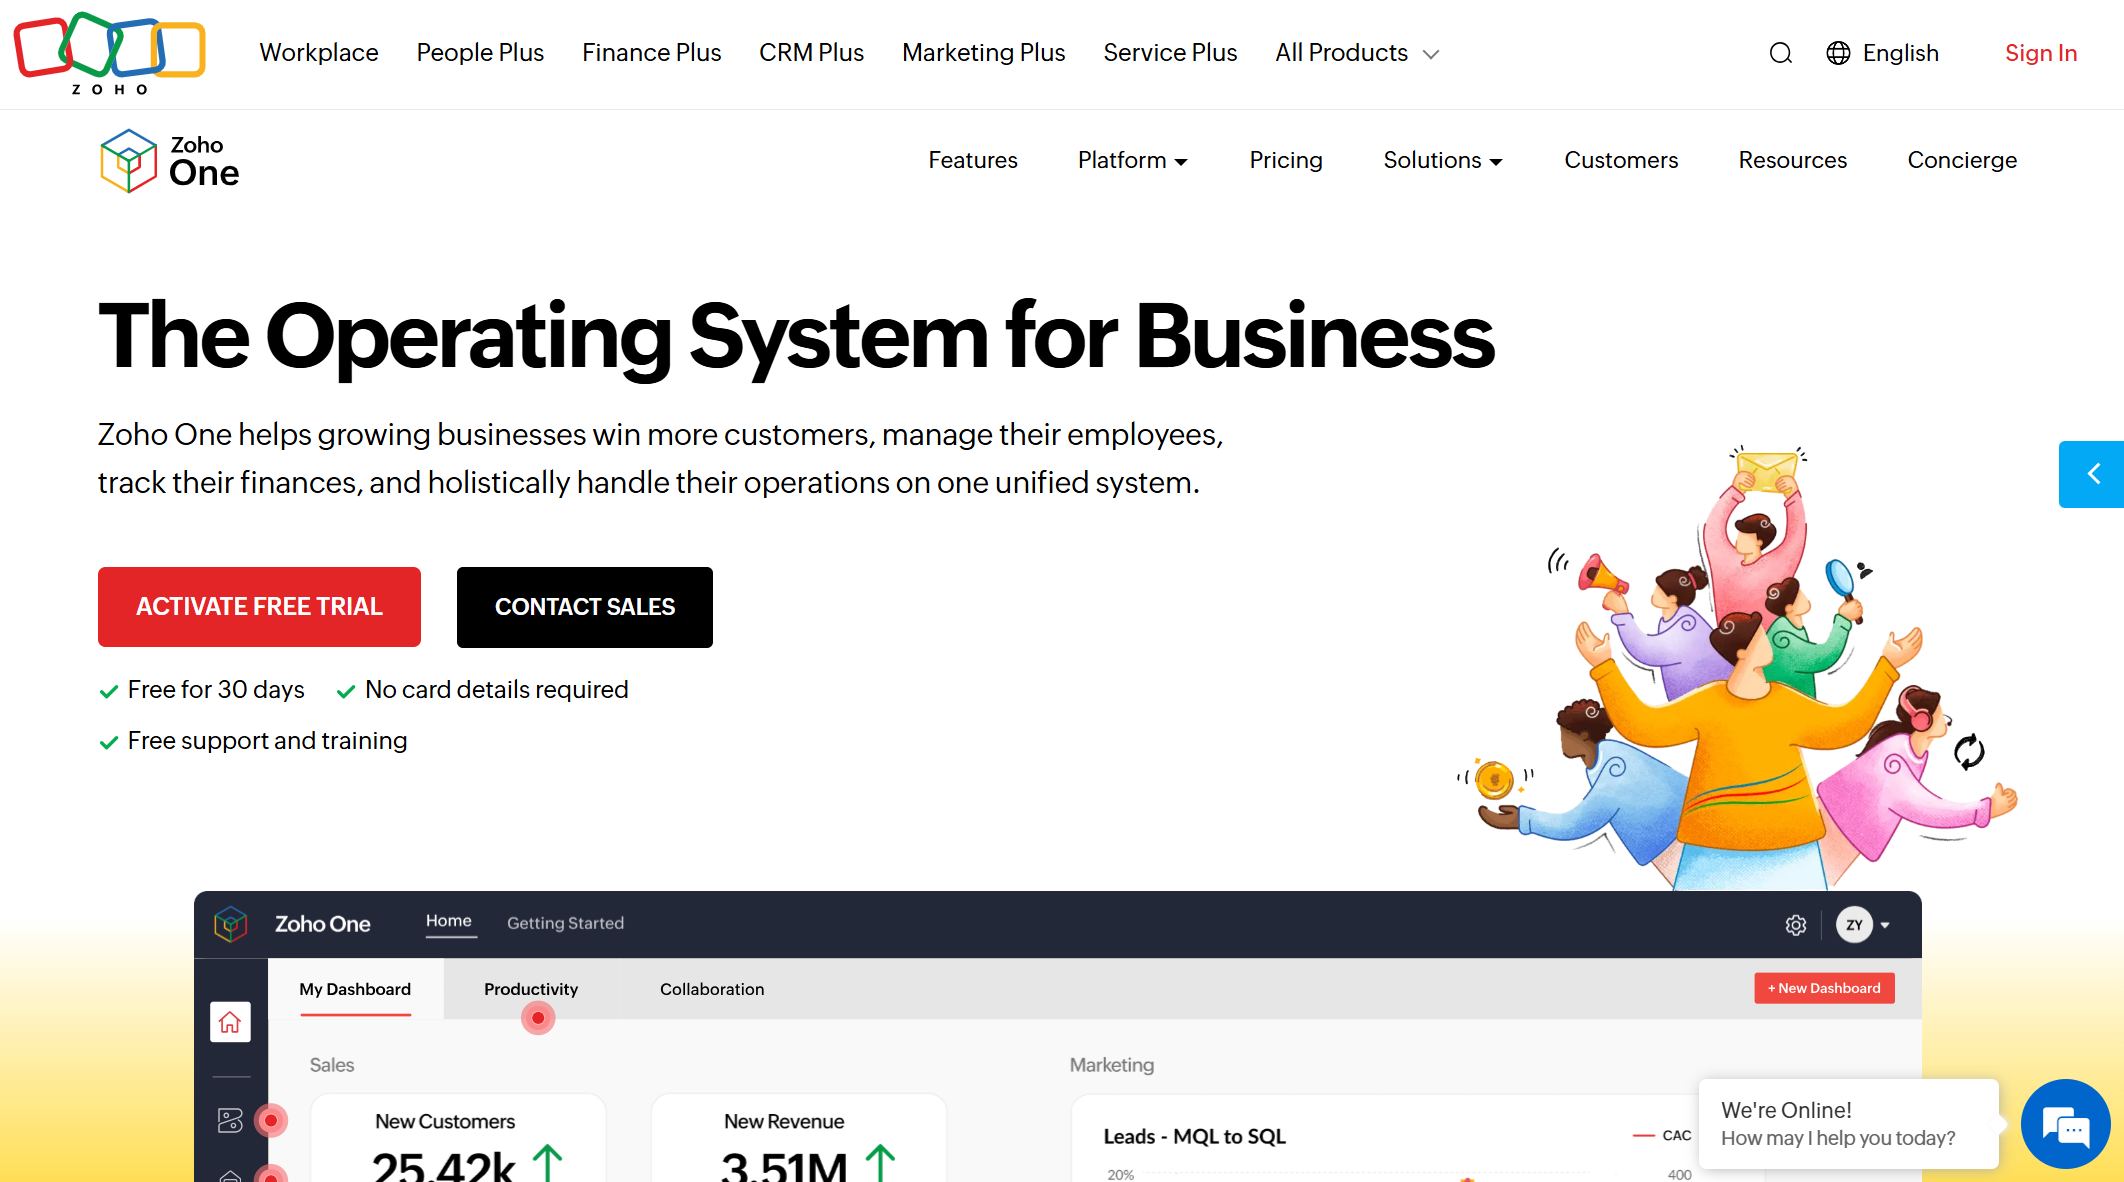
Website: https://www.zoho.com/analytics/
Other Notable Dashboard Tools for 2026
Besides the major players, you’ll find other dashboard tools for 2026 that offer unique strengths:
- Databox: Plug-and-play dashboards, automated alerts, strong mobile app, and white-labeling for agencies.
- Klipfolio: Great for marketing dashboards, offers PowerMetrics for tracking, and highly customizable layouts.
- Grafana Cloud: Popular for monitoring and real-time data visualization, especially in IT and DevOps.
- Amazon QuickSight: Scalable cloud dashboarding software with strong integration for AWS users.
Note: Each dashboard platform has its own strengths. You should match your choice to your business goals, data sources, and the type of dashboards you want to build.
With so many dashboard platforms available, you can find the right dashboard software for 2026 to fit your needs. Whether you want advanced analytics, real-time dashboards, or simple business reporting, these platforms help you turn data into actionable insights and support your data-driven journey.
Key Features of Dashboarding Software
When you explore dashboarding software, you want dashboards that do more than just show numbers. The best dashboard tools for 2026 offer features that help you turn business reporting into real-time data insights. Let’s look at what sets top dashboard software apart.
Data Integration and Connectivity
You need dashboards that connect to all your data sources. Leading dashboard tools make it easy to pull information from databases, spreadsheets, cloud apps, and more. With seamless integration, you get real-time updates and improved data accuracy. FineReport stands out here. You can use its multi-source integration to combine data from different systems. This means your dashboards always show the latest information, so you never miss a beat.

Tip: FineReport’s data connector supports over 500 data sources, making dashboard creation simple for any business.
Visualization and Customization
Great dashboards use powerful data visualization capabilities. You want visualizations that help you spot trends and make decisions fast. Interactive dashboards let you drill down into details and customize views for your team. FineReport gives you 3D dashboards, animated visualizations, and a drag-and-drop interface. You can build user-friendly dashboards that match your brand and highlight your kpi dashboards. Customizable dashboards help you focus on what matters most.

| Feature | Description |
|---|---|
| AI-powered capabilities | Helps surface patterns, automate insights, and support predictive analytics. |
| Real-time data visualizations | Connects directly to data sources, ensuring up-to-date information and accuracy. |
| Intuitive interfaces | Enhances user experience by making navigation and interaction straightforward. |
| Extensive customization options | Allows users to tailor dashboards to their specific needs and preferences. |
| Seamless integration | Facilitates connection with various data sources for comprehensive analysis. |
| Enhanced collaboration features | Promotes teamwork by allowing multiple users to access and interact with dashboards simultaneously. |
| Improved data accuracy | Reduces manual errors and ensures reliable information through data validation and cleansing. |
Real-Time Analytics and Automation
You want dashboards that deliver real-time access to your data. Real-time dashboards update instantly, so you always see the latest numbers. Automation features let you schedule reports and alerts, saving you time. FineReport’s dashboard tools give you real-time dashboards and automated business reporting. You can set up dashboards to refresh with real-time updates, making analysis quick and easy.

Mobile Dashboards and Accessibility
You need dashboards that work wherever you go. Mobile dashboards let you check your business from your phone or tablet. FineReport’s mobile dashboard features help you stay connected, whether you’re in the office or on the move. You get interactive dashboards with real-time access, so you can make decisions anytime. User-friendly dashboards and interactive dashboards keep your team informed and engaged.

Note: The best data dashboard software combines real-time data, interactive dashboards, and strong data visualization capabilities. You get dashboards that support analysis, business reporting, and decision-making.

Pros, Cons, and Use Cases of Dashboard Tools for 2026
Strengths and Limitations
You want dashboards that make your work easier, not harder. Each dashboarding software comes with its own set of strengths and limitations. Here’s a quick look at how the top dashboard tools for 2026 stack up:
| Software | Strengths | Limitations |
|---|---|---|
| FineReport | Flexible dashboards, pixel-perfect reporting, mobile access | May require training for advanced features |
| Tableau | Drag-and-drop interface, powerful analytics | Can be expensive for small businesses |
| Microsoft Power BI | Cost-effective, real-time analytics | Limited customization options |
| Google Looker | Advanced analytics, flexible dashboards | Requires technical expertise for setup |
| Qlik Sense | Strong ETL, interactive dashboards | Steeper learning curve |
| Domo | Real-time dashboards, easy sharing | Can be overwhelming for new users |
| Sisense | Embedded analytics, diverse data connections | Complexity in setup and integration |
You’ll notice that some dashboard tools focus on easy dashboard creation, while others shine in deep analysis or real-time data. Think about what matters most for your team.
Industry Use Cases with FineReport
Dashboards help you solve real problems in your industry. FineReport stands out in manufacturing, finance, and retail. In manufacturing, you can use dashboards to monitor equipment efficiency and spot bottlenecks. For example, companies use FineReport to track OEE (Overall Equipment Effectiveness) and reduce downtime. In finance, dashboards simplify business reporting and make complex numbers easy to understand. You can automate financial statements and get real-time insights for better decisions. Retailers use dashboards to track sales trends, manage inventory, and improve customer service. FineReport’s mobile access and 3D dashboards let you check kpi dashboards anywhere, so you never miss a beat.
Tip: Companies like BOE and Bifido Foods use FineReport to connect data from different sources, boost operational efficiency, and support smarter decision-making.
Choosing the Right Dashboard Tool
Picking the right dashboard software can feel overwhelming. Start by thinking about your team’s needs. Ask yourself:
- Is the dashboard easy for everyone to use?
- Will it grow with your business?
- Can it connect to all your data sources?
- Does it track the KPIs that matter most to you?
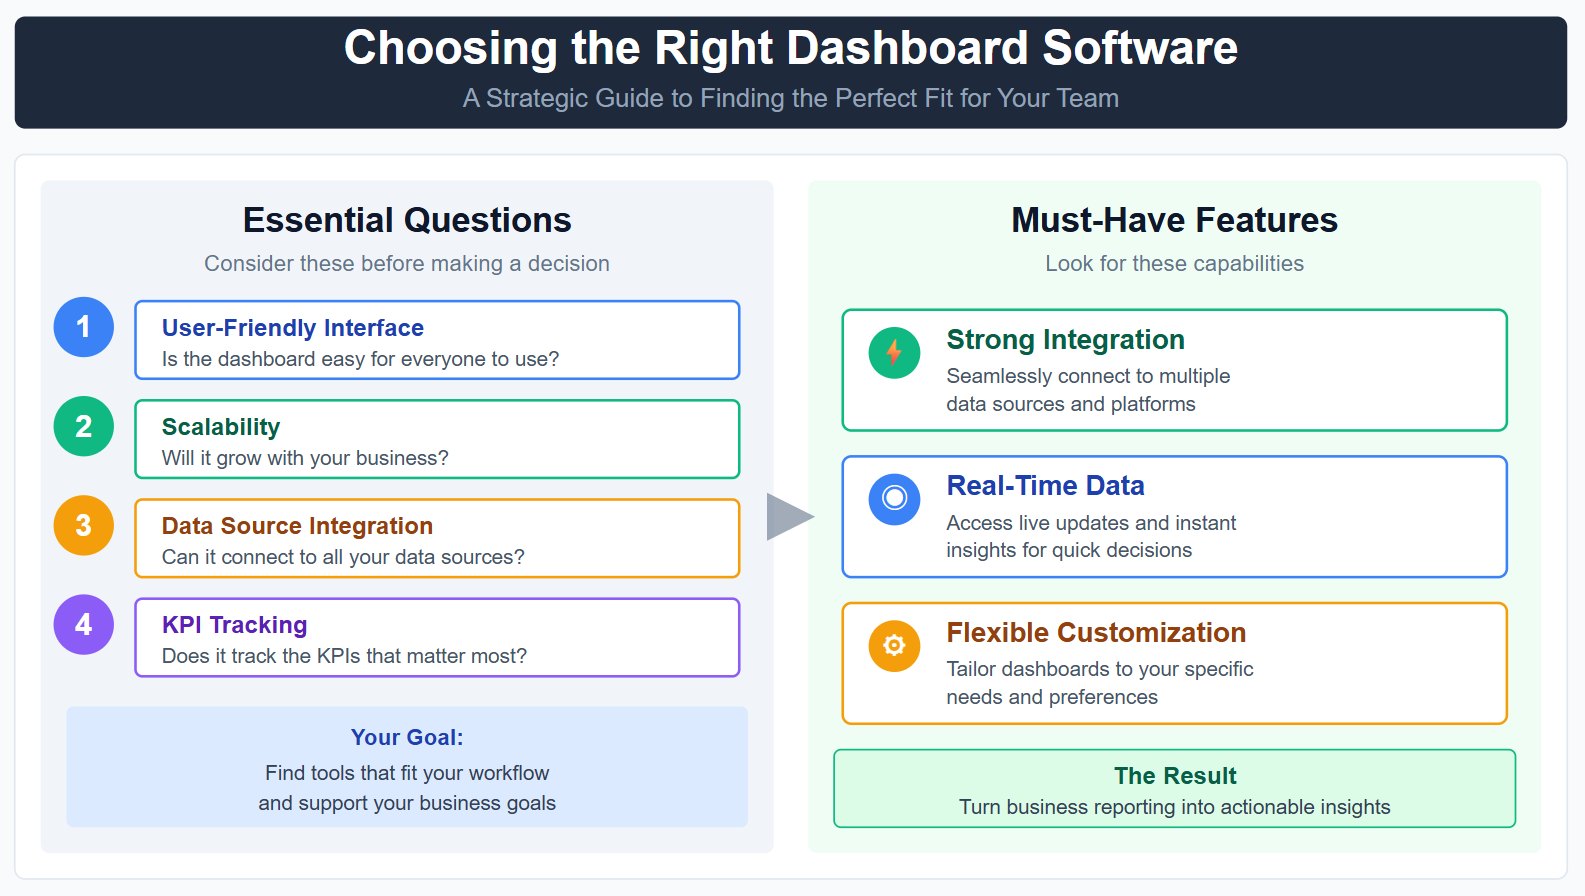
You want dashboard tools that fit your workflow and support your goals. Look for dashboards that offer strong integration, real-time data, and flexible customization. The best data dashboard software helps you turn business reporting into action, whether you’re building dashboards for analysis or tracking kpi dashboards across your company.
Dashboard Software Comparison and Selection Guide
Feature and Pricing Comparison
Choosing dashboarding software can feel overwhelming, but a side-by-side look makes it easier. Here’s a quick table to help you compare the top dashboard tools for 2026:
| Software | Key Features | Pricing Model |
|---|---|---|
| FineReport | Drag-and-drop, AI-powered analytics, SDK | Transparent, usage-independent |
| Tableau | Visualization library, robust data blending | Complex licensing and usage costs |
| Microsoft Power BI | Drag-and-drop builder, Microsoft integration | Tiered pricing based on users |
| Looker | LookML modeling, real-time data exploration | High initial costs, significant investment |
| Sisense | In-Chip™ tech, AI insights | Less transparent pricing |
| ThoughtSpot | Natural language search, AI insights | High initial costs, usage-based pricing |
| Domo | Data connectors, real-time data processing | Cost increases with data volume |
| Amazon QuickSight | Easy-to-use, AWS integration | Cost-effective within AWS ecosystem |
Tip: Always check for hidden costs, like extra fees for more users or advanced features.
Scalability and Security
You want dashboards that grow with your business and keep your data safe. Look for these features:
- User access control and row-level security for sensitive information.
- Security certifications like SOC 2 and HIPAA.
- Performance that supports hundreds or even thousands of users at once.
- Cloud integration with AWS, Azure, or Google Cloud for auto-scaling.
- Advanced sharing and collaboration with custom roles.
- High-end visualization and content management tools.
These features make sure your dashboards stay fast, secure, and flexible as your needs change.
How to Choose Dashboard Software
Picking the right dashboards means thinking about what matters most for your team. Here’s a simple guide:
- Integrations: Make sure your dashboards connect to all your data sources.
- Customization: Choose dashboard creation tools that let you tailor visuals to your needs.
- User Experience: Go for a user-friendly interface so everyone can use it.
- Performance: Check if the software handles large datasets and real-time data.
- Customer Support: Look for responsive help when you need it.
- Cost: Balance your budget with the features you need.
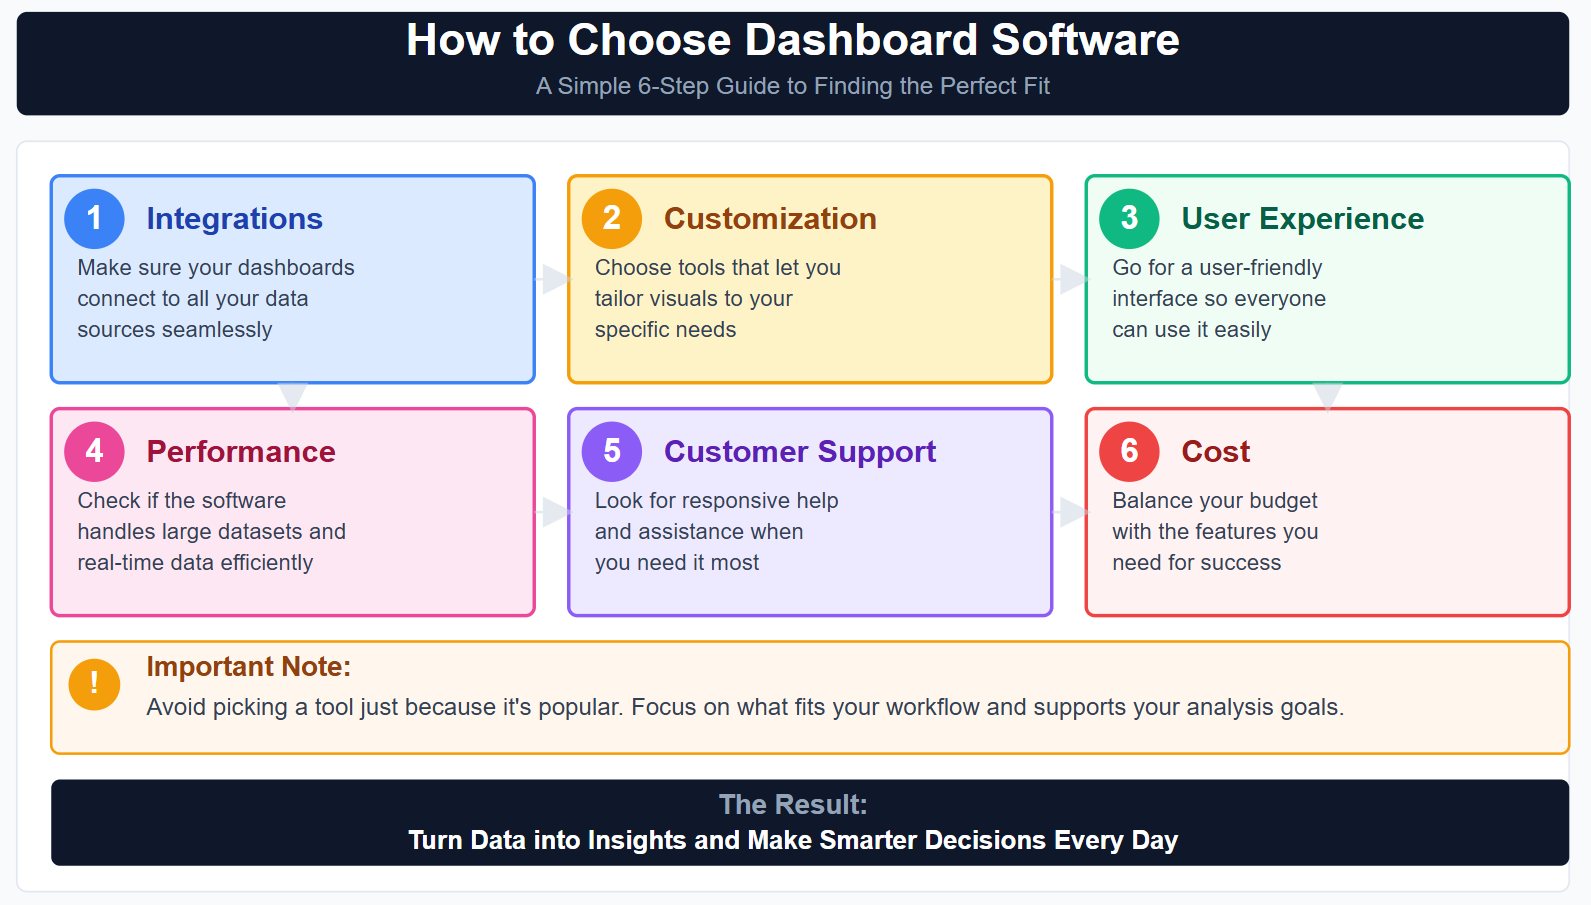
Note: Avoid picking a tool just because it’s popular. Focus on what fits your workflow and supports your analysis goals.
With the right dashboard tools, you can turn data into insights and make smarter decisions every day.
Maximizing Value with Dashboards
Implementation Best Practices
You want your dashboards to deliver real results, not just pretty charts. Start by knowing your audience and the purpose behind each dashboard. Place the most important view in the upper-left corner so it grabs attention right away. Keep things clear—limit the number of views to avoid clutter. Add interactivity, like filters, so users can explore data on their own. This makes dashboards more engaging and helps everyone dig deeper into the numbers. Use resources you already have to smooth out any bumps during setup. When you weave dashboards into your daily workflow, you make sure they become a natural part of your team’s routine. Always think about both short-term wins and long-term value for your users.
Integration and Optimization
You get the most from dashboards when they connect seamlessly with your existing systems. Here’s a simple roadmap to follow:
| Step | Description |
|---|---|
| Connect Data | Link dashboards to your ERP, CRM, or other databases using built-in connectors. |
| Define Dimensions | Set up dimensions and hierarchies for better data organization. |
| Build Dashboard Layout | Use templates to create a layout that fits your needs. |
| Customize Dashboard | Add charts and tables that highlight your key metrics. |
| Share with Team | Make sure everyone who needs insights can access the dashboards. |
Choose a platform that offers easy integration, real-time updates, and automation. This will improve reporting accuracy and help you act on insights faster. You can also boost data quality and automate routine tasks, like customer onboarding, with the right dashboard tools.
Success Stories with FineReport
Many organizations have unlocked new value by using FineReport for their dashboards. For example, Intenda, a global software company, embedded dashboards and reports into their analytics product. This move made it easier for users to interact with data and perform analysis right inside their application. By following best practices and focusing on integration, you can turn dashboards into a powerful tool for smarter decisions.
Choosing dashboarding software in 2025 means looking for tools that fit your business goals. You want integration capabilities, ease of use, and interactive dashboards for better analysis. Dashboards help you see complex data, track KPIs, and react quickly to changes. Try demos or free trials, like FineReport, to see what works for you. Here’s how you can get started:
- List your must-have features.
- Test a few platforms with your team.
- Review how each tool supports your daily work.
“It has helped us build a culture of data-driven decision-making year-round.”
Take the next step with FineReport and see how dashboards can transform your business.


FAQ

The Author
Lewis
Senior Data Analyst at FanRuan
Related Articles

How to Build an Investment Portfolio Reporting Dashboard for Executives: KPIs, Benchmarks, and Drill-Down Views
Investment portfolio reporting for executives is not about showing every holding, transaction, and chart your investment team can produce. It is about giving CEOs, CFOs, CIOs, boards, and investment committees a fast, re
Yida YIn
Jun 25, 2026

12 KPI Reporting Examples for Executive Dashboards: What to Show in Weekly, Monthly, and Quarterly Reviews
Executive leaders do not need more data. They need decision ready $1 examples that match how often they review the business and what actions they are expected to take. A weekly $1 should surface fast moving risks and per
Yida YIn
Jun 25, 2026

How to Build a Digital Marketing Reports Dashboard: Executive Examples, KPIs, and Templates
A $1 is the control layer that helps executives and marketing leaders turn scattered channel data into fast, confident decisions. If you are a CEO, CMO, operations director, or marketing analytics lead, the real problem
Yida Yin
May 07, 2026