Introduction
You want your business to grow faster next year. Picking the right business analytics software can make a big difference. When you use smart analytics tools, you get more than just numbers.
- You see how your customers behave.
- You spot trends and find what needs improvement.
- You make better choices and work more efficiently.
- You create experiences that feel personal for every customer.
Think about what matters most for your business right now. You have a lot of choices when it comes to business analytics software. To help you narrow it down, here are the 10 best business analytics tools for small businesses in 2026:
- FineReport
- Zoho Analytics
- Microsoft Power BI
- Looker Studio
- Yellowfin
- Qlik Sense
- ThoughtSpot
- Redash
- Teamwork.com
- Tableau
Tip: When you compare analytics tools, focus on what fits your team’s skills, your data sources, and your growth plans.
Top Business Analytics Software for Small Businesses
Overview of Each Tool
Let’s take a closer look at each business analytics software option. You’ll see how each one stands out for small businesses and what features matter most.
| Tool | Best For | Key Features | Ease of Use for Small Businesses |
|---|---|---|---|
| FineReport | Custom reporting and dashboards | Drag-and-drop report builder, real-time dashboards, automation, flexible data integration | Very user-friendly, minimal IT required |
| Zoho Analytics | Affordable, all-in-one analytics | 500+ integrations, AI assistant, data visualization, predictive analytics | Easy to learn, designed for business users |
| Microsoft Power BI | Microsoft ecosystem users | Seamless with Microsoft 365, Power Automate, interactive dashboards | Familiar for Microsoft users |
| Looker Studio | Cloud-based analytics | Drag-and-drop interface, strong data visualization, Google integrations | Intuitive for tech-savvy users |
| Yellowfin | Self-service analytics | Ad hoc reporting, browser-based, collaboration tools | Built for non-technical users |
| Qlik Sense | Advanced analytics | Interactive dashboards, associative data model, strong data discovery | Steeper learning curve |
| ThoughtSpot | Search-driven analytics | Natural language queries, AI insights, scalable cloud platform | Simple search, some usability quirks |
| Redash | SQL-based analytics | Query editor, open-source, dashboard sharing | Best for users with SQL knowledge |
| Teamwork.com | Project analytics | Customizable visuals, KPI tracking, project reporting | Easy for project teams |
| Tableau | Visual analytics | Rich visualizations, data blending, interactive dashboards | Popular, but may need some training |
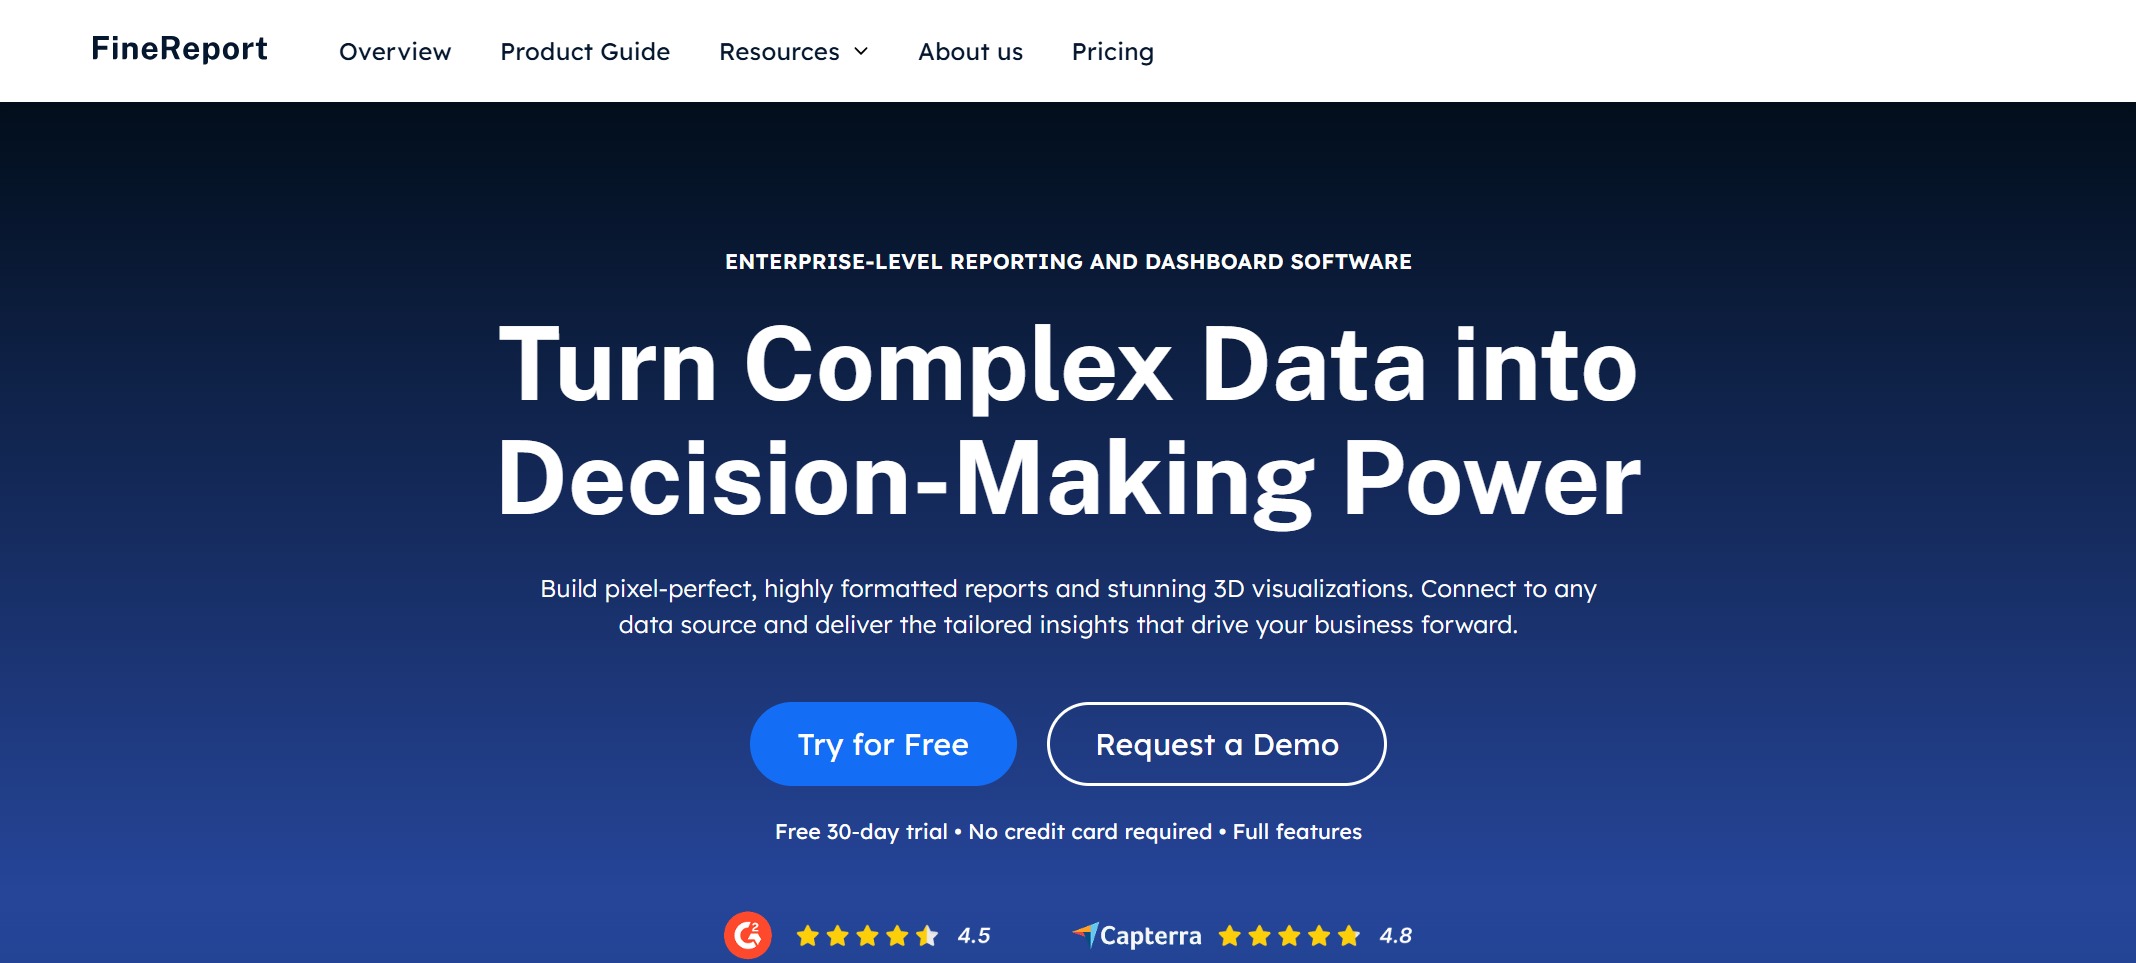
1.FineReport
You want a business analytics software that grows with you. FineReport by FanRuan gives you a flexible, visual way to build reports and dashboards. You can connect to almost any data source, automate your reporting, and create interactive dashboards with just a few clicks. The drag-and-drop interface feels familiar, even if you don’t have a technical background. You can schedule reports, manage permissions, and access your data on any device.
Website: https://www.fanruan.com/en/finereport
| Feature | Benefit for Small Businesses |
|---|---|
| User-Friendly Design | Build complex reports visually with minimal IT help |
| Automation Capabilities | Save time with automated report generation and distribution |
| Flexible Reporting | Use diverse visualizations and integrate data for better insights |

FineReport stands out because you can customize everything, from simple sales reports to advanced dashboards. You get real-time data, so your decisions are always based on the latest numbers. Many small businesses love how quickly they can set up FineReport and start seeing results.
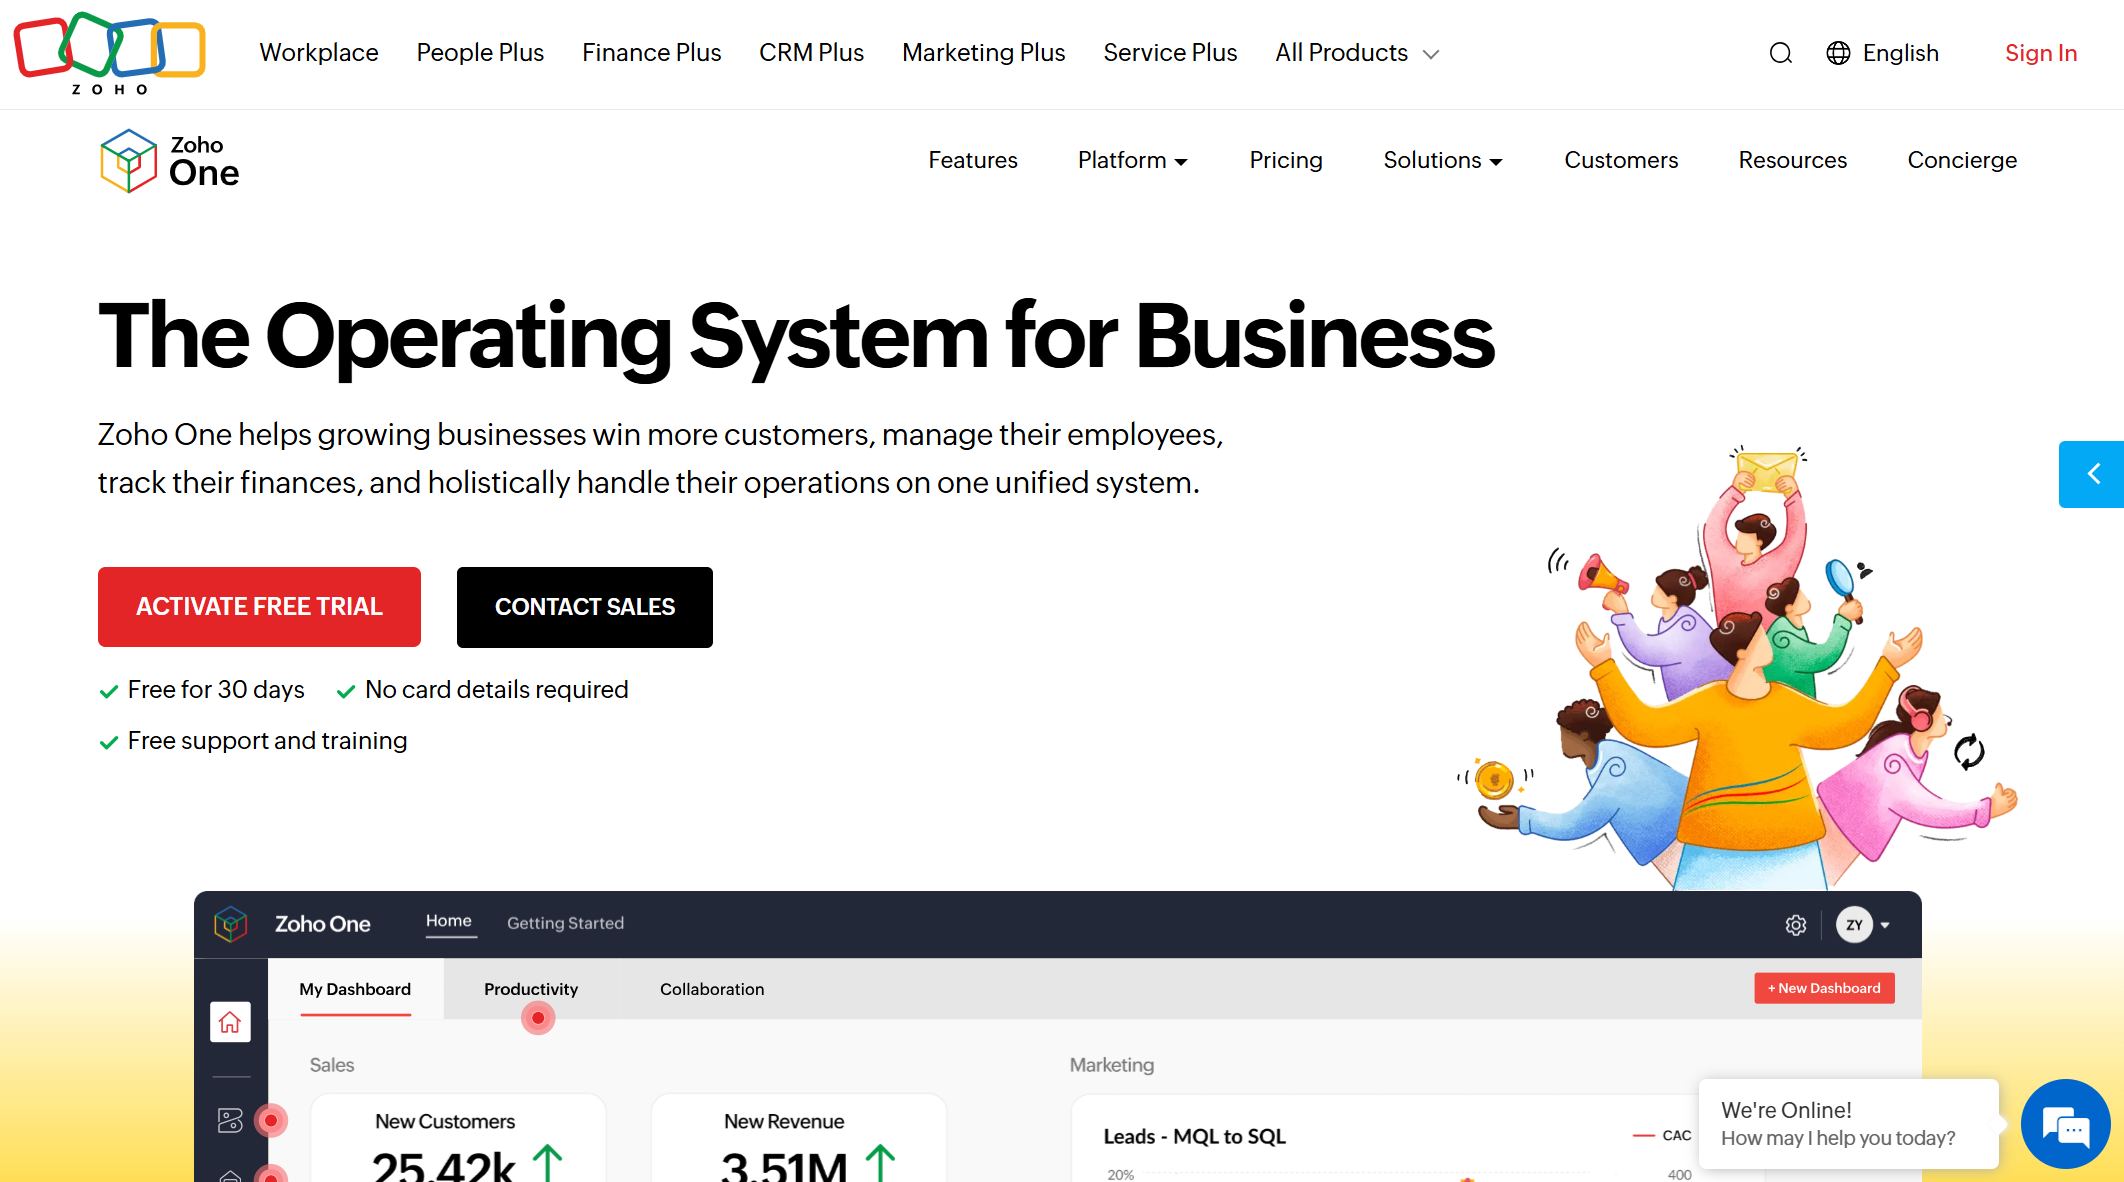
2.Zoho Analytics
If you want affordable business analytics tools with lots of integrations, Zoho Analytics is a top pick. You get over 500 integrations, an AI assistant called Zia, and a user-friendly interface. You can connect your CRM, marketing, and sales data in minutes. Zoho Analytics helps you visualize trends, track KPIs, and even predict future outcomes. Many startups use it to monitor their marketing funnel and boost their return on investment.
Website: https://www.zoho.com/pt-br/analytics/
3.Microsoft Power BI
Do you already use Microsoft 365? Power BI fits right in. You can pull data from Excel, Teams, and SharePoint, then build interactive dashboards. Power BI makes it easy to share insights with your team. You get familiar tools and strong integration, but you might need a power user to unlock its full potential.

Website: https://www.microsoft.com/en-us/power-platform/products/power-bi
4.Looker Studio
Looker Studio is a cloud-based business analytics software that lets you create dashboards with a simple drag-and-drop interface. You can connect to Google Analytics, BigQuery, and other cloud data sources. It’s great for small businesses that want to visualize data without a steep learning curve.

Website: https://lookerstudio.google.com/navigation/reporting
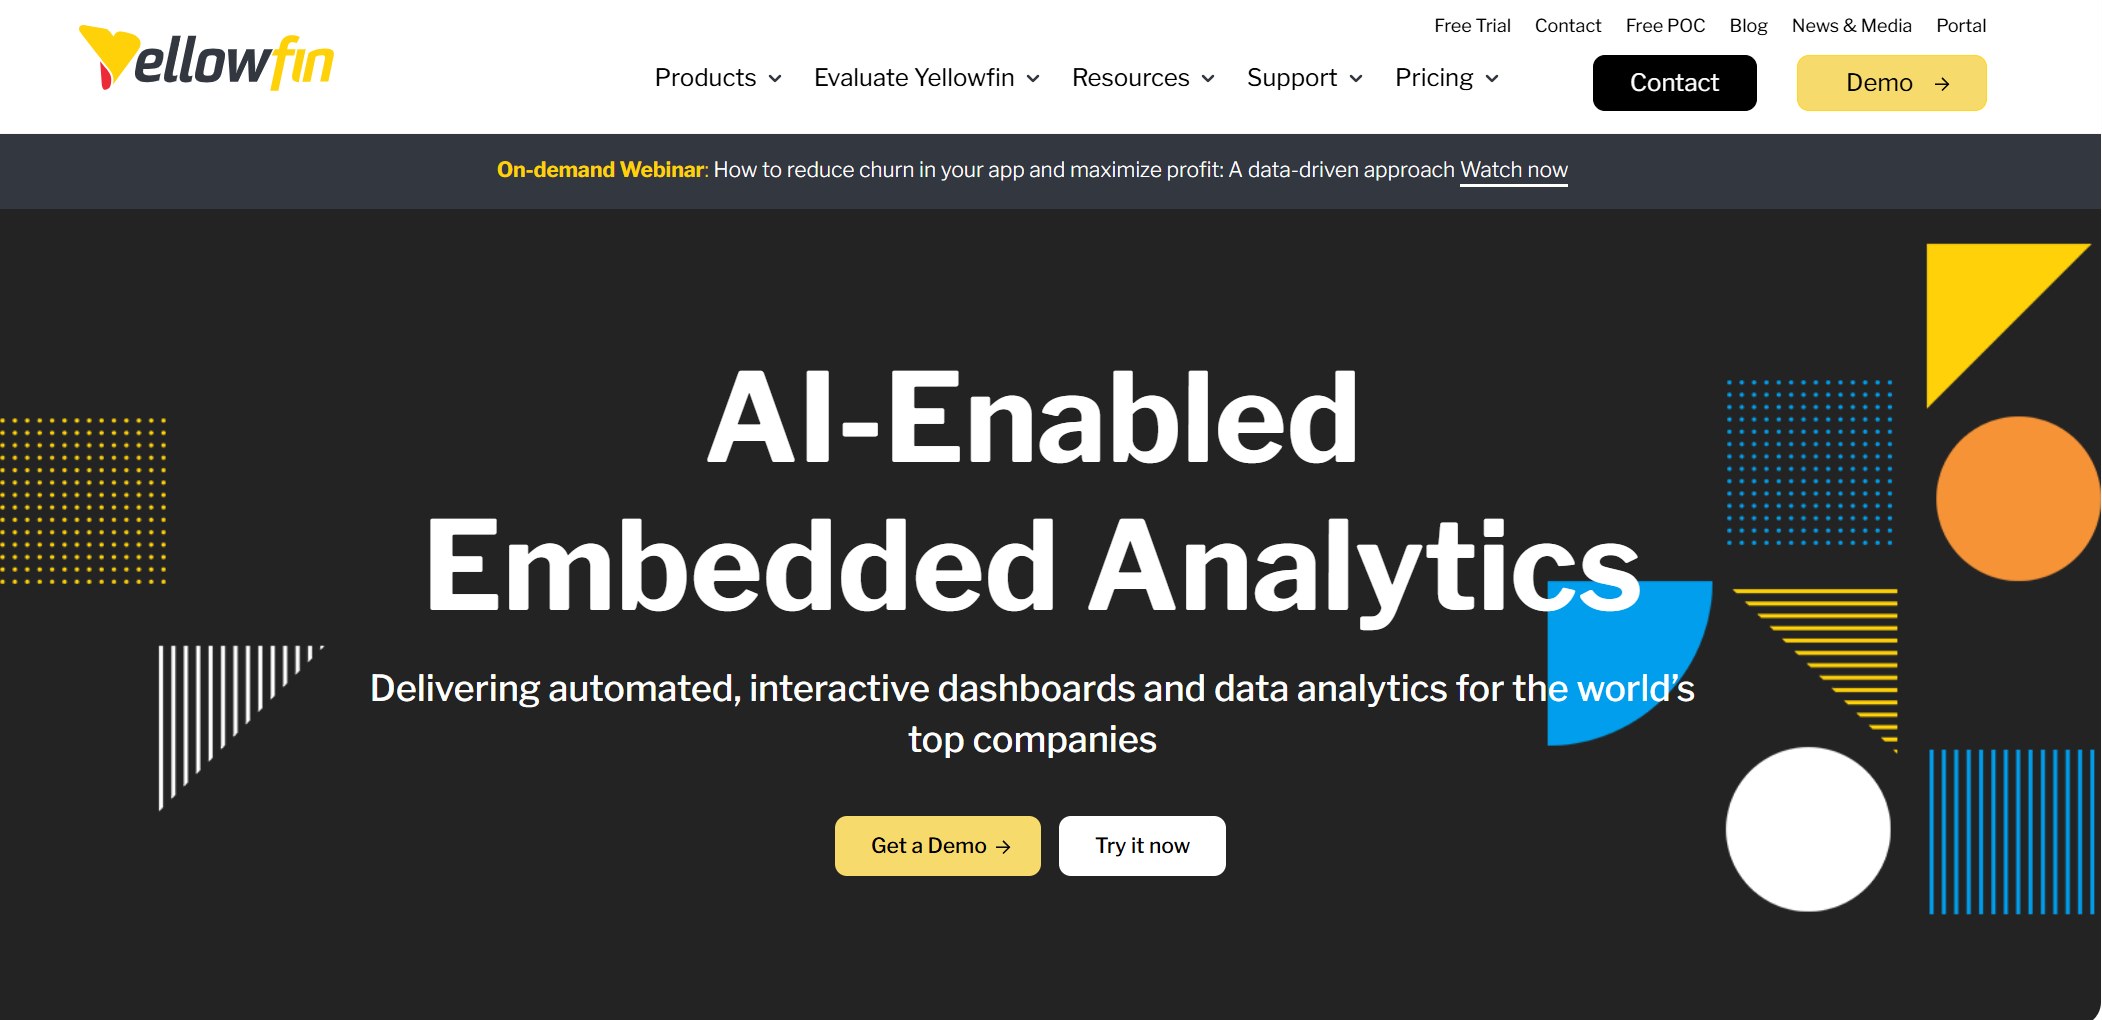
5.Yellowfin
Yellowfin is built for non-technical users. You can create ad hoc reports, collaborate with your team, and access everything through your browser. It’s a solid choice if you want business analytics tools that don’t require much training.
Website: https://www.yellowfinbi.com/
6.Qlik Sense
Qlik Sense offers powerful analytics tools for exploring your data. You get interactive dashboards and a unique associative data model. It’s best for small businesses that want to dig deep into their numbers, but it may take some time to master.

Website: https://www.qlik.com/us/products/qlik-sense
7.ThoughtSpot
ThoughtSpot lets you search your data using natural language. Just type a question, and you get instant insights. It’s ideal if you want fast answers without building complex reports. Some users find a few quirks, but the search-driven approach is a big plus.

Website: https://www.thoughtspot.com/
8.Redash
Redash is perfect if you or your team know SQL. You can write queries, build dashboards, and share results. It’s open-source and simple, but it works best if you’re comfortable with databases.
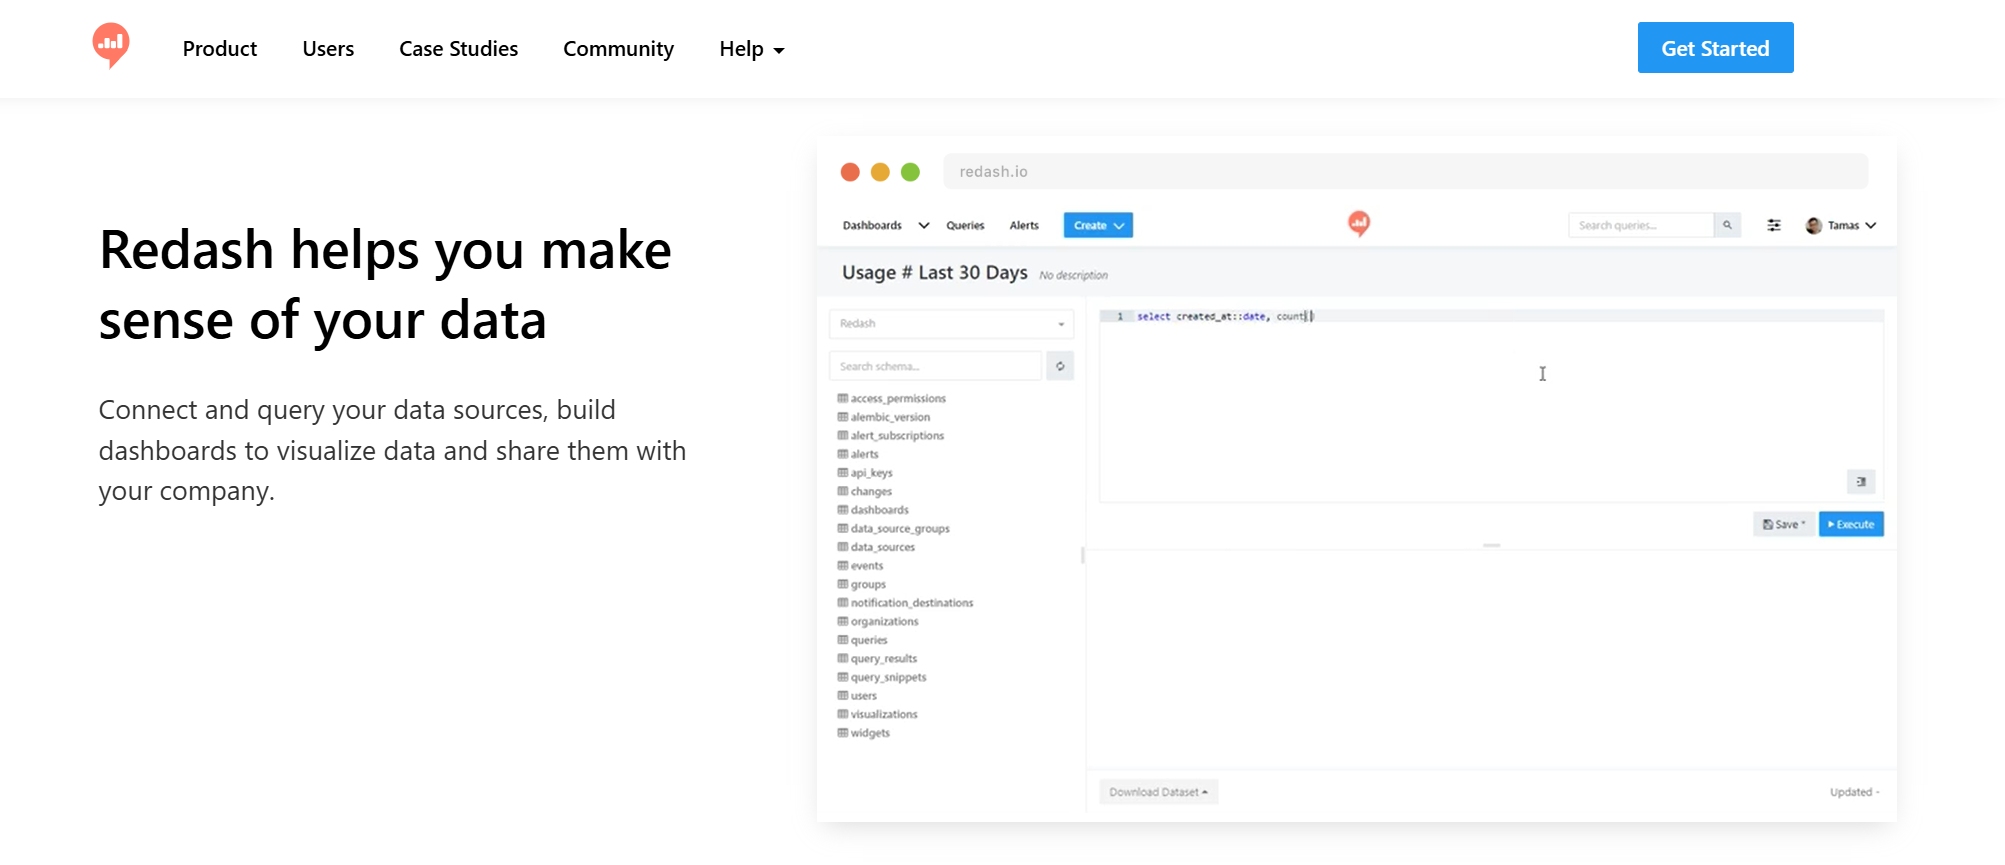
Website: https://redash.io/
9.Teamwork.com
Teamwork.com focuses on project analytics. You can track KPIs, generate reports, and visualize your project data. It’s easy to use and helps you keep your team on the same page.
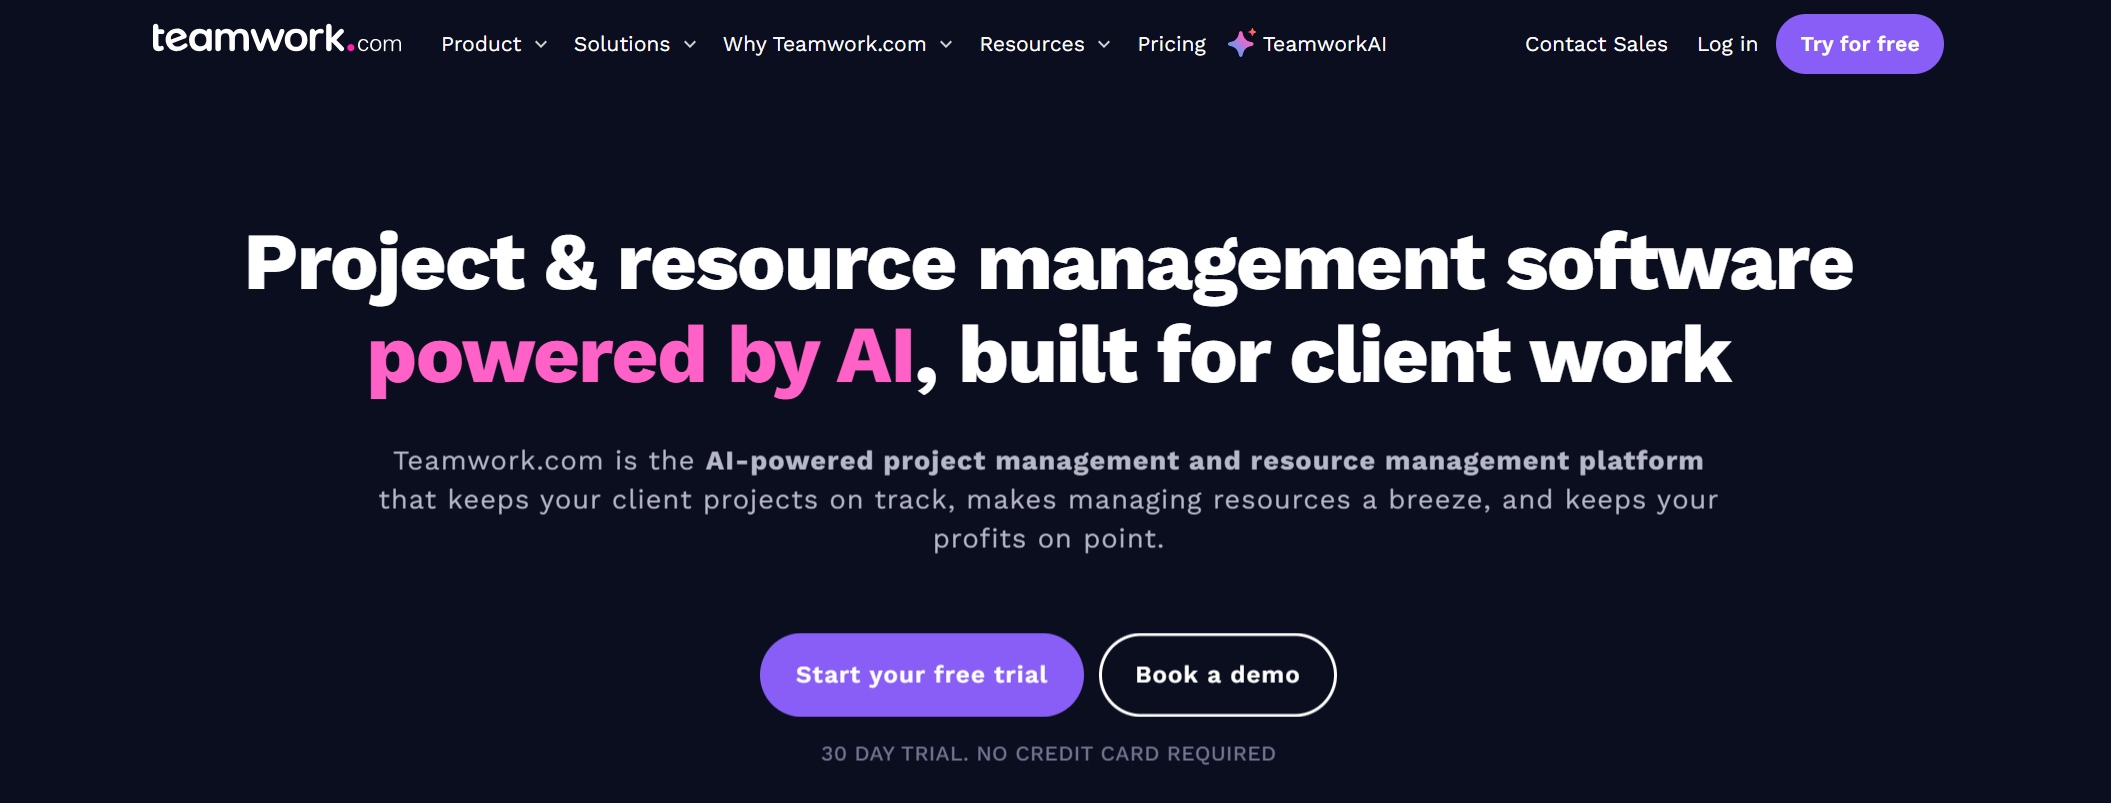
Website: https://www.teamwork.com/
10.Tableau
Tableau is famous for its visual analytics. You can blend data from different sources and create interactive dashboards. It’s popular with small businesses that want to make data look great, though you might need some training to get started.

Website: https://www.tableau.com/
Note: When you choose business analytics software, look at more than just features. Think about how easy it is to use, how well it connects to your current systems, and how it will scale as your business grows.
What Should You Look For?
Here’s a quick table to help you compare business analytics tools for small businesses:
| Criteria | What It Means for You |
|---|---|
| Functionality & Features | Can you analyze, predict, and visualize data in real time? |
| Ease of Use | Will your team learn it quickly? |
| Integration Capabilities | Does it connect to your CRM, ERP, or cloud apps? |
| Scalability & Performance | Will it keep up as your data grows? |
| Data Governance & Security | Are your data and privacy protected? |
| Cost & Licensing | Does the price fit your budget? |
| Vendor Support | Can you get help when you need it? |
| Innovation & Roadmap | Will the tool keep up with new trends? |
You have many great options for business analytics software in 2025. The right analytics tools will help your small business turn data into action, spot new opportunities, and stay ahead of the competition.
What Are Business Analytics Tools?
Definition and Core Functions
When you hear about business analytics tools, think of them as your digital assistants for making sense of data. These tools help you collect, process, and visualize information from different parts of your business. You can use them to spot patterns, predict trends, and make smarter choices every day.
Most business analytics tools come packed with powerful features. Here are some of the core functions you’ll find:
- Correlational analysis to see how different factors relate
- Regression analysis for predicting outcomes
- Factor analysis to uncover hidden influences
- Forecasting analysis to plan ahead
- Text mining for digging into customer feedback or reviews
- Image analytics for understanding visual data
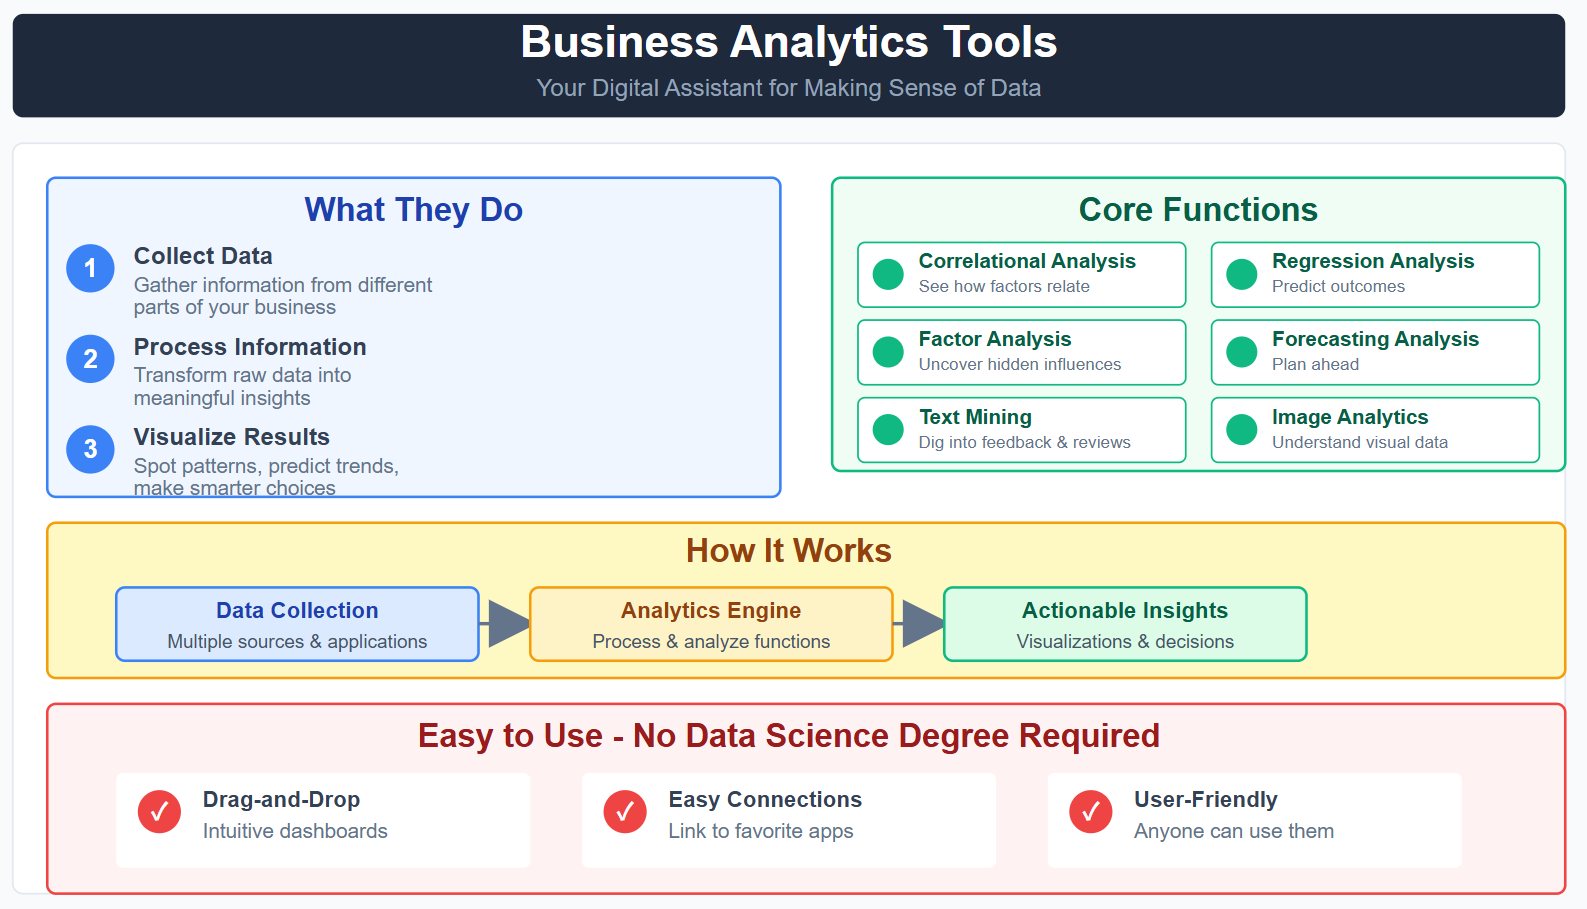
You don’t need to be a data scientist to use these tools. Many offer drag-and-drop dashboards and easy connections to your favorite apps.
How Analytics Tools Help Small Businesses
Business analytics tools give you a clear view of what’s happening in your company. They turn raw numbers into charts, graphs, and dashboards you can actually use. Here’s a quick look at how some popular tools process and visualize your data:
| Tool | Functionality |
|---|---|
| Looker | Uses SQL to model and visualize data |
| Tableau | Connects to SQL databases for rich dashboards |
| Power BI | Pulls data from SQL and other sources for interactive reports |
| Excel | Lets you create charts and graphs from your spreadsheets |
With these tools, you can:
- Make better decisions by spotting trends and patterns
- Track KPIs to boost efficiency
- Tailor your products or services to what customers want
- Save money by finding areas of waste
- Present your findings in a way that gets everyone on board
Small businesses often see big improvements after using analytics tools. For example, you can focus on your best customer segments, improve marketing ROI, and boost customer satisfaction. You’ll also spot new market opportunities by analyzing customer behavior and industry trends. Descriptive, predictive, and prescriptive analytics help you understand the past, forecast the future, and get actionable recommendations.
Why Small Businesses Need Analytics Tools in 2026
Trends in Business Intelligence Tools
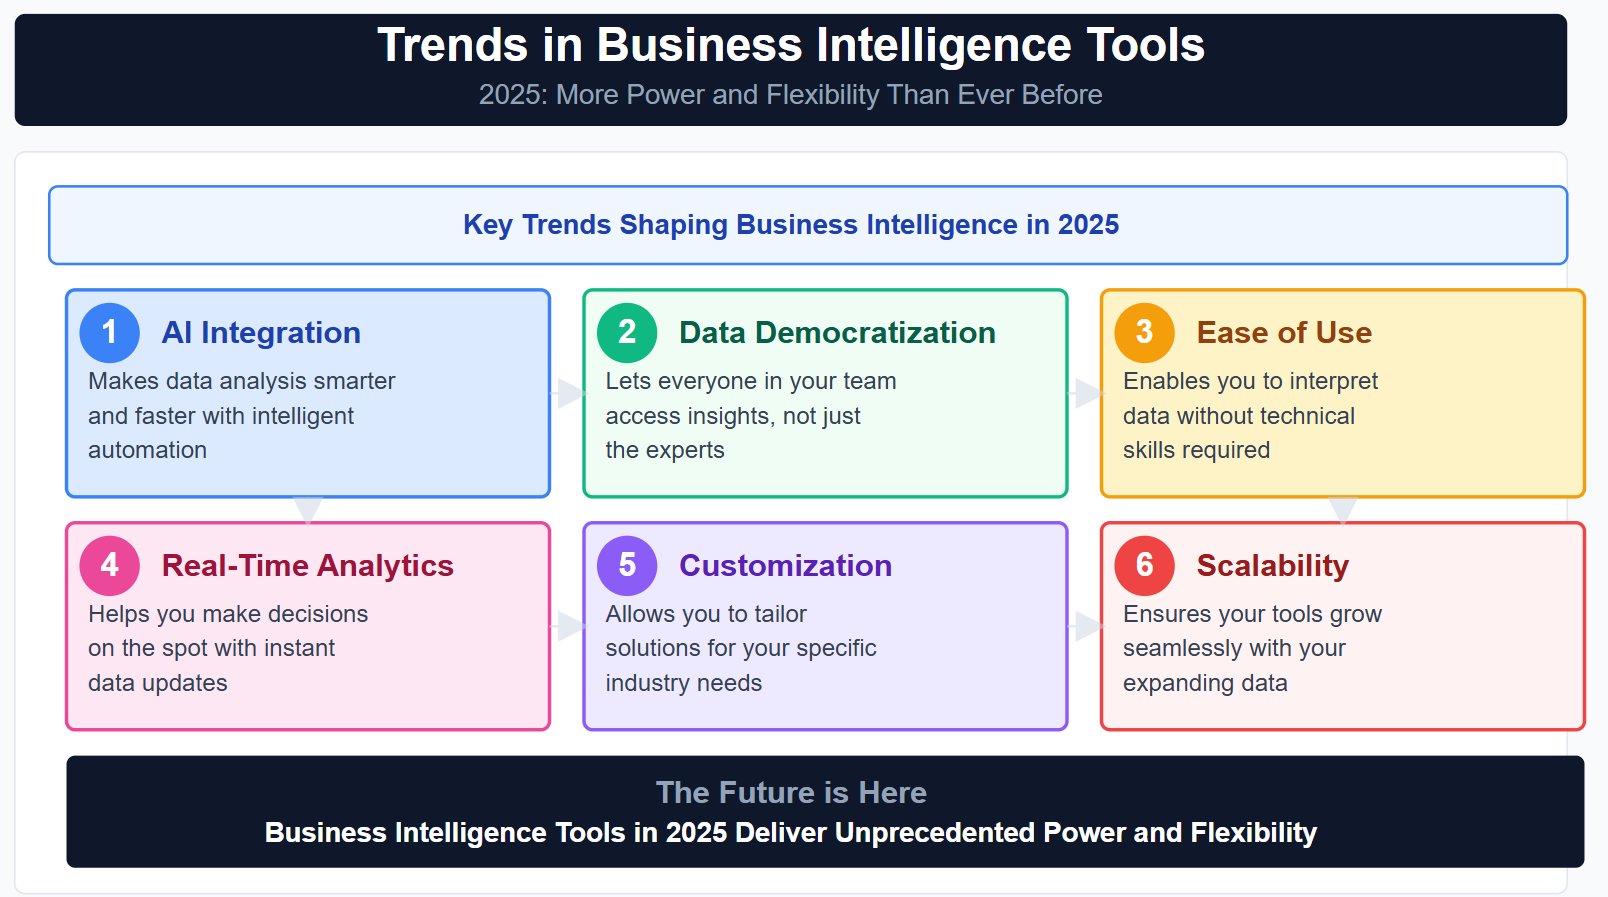
You see new trends shaping business intelligence every year. In 2026, business intelligence tools are changing fast. You get more power and flexibility than ever before. Here are some trends you should watch:
- AI integration makes data analysis smarter and faster.
- Data democratization lets everyone in your team access insights, not just the experts.
- Ease of use means you can interpret data without technical skills.
- Real-time analytics helps you make decisions on the spot.
- Customization and flexibility allow you to tailor solutions for your industry.
- Scalability ensures your tools grow with your data.
You might notice tools like Zebra AI and Querio. Zebra AI lets you upload files and build dashboards quickly. Querio gives you natural-language querying, so you can ask questions in plain English. These advances make business intelligence tools more accessible and useful for small businesses.
Impact on Decision-Making
Business analytics tools change how you make decisions. You get clear, actionable insights from your data. These tools help you understand your business performance and spot weaknesses. You can fix problems before they grow.
Here’s a table showing how business intelligence helps your decision-making:
| Benefit | Description |
|---|---|
| Actionable Insights | Turns raw data into smart choices for your business. |
| Process Optimization | Improves efficiency by streamlining your operations. |
| Predictive Analysis | Forecasts future trends and alerts you to possible challenges. |
You can analyze finances, track customer behavior, and optimize sales and marketing. Business intelligence tools also help you research your market and competitors. You make faster decisions, reduce costs, and foster innovation. Teams experiment with new ideas and learn from data. You build a culture of data literacy, so everyone feels confident using analytics. In 2026, business intelligence gives you the edge to grow and succeed.
Key Benefits of Business Analytics Software

Efficiency and Productivity Gains
You want your business to run smoother and faster. Business analytics platforms help you automate tasks and cut down on manual work. When you use business analytics tools, you can spot bottlenecks and remove steps that slow you down. Workflow automation lets you focus on customers instead of paperwork. You get more done in less time, which means higher productivity for your team.
Here’s a quick look at how business analytics platforms boost your efficiency and productivity:
| Area of Impact | Description |
|---|---|
| Cost Savings | Lower labor, material, and energy expenses lead to higher profitability. |
| Process Efficiency | Reduced cycle times and errors improve overall performance. |
| Productivity Gains | Higher output with fewer resources thanks to automation and optimization. |
| Customer Satisfaction | Faster service and fewer complaints drive customer loyalty. |
| Sustainability | Reduced energy use and emissions support your responsibility goals. |
| Data Utilization | Analytics-driven insights help you make better decisions. |
| Scalability | You can expand operations efficiently without losing quality. |
Business analytics platforms also help you use data visualization to see where you can improve. You get clear charts and dashboards that show what’s working and what needs attention. If you use a cloud-based solution, you can access these insights from anywhere.
- Workflow automation enhances efficiency by automating tasks, information, and documents.
- Employees spend more time with customers and less on tedious work.
- You can identify bottlenecks and remove unnecessary steps for a smoother workflow.
Customer Insights and Growth
Understanding your customers is key to growth. Business analytics tools let you analyze customer data and see what people like, buy, and talk about. You can use data analytics to spot trends and predict what your customers will want next. With business analytics platforms, you can personalize your marketing and improve your products.
- You get a better understanding of customer preferences and behaviors.
- Targeted marketing becomes easier, and your product offerings improve.
- Informed decisions come from real data, not just guesses.
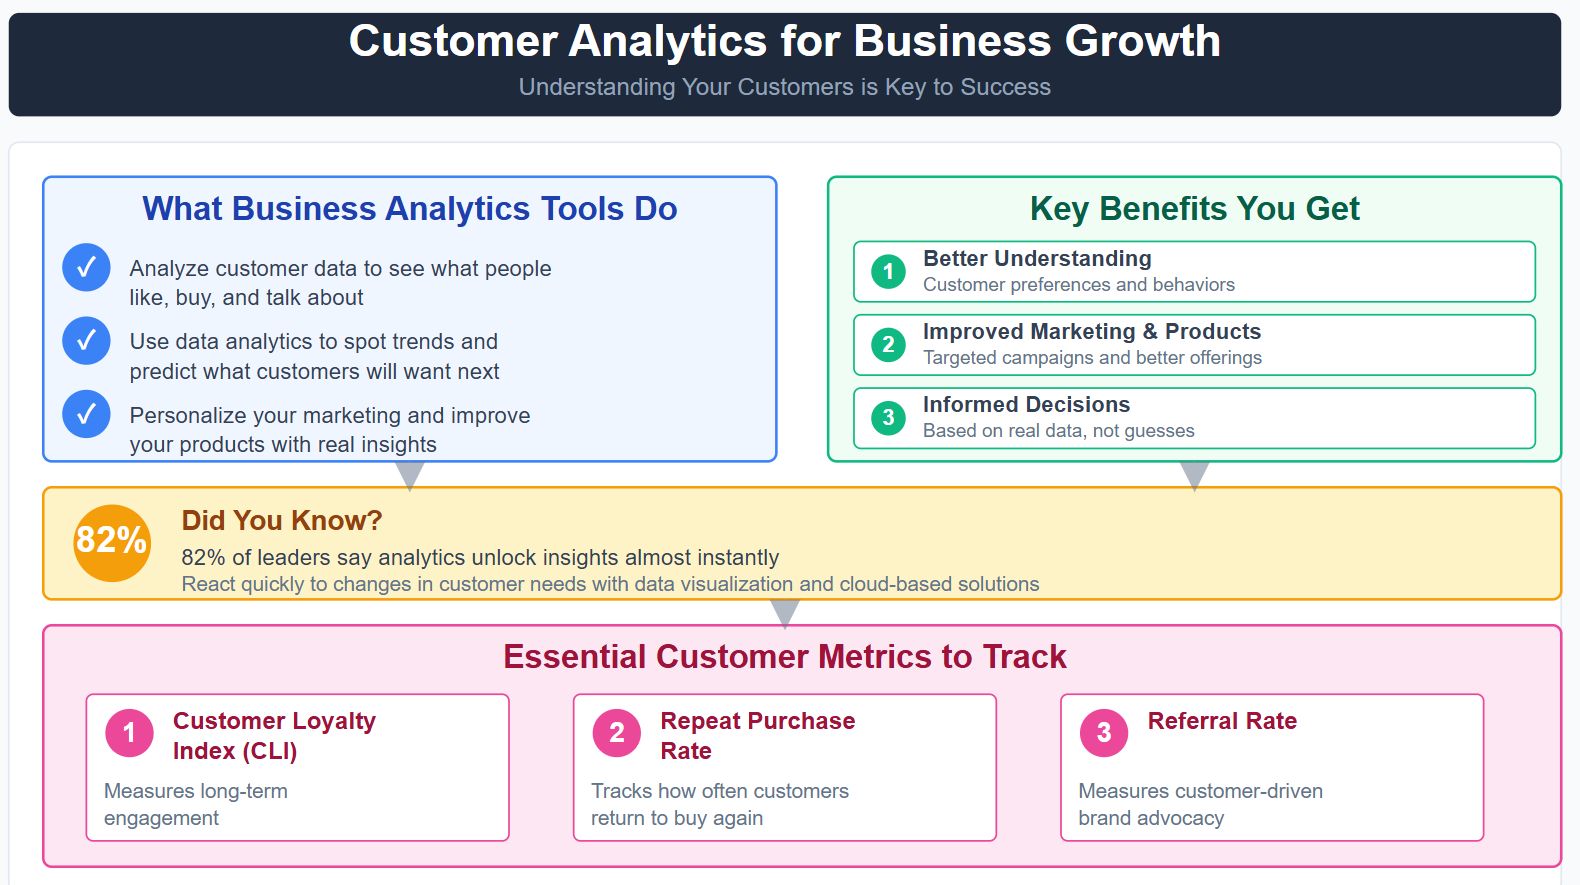
Did you know that 82% of leaders say analytics unlock insights almost instantly? That means you can react quickly to changes in customer needs. Data visualization helps you see these patterns clearly, especially when you use a cloud-based solution.
| Metric | Description |
|---|---|
| Customer Loyalty Index (CLI) | Measures long-term engagement. |
| Repeat purchase rate | Tracks how often customers return. |
| Referral rate | Measures customer-driven brand advocacy. |
Big brands use business analytics platforms to boost retention. Starbucks personalizes rewards and saw a 40% revenue jump from loyalty members. Netflix sends emails to re-engage users, cutting cancellations. Amazon Prime members spend 133% more because of personalized recommendations.
Focusing on customer retention pays off. It costs much less to keep a customer than to find a new one. When you use business analytics tools, you grow faster and maximize the lifetime value of every customer.
Comparing Top Business Analytics Tools
Main Features and Integrations
You want analytics software that fits your business and connects with your favorite tools. Here’s a quick look at how the top options stack up:
| Tool | Key Features | Integrations |
|---|---|---|
| Zoho Analytics | Data integration, AI insights, scheduled reports, mobile access | 500+ connectors (Zoho, SaaS, DBs) |
| Microsoft Power BI | Data modeling, DAX, natural language queries, mobile dashboards | 100+ sources (Excel, Azure, DBs) |
| Looker Studio | Drag-and-drop dashboards, Google ecosystem, strong visualization | 300+ connectors (Google, partners) |
| Qlik Sense | Associative data model, advanced analytics, interactive dashboards | Broad DB, SaaS, on-prem connectors |
| ThoughtSpot | Search-driven analytics, AI insights, cloud platform | Cloud data warehouses |
| FineReport | Drag-and-drop design, real-time dashboards, flexible integration, 3D charts, data entry | All mainstream databases, APIs |
You’ll notice most tools offer easy connections to databases, cloud apps, and spreadsheets. FineReport stands out with its support for all major databases and open APIs, making integration a breeze.

Pros, Cons, and Use Cases
Every tool has its strengths. Here’s a quick guide to help you match the right tool to your needs:
| Tool | Pros | Cons | Best Use Case |
|---|---|---|---|
| Zoho Analytics | Affordable, easy setup, lots of integrations | Some features limited | All-in-one analytics for SMBs |
| Power BI | Familiar for Microsoft users, strong security | Can feel complex for beginners | Teams using Microsoft 365 |
| Looker Studio | Free, Google-friendly, flexible dashboards | Needs Google account | Marketing and web analytics |
| Qlik Sense | Powerful analytics, in-memory engine | Steeper learning curve | Deep data exploration |
| ThoughtSpot | Fast search, AI-driven insights | Some usability quirks | Quick answers, self-service BI |
| FineReport | User-friendly, highly customizable, real-time data | — | Custom reporting, fast deployment |
You can pick a tool that matches your team’s skills and your business goals.
FanRuan FineReport: Unique Value for Small Businesses
FineReport gives you a flexible way to build reports and dashboards—no coding needed. You can combine data from multiple sources with one click. The drag-and-drop designer helps you create impressive dashboards in minutes. FineReport offers over 50 chart styles, including cool 3D effects, so your data always looks sharp.
You can input and update data in real time, which keeps your reports fresh. Open APIs let you customize everything to fit your workflow. FineReport supports all mainstream databases, so you never worry about compatibility. Small businesses rate FineReport highly for its ease of use and fast setup. If you want a tool that grows with you, FineReport is a smart choice.


How to Choose the Right Analytics Tool
Ease of Use and Integration
You want analytics software that feels easy from day one. If you run a small business, you need tools that work with your current systems and don’t require hours of training. Take a look at this table to see how popular options stack up:
| Software | Ease of Use Description | Integration Capabilities Description |
|---|---|---|
| Google Analytics | User-friendly solution providing insights into traffic and behavior. | Integrates well with digital marketing tools. |
| Tableau | Makes complex data easy to understand with great visuals. | Connects to many data sources for deep analysis. |
| Microsoft Power BI | Works smoothly with Microsoft programs for easy use. | Integrates with Excel and Word for better workflow. |
| Zoho Analytics | Turns data into simple reports for a better experience. | Cloud-based, connects with online platforms. |
| Klipfolio | Personal dashboard for quick views. | Pulls data from many apps for a unified look. |
| Excel | Basic analysis with charts and tables. | Works with other Office tools for more options. |
Scalability and Cost
As your small business grows, your analytics needs will change. You want a solution that scales with you and fits your budget. Here are some things to keep in mind:
- Initial setup costs can range from $1,000 to $20,000.
- Monthly expenses usually fall between $100 and $1,000.
- Cloud tools charge by user count.
- Subscriptions offer pre-built dashboards.
- Outsourcing analytics can save money compared to hiring staff.
- Custom solutions may cost more as your business expands.
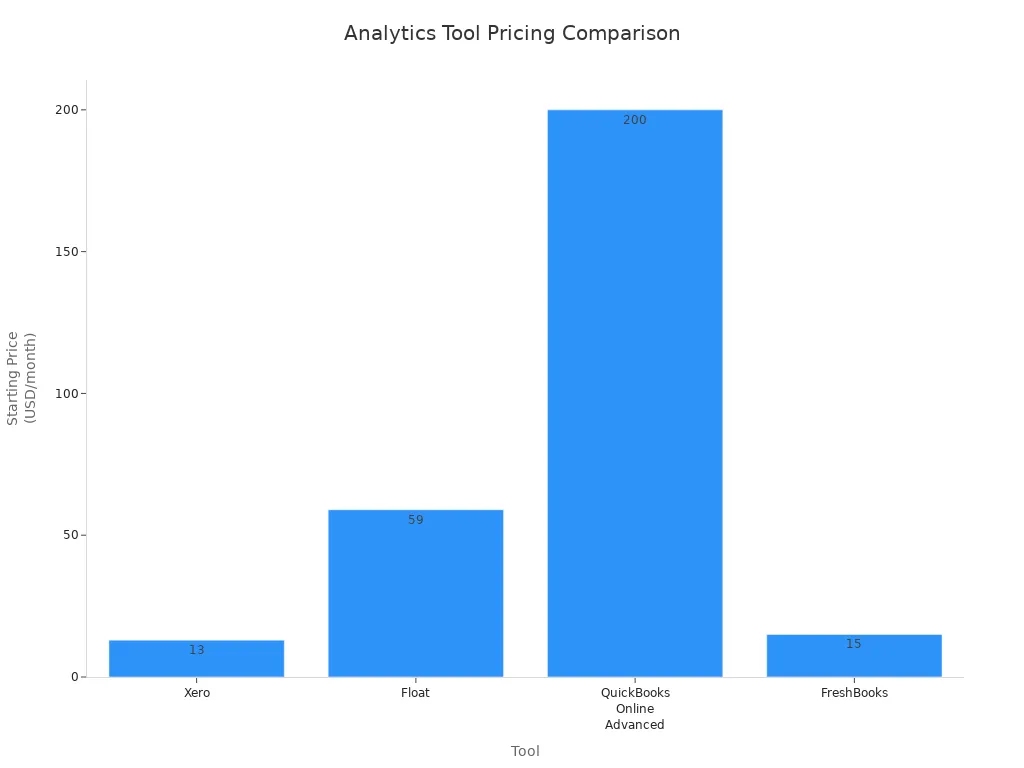
Check out this chart to compare starting prices for popular tools:
Features for Small Business Needs
You want features that help you make data-driven decisions and keep your small business running smoothly. Focus on these essentials:
- Data processing capabilities
- Integration with your current systems
- Easy user experience
- Compliance and security
- Cost that matches your budget
- Vendor reputation
When you use feature prioritization tools, you can focus on what matters most for your customers. These tools help you save time, spot new trends, and work better as a team. You’ll build a data-driven culture and boost satisfaction and revenue.
Choosing the right business intelligence software helps you reach your goals faster. Match your needs with the features you saw in this guide. Data-driven decisions give you an edge and keep your business moving forward. Try free demos or trials, like FineReport, to see which tool fits best.


FAQ

The Author
Lewis
Senior Data Analyst at FanRuan
Related Articles

ERP Reporting Explained: What It Is, How It Works, and Why Enterprise Teams Rely on It
ERP reporting is the process of turning data inside your enterprise resource planning system into usable business insight. For finance leaders, operations directors, supply chain managers, and IT teams, that matters beca
Yida Yin
Jun 25, 2026
8 Best Restaurant Reporting Software Tools for 2026: Compare FineReport, Toast, SpotOn & More
$1 is a highly customizable business intelligence and reporting platform that helps restaurants turn POS, labor, inventory, finance, and multi location data into real time dashboards and decision ready reports. 8 Best Re
Yida Yin
Jun 24, 2026

Database Reporting Architecture: When to Use a Reporting Database vs Your Operational System
$1 is not just about pulling data into a dashboard. It is an architecture decision that affects application performance, reporting speed, data trust, and how confidently your teams can make decisions. If you are an IT ma
Yida Yin
Jun 24, 2026