A best dashboard software is a tool that transforms complex data into intuitive, interactive visualizations that enable users to monitor key metrics, make informed decisions, and share insights across their organization in real-time.Looking for the best dashboard software for 2025? You’ll want to check out these top 10 picks:
Tableau
Microsoft Power BI
Lark
Klipfolio
Julius
Google Looker
Qlik Sense
Domo
Sisense.
These dashboard tools stand out with powerful data visualization, interactive dashboards, and advanced analytics. You can connect your data, uncover fresh insights, and streamline reporting. When you choose dashboard software, think about performance, customer support, user reviews, and cost. Use the table below for a quick comparison before you dive into the details.
| Criteria | Description |
|---|---|
| Performance | Speed of data processing, responsiveness under heavy loads, and reliability over time. |
| Customer Support | Responsiveness, knowledge, and availability of support through various channels. |
| User Reviews | Insights into real-world performance, common issues, and customer satisfaction. |
| Cost | Consideration of upfront costs and long-term value of the investment. |
Let’s break down what makes each of these dashboard software solutions a top pick for 2025:
You can see that each dashboard software brings something unique to the table. Whether you want advanced analytics, easy reporting, or beautiful data visualization, you’ll find a solution that matches your needs.
If you want a dashboard software that makes business reporting easy, FineReport by FanRuan is a top choice. You can create interactive dashboards and kpi dashboards with pixel-perfect reporting and advanced data visualization. FineReport connects to many data sources, so you can pull in data from databases, files, and cloud services. You get a drag-and-drop designer that feels like Excel, which helps you build dashboards and reports quickly.
Website: https://www.fanruan.com/en/finereport
FineReport stands out for its 3D dashboards and mobile access. You can view dashboards on your phone, tablet, or desktop. The platform supports embedded analytics, so you can add dashboards and reports to your own apps or portals. You also get self-service analytics, which means you can explore data and create visualizations without needing IT help.
FineReport works well for many industries and use cases. Here’s a quick look:
| Use Case/Industry | Description |
|---|---|
| Large Enterprises | Focus on communication and sales document management. |
| Government Sectors | Utilized for various reporting and management tasks. |
| Financial Analysis | Supports financial reporting and analysis. |
| Sales Operations | Aids in sales tracking and operational monitoring. |
| Business Management | Facilitates overall business management processes. |
| Production Management | Helps in managing production-related data. |
| IT Departments | Used for self-service analytics and system integration. |

You can automate reporting, schedule tasks, and manage permissions for secure data access. FineReport supports kpi dashboards for tracking sales, finance, and production metrics. You get interactive reporting and embedded analytics for deeper data insights. If you want the best dashboard software for business intelligence, FineReport gives you flexibility, scalability, and strong integration options.
Tip: FineReport’s dashboards help you turn raw data into actionable insights for smarter decisions.

Tableau is a popular dashboard software for data visualization and analytics. You can build interactive dashboards with drag-and-drop tools. Tableau lets you connect to many data sources and create custom visualizations. You get kpi dashboards for tracking business performance and reporting.

Website: https://www.tableau.com/
Tableau is known for its strong visualization features, but you might notice a steeper learning curve if you’re new to dashboard software. Here’s how Tableau compares to other tools:
| Aspect | Tableau | Competitors (e.g., Power BI, ThoughtSpot) |
|---|---|---|
| Data Processing Times | Slow | Faster |
| Data Preparation Capabilities | Limiting | More robust |
| Learning Curve | Steeper for non-technical users | More user-friendly |
| Licensing Costs | High | More competitive pricing |
| Customer Support | Limited | More responsive |
You may face some challenges when you start using Tableau. Here are common issues and solutions:
| Challenge | Solution |
|---|---|
| Steep Learning Curve | Use tutorials, webinars, and community forums; join training programs. |
| Performance Issues | Optimize data sources, use extracts, and limit dashboard visuals. |
| Data Integration Difficulties | Use Tableau Prep and data warehouses for easier integration. |
| Limited Advanced Analytics | Connect Tableau with R or Python for advanced analytics. |
| Licensing and Cost | Review licensing options and try free versions for small projects. |
| User Collaboration and Sharing | Use Tableau Server or Online for better sharing. |
| Data Security and Governance | Set up governance policies and use Tableau’s security features. |
You get embedded analytics and interactive dashboards, but you may need extra training to unlock all features. Tableau is a strong choice for business intelligence and kpi dashboards if you want deep data insights and custom visualizations.
Microsoft Power BI is a dashboard software that works well with other Microsoft products. You can create dashboards, kpi dashboards, and business reporting with real-time data updates. Power BI makes it easy to connect to Excel, SQL Server, and cloud services.

Website: https://www.microsoft.com/en-us/power-platform/products/power-bi
You get embedded analytics and interactive dashboards for business intelligence. Power BI integrates with Microsoft services, so you can explore data and build reports without switching platforms. Here are some integration and scalability features:
Power BI is also known for its competitive pricing. Here’s a quick comparison:
| Tool | Entry Point | 10 Users | 100 Users | Enterprise |
|---|---|---|---|---|
| Power BI Pro | $10/mo | $1,200/yr | $12,000/yr | Premium required |
| Tableau | $75/mo | $9,000/yr | $90,000/yr | $145,000/yr |
| Looker | Custom | $36,000+/yr | $180,000+/yr | $500,000+/yr |
| Qlik Sense | Custom | $30,000+/yr | $150,000+/yr | Custom |
You get embedded analytics, kpi dashboards, and business reporting at a lower cost. Power BI is a great choice if you want scalable dashboards and strong integration with Microsoft tools.
Lark is a dashboard software that combines collaboration and analytics. You can create dashboards and share data insights with your team. Lark’s dashboard tools are easy to use, and you get a user-friendly interface for building kpi dashboards and business reporting.
Website: https://www.larksuite.com/en_sg/
Users rate Lark highly for ease of use and customization. You can set up dashboards quickly and adjust visualizations to fit your needs.
Lark is a good pick if you want simple dashboards and embedded analytics for team projects. You can track kpi metrics and share interactive dashboards for better collaboration.
Klipfolio is a dashboard software designed for small and medium-sized businesses. You get cost-effective dashboards, kpi dashboards, and business reporting with easy setup. Klipfolio’s interface is simple, so you can build dashboards and visualizations without coding.

Website: https://www.klipfolio.com/
Here are the main benefits:
Klipfolio connects to almost any data source. You get real-time dashboards, beautiful visuals, and helpful support. Leaders can check dashboards on TV, desktop, or mobile. Klipfolio offers strong value for money and embedded analytics for small teams.
Klipfolio also takes data security seriously:
| Obligation Type | Description |
|---|---|
| Customer's Obligation | Ensure lawful instructions and disclosures of Customer Personal Information. |
| Klipfolio's Obligation | Process Customer Personal Information only as instructed by the Customer. |
| Security Measures | Use technical and organizational safeguards for data protection. |
| Data Breach Notification | Notify customers within 72 hours of any security breach. |
You get SSL/TLS for secure connections, password controls, and regular security assessments. Klipfolio is a solid choice for small businesses that want reliable dashboards and embedded analytics.
Julius is a dashboard software that focuses on advanced analytics and real-time data processing. You can build customizable dashboards for different industries, including finance, retail, and healthcare. Julius helps you create kpi dashboards and business reporting with predictive modeling and compliance features.
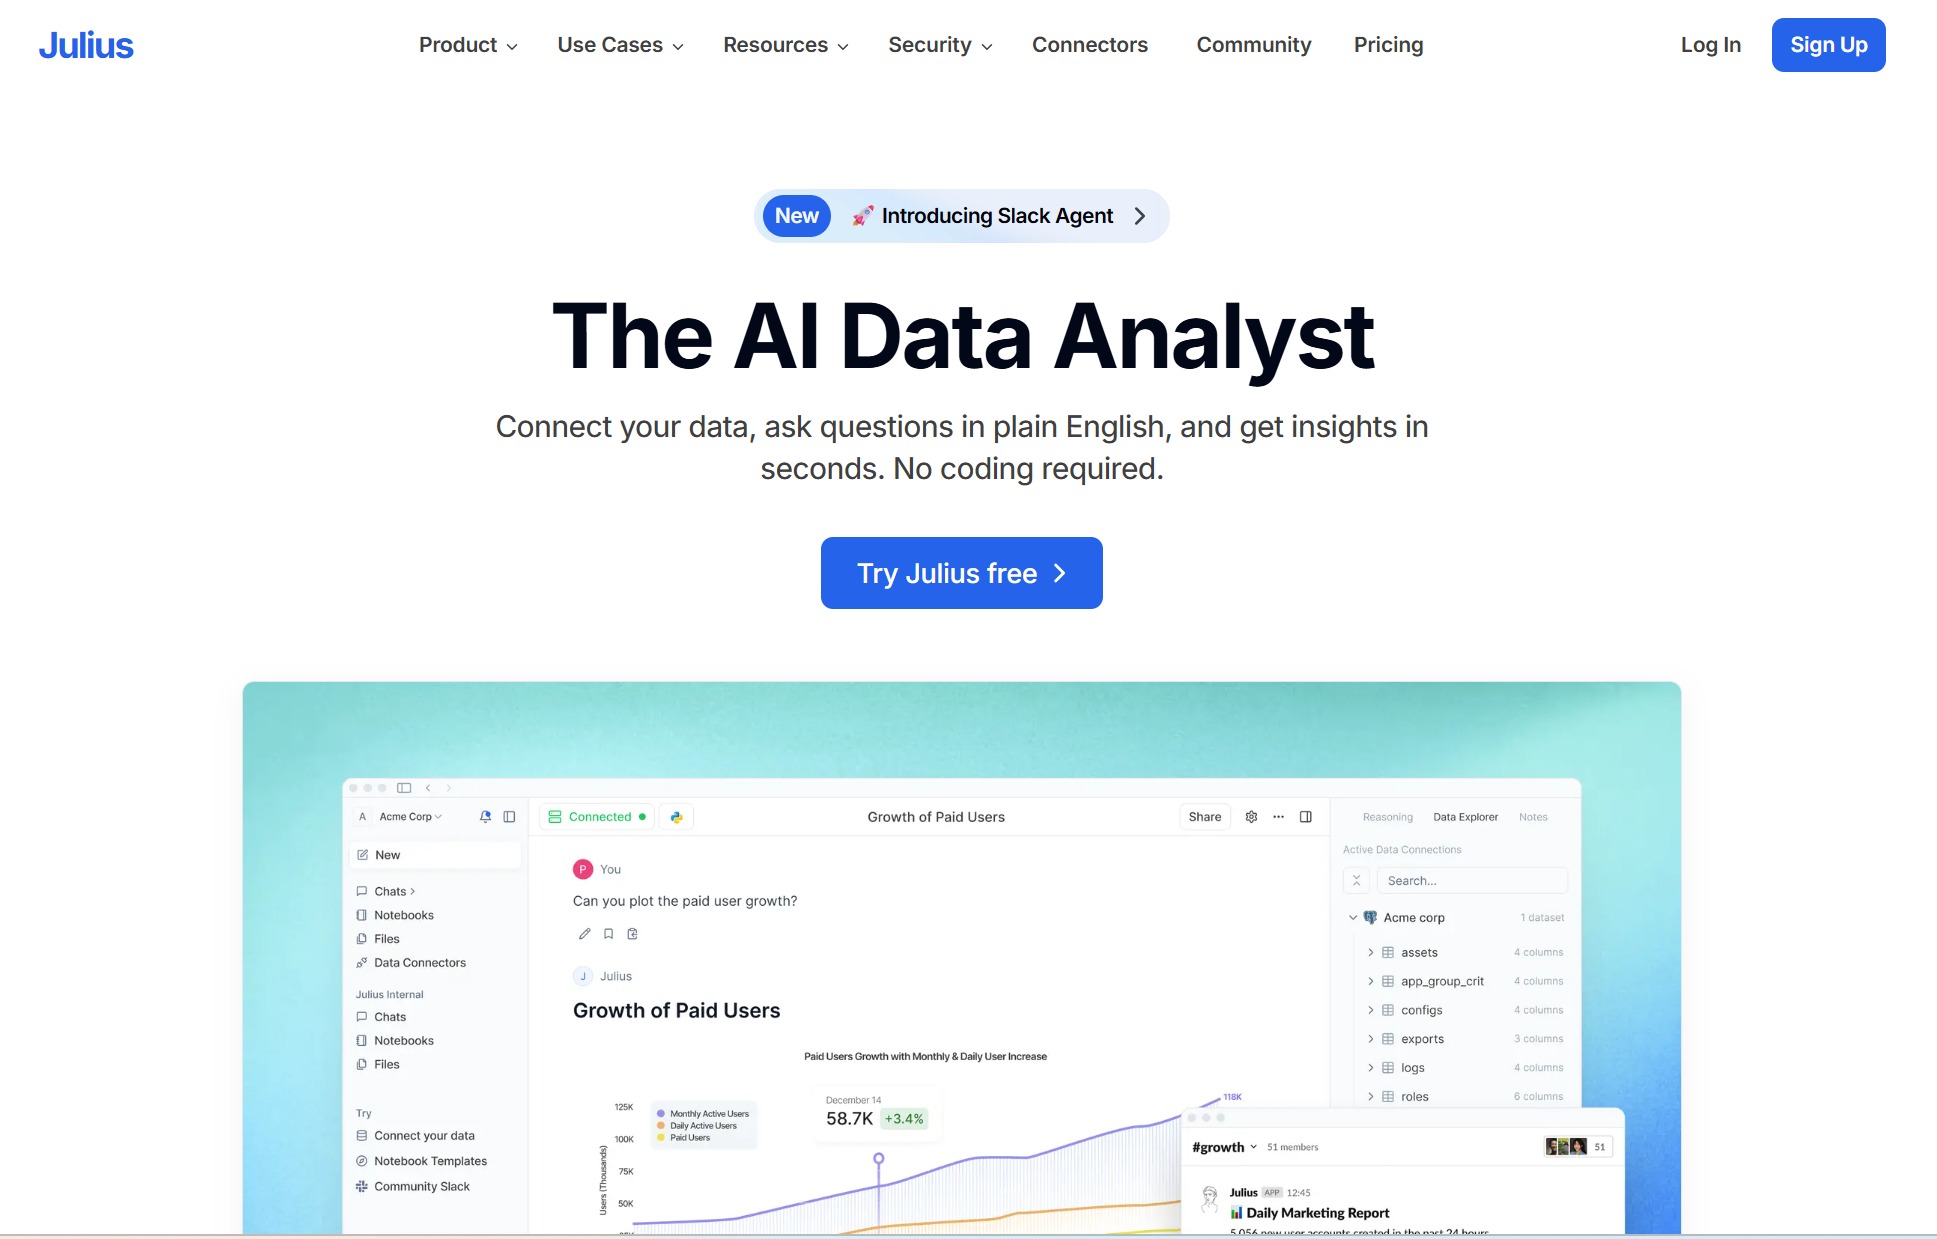
Website: https://julius.ai/
| Feature/Benefit | Description |
|---|---|
| Advanced Analytics | Provides insights to optimize operations and improve strategies. |
| Real-Time Data Processing | Enables instant data analysis for timely decision-making. |
| Customizable Dashboards | Tailored insights based on specific industry needs. |
| Predictive Modeling | Forecasts future trends using historical data. |
| Compliance and Reporting | Strong focus on meeting regulatory requirements. |
| Industry Versatility | Integrates seamlessly into finance, retail, and healthcare. |
Enterprise users like Julius for its strong performance and usability. You get efficient data analysis, plug-and-play dashboards, and easy visualization. Julius bridges the gap between data analysis and storytelling, making it easier to share insights.
Julius is a good fit if you want embedded analytics, interactive dashboards, and advanced business intelligence.
Google Looker is a dashboard software that integrates with Google Cloud for enhanced analytics. You can build dashboards, kpi dashboards, and business reporting with secure data access and semantic modeling. Looker helps you maintain data consistency and accuracy, creating a single source of truth for your organization.
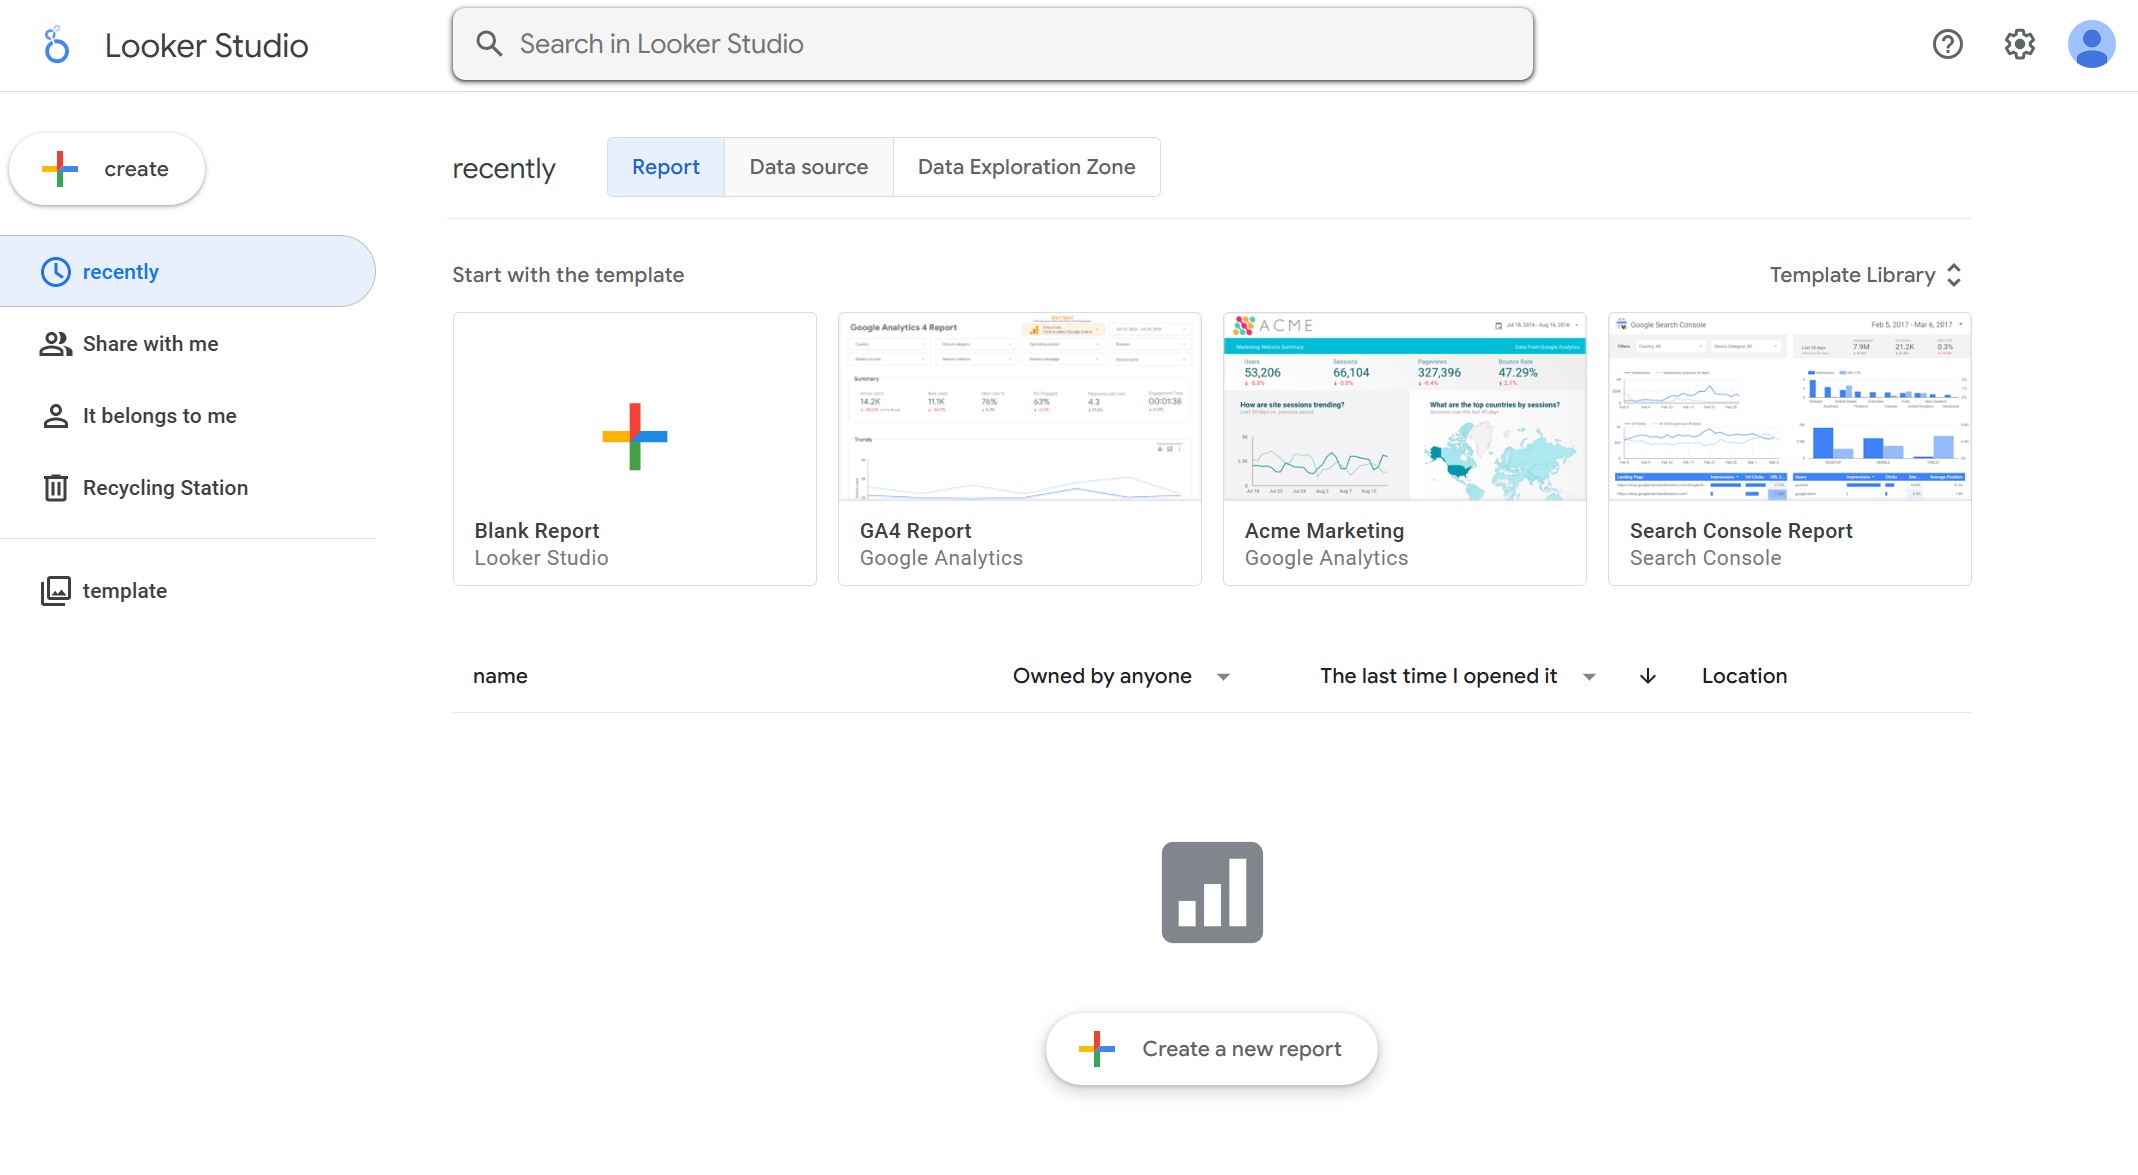
Website: https://lookerstudio.google.com/navigation/reporting
| Feature | Description |
|---|---|
| Business Intelligence | Powerful analytics for data exploration and sharing. |
| Secure Environment | Governed and secure data access. |
| Semantic Modeling Layer | Maintains data consistency and accuracy. |
| Data-Driven Decision Making | Informed decisions based on reliable data insights. |
| Operational Efficiency | Optimizes data usage and insights across sectors. |
You get Looker Blocks for pre-built analytics, custom visualizations, and seamless integration with other services. Looker is great for embedded analytics and interactive dashboards.
Some limitations include:
| Limitation | Description |
|---|---|
| Data Blending is Tough | Looker Studio lacks native support for blending data from different sources. |
| UI/UX Hiccups | The interface can be slow with large datasets. |
| Customer Support Challenges | Less responsive support and limited learning resources. |
| Visualization is the Only Core Focus | Focuses on data visualization, but lacks depth in analytics. |
| Real-Time Data Constraints | No support for real-time data integration. |
| GA4 API Quota Limit | Restrictions on data requests when using Google Analytics 4. |
You may notice slow performance with large datasets and limited support. Looker is best for organizations that want embedded analytics and secure dashboards for business intelligence.
Qlik Sense is a dashboard software that offers advanced analytics and interactive dashboards. You can explore data with an associative data model, which helps you find hidden relationships and insights. Qlik Sense supports self-service analytics, so you can build dashboards and reports without IT help.

Website: https://www.qlik.com/us/products/qlik-sense
| Feature | Description |
|---|---|
| Associative Data Model | Flexible, non-linear data exploration for deeper insights. |
| Self-Service Analytics | Create and modify dashboards independently. |
| Data Visualization | Many visualization options for clear data insights. |
| Smart Search | Natural language queries for easy data exploration. |
| Responsive Design | Dashboards optimized for any device. |
| Data Integration | Connects to multiple data sources for unified analysis. |
| Collaboration and Sharing | Share insights and discuss data within the app. |
Qlik Sense uses in-memory data processing for real-time analytics. You can manipulate large datasets instantly and refine your dashboards as you go.
Qlik Sense is a strong choice for embedded analytics, business intelligence, and kpi dashboards.
Domo is a dashboard software built for large organizations. You get dashboards, kpi dashboards, and business reporting with real-time and historical data. Domo helps you improve client experience, streamline business processes, and gain a competitive edge.
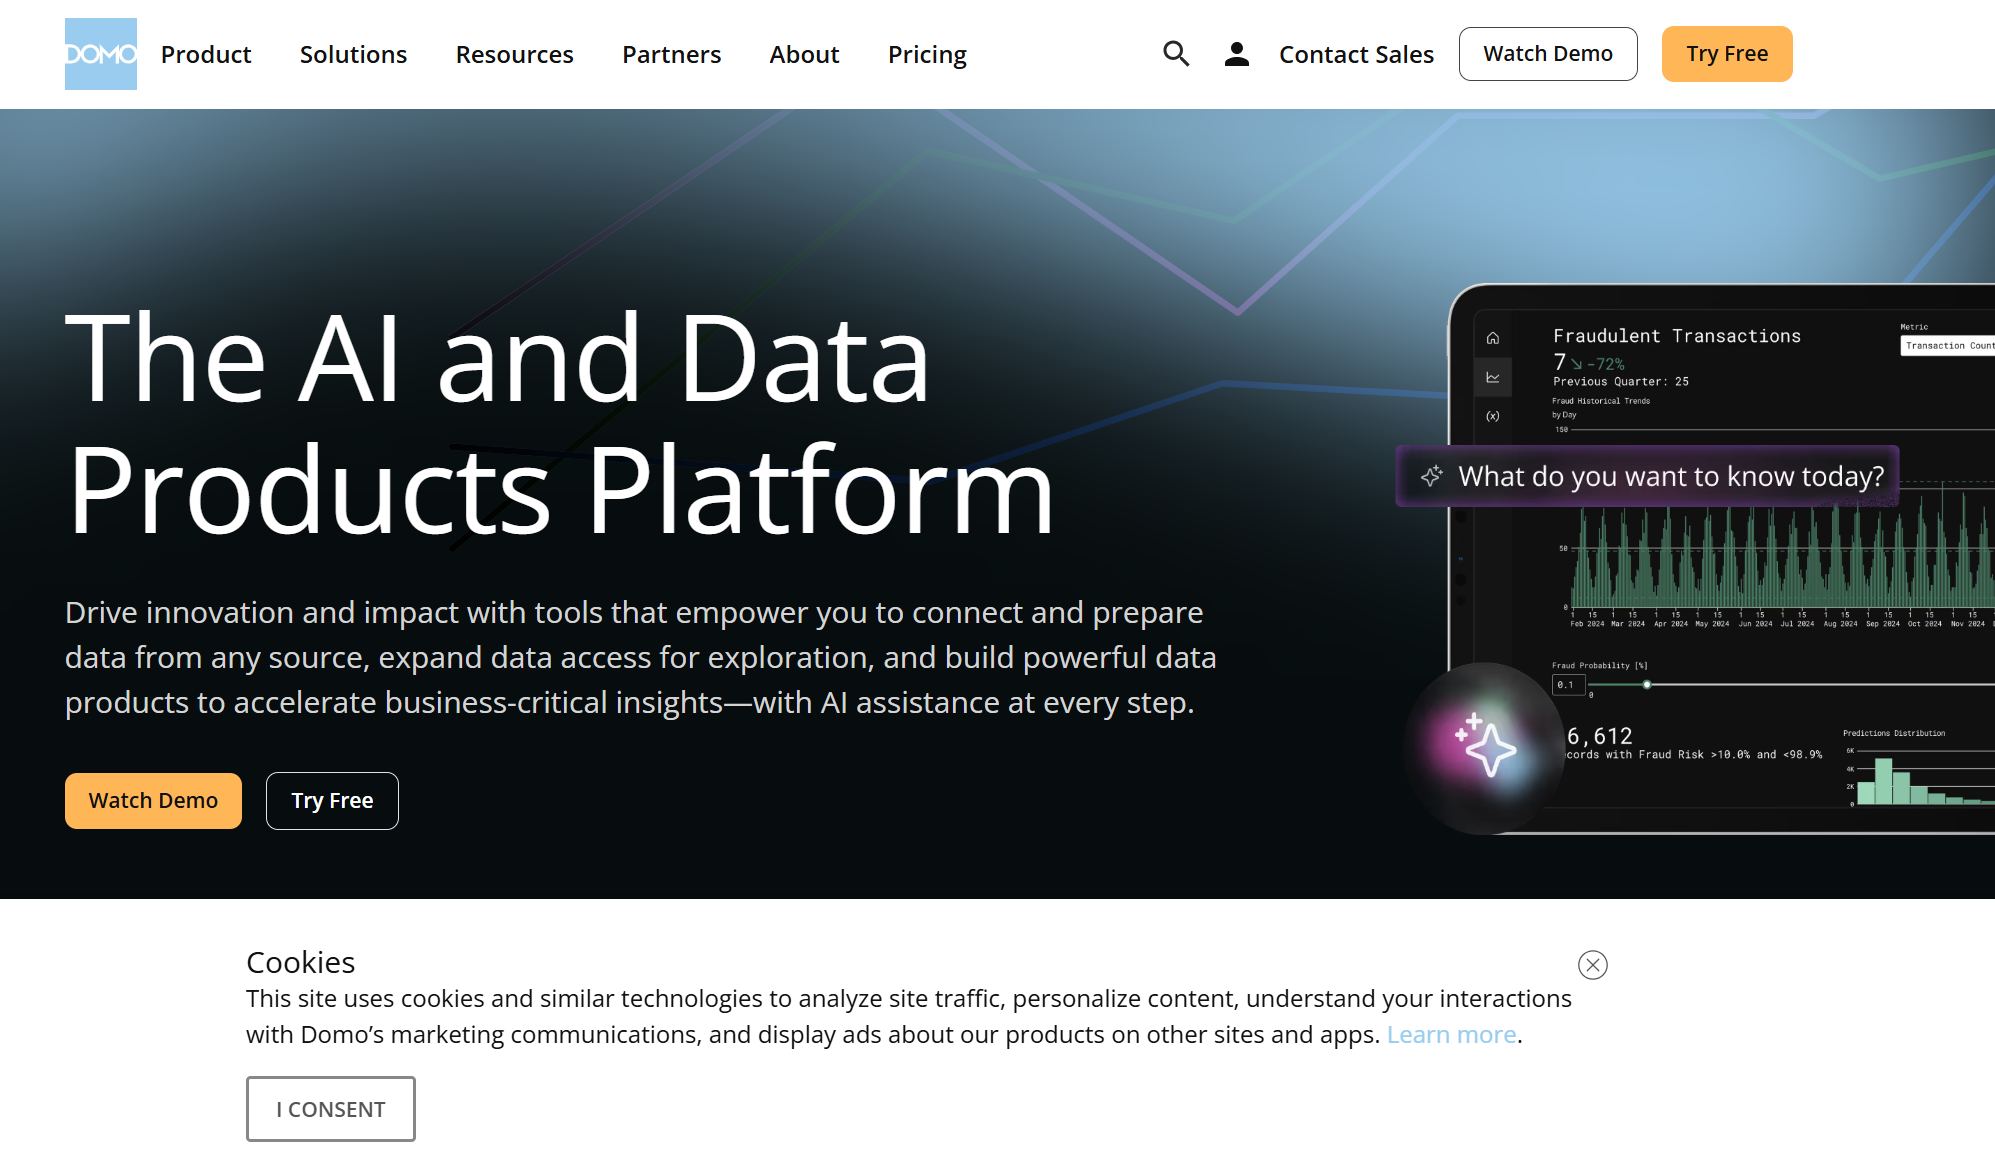
Website: https://www.domo.com/
Domo’s mobile dashboard experience is user-friendly and effective for business teams. You can access dashboards on the go, making it easy to check kpi metrics and business reporting. Domo focuses on embedded analytics and integration with SaaS apps, which is great for marketing and operations teams.
Domo is a top pick if you want the best dashboard software for large-scale embedded analytics and business intelligence.
Sisense is a dashboard software that specializes in embedded analytics. You can integrate dashboards and analytics into your own apps, keeping your brand consistent. Sisense supports connections to many data sources, including traditional warehouses, NoSQL stores, and Hadoop data lakes.

Website: https://www.sisense.com/
| Key Differentiator | Description |
|---|---|
| Seamless Integration | Add analytics to apps while keeping your brand identity. |
| Diverse Data Connections | Connect to warehouses, NoSQL, and Hadoop data lakes. |
| Enhanced User Experiences | Extend analytics to Office 365, Teams, Google Workspace, and Slack. |
Sisense helps you create interactive dashboards and kpi dashboards for business reporting. You get embedded analytics for business intelligence and data-driven decision-making. Sisense is a great choice if you want flexible dashboards and advanced analytics in your own applications.
Note: Sisense’s embedded analytics features make it easy to deliver insights to users wherever they work.
When you start looking for the best dashboard software, you want to focus on what matters most for your business. Here’s a simple table to help you compare the top factors:
| Factor | Description |
|---|---|
| Identify Your Primary Use Case | Decide if you need dashboards for internal monitoring, embedded analytics, or financial reporting. |
| Assess Your Team's Technical Skills | Make sure your team can use the dashboard software easily. |
| Consider Your Data Stack and Scalability | Check if the dashboard software works with your current systems and can grow with your data needs. |
You should also think about how easy it is to use the dashboard, how well it handles data visualization, and if it supports customizable dashboards for your team.
Every business has unique needs. You want dashboard software that matches your goals. Here’s how features align with business needs:
| Feature | Benefit | Business Need Alignment |
|---|---|---|
| Real-time decision making | Enables immediate reaction to trends | Essential for agile business operations |
| Unified view of KPIs | Ensures all team members work from the same data | Improves accountability and collaboration |
| Automation | Reduces time spent on data management | Enhances efficiency in reporting processes |
Dashboards give you quick access to key data. You can make decisions faster and stay agile in a changing market.
You want dashboard software that fits your budget. Some dashboard tools offer flexible pricing for small teams, while others provide enterprise analytics for large organizations. Look for transparent pricing and consider long-term value. Free trials and demos can help you test features before you commit.
Check if the dashboard software connects with your existing data sources. You need smooth integration with databases, cloud services, and business intelligence tools. Compatibility with your current tech stack ensures you get accurate insights and seamless reporting. Good integration means you can use analytics and visualization without extra effort.
Tip: Choose dashboard software that grows with your business and supports your data-driven decision making.

You want dashboard software that brings your data to life. Interactive dashboards let you click, filter, and drill down into details. With the best dashboard software, you can use data visualization tools to create charts, graphs, and maps that respond to your actions. These dashboards help you spot trends and patterns fast. Real-time data visualization means you see updates as they happen, so you never miss important changes. When you use customizable dashboards, you can adjust layouts and colors to match your brand or workflow. Dashboard templates make it easy to get started, saving you time on reporting and analytics.
Real-time dashboards give you instant access to data. You can track sales, monitor operations, and respond to changes right away. Dashboard software with real-time analytics lets you make decisions based on the latest information. You get alerts when something important happens, so you can act quickly. Data visualization tools show you what’s happening now, not just what happened last week. This helps you stay ahead and find new insights. You can use dashboard templates to set up reporting for different teams, making sure everyone gets the data they need.
Customizable dashboards let you build the perfect workspace. You can choose dashboard templates, add widgets, and move things around. The best dashboard software makes it easy for you to create dashboards that fit your needs. You don’t need to be a tech expert. Drag-and-drop features and simple menus help you design dashboards fast. A good dashboard software gives you a smooth experience, whether you’re on your computer or mobile device. You can personalize your dashboards to show the data and analytics that matter most to you.
Security matters more than ever. Dashboard software in 2025 must protect your data and keep you compliant with regulations. You need tools that monitor vendor access and run regular security checks. Strong access controls and user behavior tracking help stop insider threats. Here’s what you should look for:
Proactive compliance measures help you stay ahead of new rules. Automation cuts down on manual errors and boosts efficiency. Real-time monitoring lets you respond to issues right away.
| Feature | Description |
|---|---|
| Centralized Compliance Management | One place for all compliance activities, no more manual trackers. |
| Audit Readiness by Design | Keeps records of policies and approvals, so you’re ready for audits. |
| End-to-End Risk Oversight | Finds and fixes risks with automated checks and real-time dashboards. |
| Streamlined Policy Management | Draft, review, and share policies from one dashboard. |
| Integrated Case & Incident Management | Logs and solves incidents with full visibility, helping with investigations. |
You need dashboard software that helps your team work together. Collaboration tools let you share dashboards, comment on data, and assign tasks. You can send reports to teammates or set up shared dashboards for group projects. Data visualization tools make it easy for everyone to understand the data. With interactive dashboards, your team can explore analytics together and find new insights. Customizable dashboards and dashboard templates help you set up spaces for each department. When everyone has access to the right data, you get better reporting and smarter decisions.
If you work in manufacturing, you know how important it is to keep equipment running smoothly. FineReport gives you a dashboard that tracks OEE (Overall Equipment Effectiveness) in real time. You can see equipment performance, downtime, and production rates at a glance. The dashboard software helps you spot problems fast and make smart decisions. You get visualized data from MES and other systems, so you always know what’s happening on the shop floor.
Tip: Use FineReport’s 3D dashboard to dive deeper into production data and find ways to boost efficiency.
Managing finances can get complicated. FineReport makes it simple with a dashboard that pulls data from multiple sources. You can track budgets, expenses, and revenue in one place. The dashboard software lets you drill down into financial data, so you find trends and spot issues quickly. You can automate reporting and share insights with your team. This helps you make better decisions and keep your business on track.
UnionPay Data Services wanted to improve their credit card business. They used FineReport to unify their data and build a dashboard for revenue analysis. The dashboard helped them identify high-value customers and boost engagement. With better data visualization, they increased system efficiency by 5% and improved customer targeting accuracy to 90%.
TXC Corporation needed a way to make data accessible to everyone. They chose FineReport for its easy-to-use dashboard software. Employees now create their own dashboards and analyze data without IT help. This change improved decision-making and made the company more agile. TXC saw faster reporting and better business insights.
Note: FineReport’s dashboards help you turn complex data into clear, actionable insights. You get the best dashboard software for manufacturing, finance, and risk management.
You’ve seen the top picks for best dashboard software in 2025. FineReport stands out with its flexible dashboards and strong data integration. If you want to turn data into insights, choose dashboard software that matches your business goals. Explore product demos, customer stories, and solution guides. You’ll find the right dashboard to help your team make smarter decisions with data every day.

The Author
Lewis
Senior Data Analyst at FanRuan
Related Articles

How to Build a UAT Dashboard for BI Projects: KPIs, Workflow, and Sign-Off Criteria
Learn how to build a UAT dashboard for BI projects. Track KPIs, manage workflow, and define sign-off criteria to ensure successful releases.
Lewis Chou
May 05, 2026
How to Build a UAT Dashboard for BI Projects: KPIs, Workflow, and Sign-Off Criteria
A uat dashboard gives BI teams one place to control testing progress, $1, defect risk, and stakeholder sign off before release. For IT managers, BI product owners, analytics leads, and operations directors, this is not a
Eric
Jan 01, 1970

Customer Insights Dashboard: What Enterprise Teams Should Track and Why It Matters
Learn what enterprise teams should track in a customer insights dashboard to centralize data, improve decisions, and drive revenue and retention.
Lewis Chou
May 01, 2026


