You now see data as a product when you apply product management principles to datasets. This approach means you focus on quality, usability, and user satisfaction. Data products deliver data for specific business goals and combine sources and interfaces for clear outcomes. When you shift from viewing data as a byproduct to treating it as a valuable asset, you drive better decision-making and measurable value. Adoption of this mindset ensures greater accessibility, quality, and efficiency. FanRuan and FineBI show how real-world adoption leads to business success.
Understanding Data as a Product

What Is Data as a Product
You see data as a product when you treat it as a high-quality, user-focused asset. This approach means you design data products to meet specific needs, making them reliable, accessible, and actionable. You apply product management principles to data initiatives, which requires clear ownership and ongoing improvement. You assign dedicated product owners and conduct user research to understand what consumers need. Feedback loops help you enhance data quality and usability. When you adopt this mindset, you shift from viewing data as a byproduct to recognizing its strategic value. This evolution reflects a move from simple digitization to intelligence-driven decision-making. You now use data to create knowledge, improve customer interactions, and drive innovation.
Data Products vs. Traditional Data Assets
You notice important differences between data products and traditional data assets. Data products amplify business goals by using accurate data for specific tasks. Traditional data assets often lack focus and do not always support enterprise-wide objectives. You benefit from data products because they are designed for usability and measurable value. The table below shows key differences:
| Aspect | Data Products | Traditional Data Assets |
|---|---|---|
| Usability | Built for specific use cases | May not be easily accessible |
| Business Value | Targeted applications, measurable outcomes | Often lacks clear value for business |
You use data products to solve tasks such as customer segmentation or predictive modeling. Traditional data assets may not offer the same level of usability or focus.
Key Characteristics of Data Products
You recognize several essential characteristics that make data products effective. These features support business intelligence and self-service data adoption:
- Purpose-built for end users
- Integration and aggregation of multiple data sources
- Scalability for growing needs
- Real-time processing and analytics
- User-friendly interfaces and visualizations
- Advanced analytics and machine learning capabilities
- Strong data quality and governance
- Security and privacy protections
- Interoperability across systems
- Continuous improvement and innovation
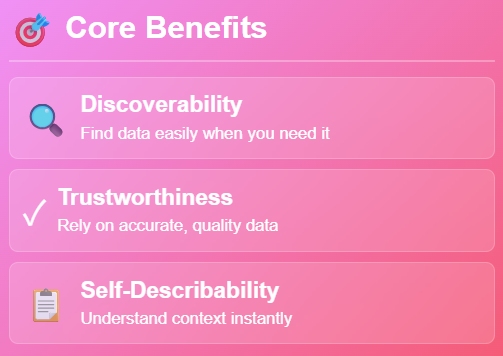
Tip: Data products offer discoverability, trustworthiness, and self-describability. You find data easily, trust its accuracy, and understand its context. These features help you make better decisions and increase the value of your data product development efforts.
The Value of Data Products for Organizations
Business Benefits of Data Products
You gain many advantages when you adopt data as a product in your organization. Data products help you make better decisions, improve collaboration, and increase efficiency. You see improvements in data quality and governance, which leads to more reliable results. When you focus on data product development, you create assets that support innovation and competitive advantage.
You notice that organizations using data products report:
- Better decision-making
- Sustained innovation and competitive advantages
- Improved quality and integrity management
- Increased brand perception and loyalty
- Sustainable scalability
You also experience enhanced collaboration and more effective data management. These benefits help you unlock the value of data and drive business growth.
Here are some key statistics that show how data products impact organizations:
| Statistic | Value | Source |
|---|---|---|
| 89% of business leaders believe data products are crucial for digital transformation | 89% | Harvard Business Review Analytics Services |
| Companies leveraging data-driven insights are 23 times more likely to acquire customers | 23x | McKinsey |
| Companies are six times more likely to retain customers | 6x | McKinsey |
| Companies are 19 times more likely to be profitable | 19x | McKinsey |
| 83% of organizations consider data products essential for digital transformation | 83% | BARC Research |
| Businesses using big data see an 8% increase in profit | 8% | BARC Research |
| 62% of retailers report a competitive advantage from analytics | 62% | BARC Research |
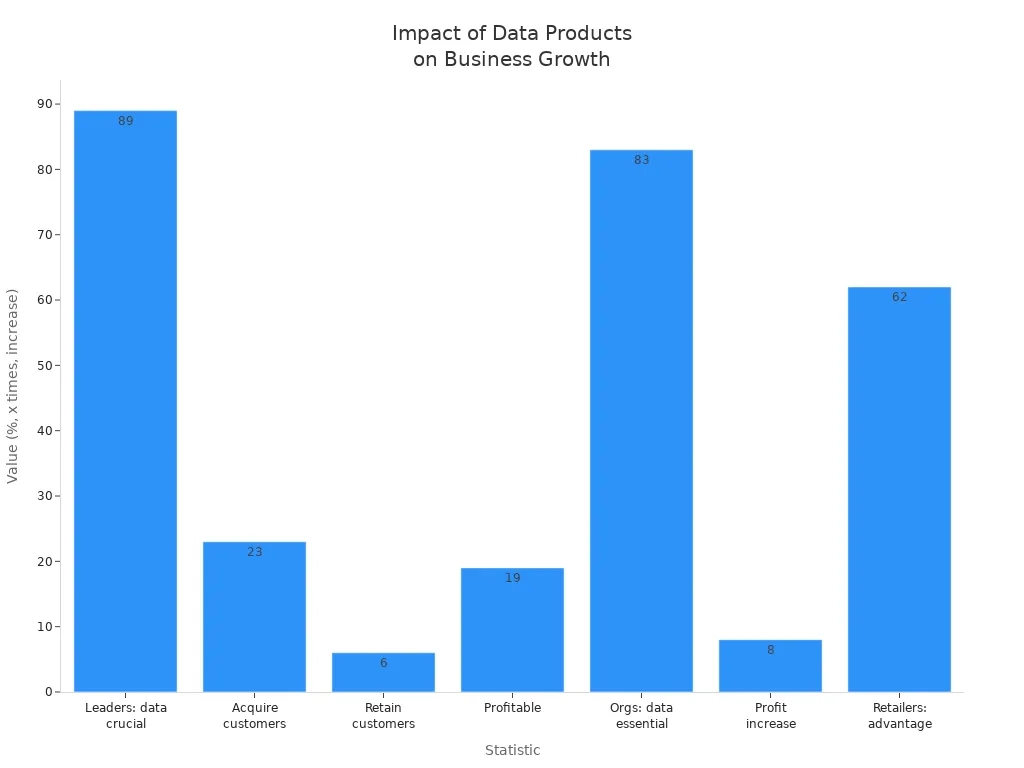
You see that data-driven organizations are 23 times more likely to acquire customers. They are six times as likely to retain customers and 19 times more likely to be profitable. Businesses using big data experience an 8% profit increase and a 10% reduction in costs. Most business leaders believe that data products are essential for digital transformation.
You use data products to reduce uncertainty and minimize risks. Data-driven decision-making helps you identify bottlenecks and streamline workflows. You foster transparency and accountability by tying decisions to specific metrics. Data sharpens your strategic focus and improves agility, allowing you to respond quickly to market changes.
Real-World Impact with FanRuan and FineBI
You see real-world impact when you use FanRuan and FineBI for your data product initiatives. FanRuan provides a comprehensive suite of data analytics and business intelligence solutions. FineBI empowers you to connect, analyze, and share data across your organization. You benefit from self-service data exploration, real-time analytics, and actionable insights.
FanRuan helps you integrate data from multiple sources, ensuring high data quality and consistency. You use FineBI to create interactive dashboards and reports. These tools support your data product development and help you unlock the value of data. You track key performance indicators, identify trends, and predict future outcomes.
You improve operational efficiency and revenue generation by using data products. You can measure the impact in several ways:
| Value Category | Description |
|---|---|
| Revenue Generation | Direct tracking of revenue increases attributable to data product usage and insights |
| Cost Reduction | Quantified savings from process automation, improved decision-making, and operational efficiency |
| Productivity Enhancement | Measurement of time savings, workflow improvements, and resource optimization |
You establish a baseline for performance metrics before adoption. You use attribution modeling to isolate the impact of data products. You assess value realization regularly and calculate return on investment. You also explore external data monetization by sharing data assets with partners and customers.
You see examples from leading companies. Walmart uses data-driven inventory management to reduce waste by 30% and increase profit margins by 15%. Netflix uses viewer behavior data to maintain a 93% retention rate and save $1 billion annually. These cases show how data as a product leads to data product success.
Customer Success Story: BOE Technology Group
You can learn from BOE Technology Group, a global leader in the IoT and semiconductor display industry. BOE faced challenges with fragmented data, inconsistent metric definitions, and limited data utilization. You see how BOE adopted FineBI to build a unified data warehouse and standardize metrics.

BOE completed over 200 model designs to automate data integration. You notice that they unified 257 metrics across different domains. BOE developed a comprehensive metric system and analytical framework using tools like the Balanced Scorecard. You see how KPI dashboards and cross-factory benchmarking enabled real-time monitoring and analysis.

The results speak for themselves:
- BOE reduced inventory costs by 5%.
- Operational efficiency increased by 50%.
- KPI dashboards enabled centralized monitoring and early risk identification.
- Cross-factory benchmarking helped identify gaps and opportunities.
You see that BOE accelerated its digital transformation and improved decision-making efficiency. The company now plans to optimize data analysis tools and explore new technologies like artificial intelligence and big data analytics. You can read more about BOE's journey here.
Tip: When you adopt data as a product and use solutions like FanRuan and FineBI, you unlock the value of data and drive measurable business outcomes. You empower your teams to create actionable insights and achieve data product success.
Building Effective Data Products with FineBI

Essential Components and Best Practices
You build effective data products with FineBI by focusing on several key components. FineBI helps you turn raw data into valuable insights through interactive dashboards and visualizations. You use visual components like tables and charts to display information clearly. Aggregation functions let you summarize data for quick analysis. Filter components allow you to focus on specific data points. Linkage and drill functionality enable you to explore data from different angles. FineBI’s data platform supports complex data processing and synchronization across databases, making data product development more efficient.
Tip: Always design your data products with the end user in mind. User-centric design leads to higher satisfaction and better adoption.
Here are best practices you should follow when designing data products with FineBI:
| Best Practice | Description |
|---|---|
| Define SLOs | Service Level Objectives guide your architecture and implementation. |
| Establish Ownership | Consistent blueprints make it easier to transfer product ownership. |
| Automate Governance | Automation ensures your data products meet organization-wide standards. |
Implementation Strategies Using FineBI
You achieve data product success by following proven strategies. Start by understanding user needs and defining clear goals for your data product development. Ensure data quality by gathering and preparing clean, structured data. Test and validate your data models before launching. Ongoing monitoring helps you track usage and business needs, allowing you to update your products quickly.
You foster a data-driven culture by encouraging everyone to use data in decision-making. Provide training and support so users can leverage FineBI’s features effectively. Invest in the right tools and technologies to facilitate data collection, analysis, and visualization. Establish robust data governance practices to maintain accuracy and reliability.
| Strategy | Description |
|---|---|
| Understand User Needs | Design data products for reusability and actionability. |
| Ensure Data Quality | Maintain accuracy, completeness, and timeliness for reliable insights. |
| Foster a Data-Driven Culture | Promote transparency and open communication about data insights. |
| Provide Training and Support | Educate users to maximize the value of BI initiatives. |

Overcoming Common Challenges
You may face challenges during data product development and deployment. Without strong data infrastructure, you risk delays and higher costs. FineBI and FanRuan solutions help you overcome these obstacles by providing a cloud-based environment for efficient data storage and processing. You avoid roadblocks in idea generation by fostering collaboration and encouraging participation from all team members.

Data quality and integrity remain critical. You must ensure your data is accurate, consistent, and reliable. FineBI’s automated governance and monitoring tools help you maintain high standards. As your data products grow, scaling them without losing performance becomes complex. FineBI’s robust infrastructure supports expansion and keeps your data models running smoothly.
FanRuan solutions deliver measurable improvements. You close monthly reports in 2.3 days instead of 14. Decision-making speed increases by 40%. Total costs over three years drop by 41%. Fraud detection response time falls to under one hour. These results show how you can achieve data product success with the right tools and strategies.
Note: Continuous optimization and user feedback are essential for long-term success in data product development.
You drive success when you adopt a data as a product mindset. Organizations like Mayo Clinic and Netflix show how data adoption leads to better outcomes and cost savings. FineBI help you unlock data value by offering self-service analysis, flexible processing, and scalable computing. You can start by defining your goals, building cross-functional teams, and setting measurable milestones. Use feedback and analytics to refine your approach. Continuous improvement means you monitor metrics and use data-driven insights to stay competitive.
| Feature | Description |
|---|---|
| Self-Service BI | Empowers you to analyze and act on data independently. |
| Data Source Connectivity | Connects to many sources for comprehensive analysis. |
Tip: Collect small wins and share insights to encourage ongoing data adoption.


FAQ

The Author
Lewis
Senior Data Analyst at FanRuan
Related Articles

What Recruiters Look for in a Data Analysis Portfolio: 10 Criteria to Score Yours Fast
A $1 is not judged like a school assignment. It is judged like a hiring shortcut. Recruiters, hiring managers, and analytics leads use it to answer one question fast: Can this person solve business problems with data in
Lewis Chou
May 29, 2026

What Is Data Analytics Consulting? Beginner’s Guide to Services, Deliverables, and Business Value
$1 helps organizations turn raw data into decisions they can trust. For many business leaders, the challenge is not a lack of data. It is a lack of clarity. Reports conflict, teams track different KPIs, dashboards are un
Lewis Chou
Jun 03, 2026

Data Analyst Job Description [+2026 Guide]: Compare Responsibilities, Skills, and Salary by Industry
A strong $1 does more than list tasks. It defines how a company turns raw data into business decisions, which teams the analyst supports, and what measurable outcomes the role is expected to influence. For employers, tha
Lewis Chou
Jun 02, 2026