The Best Self-Service Tools for Analytics include FineBI, Tableau, Power BI, Qlik Sense, Looker, and more. These self-service tools give business users direct data access, transforming how you analyze information and drive results. You can now explore trends and create dashboards without waiting for IT support.
| Impact Area | Description |
|---|---|
| Decision-Making Speed | Self-service tools give you immediate data access, reducing the time to turn insights into action. |
| IT Resource Allocation | Business users gain independence, so IT teams can focus on strategic projects. |
You should consider how these tools fit your own data access needs.
You have many options when searching for the best self-service analytics tools. The market leaders include:
These tools help business users access data, create dashboards, and analyze trends without waiting for IT support. You can choose a tool that matches your company’s size, industry, and technical needs.
You want to know why these solutions stand out. The best self-service analytics tools lead the market because they meet the needs of business users in several ways:
When you use these tools, you empower business users to make faster, smarter decisions. You also reduce the burden on IT teams and help your organization become more data-driven.
You need to understand what sets self-service analytics tools apart. These platforms give business users the power to access and analyze data without waiting for IT support. You can explore information, create reports, and share insights on your own. The main features that define these tools include:
| Characteristic | Description |
|---|---|
| Ease-of-use | Enables fast access to data with a simple interface, enhancing productivity and decision-making. |
| Scalability | Adapts to growing business needs, handling more users and data without compromising performance. |
| Flexibility | Allows users to create customized reports independently, fostering a data-driven culture. |
| Security | Ensures strong data protection measures are in place to prevent unauthorized access. |
Self-service tools also differ from traditional analytics platforms. You gain high autonomy, which means you can analyze data and generate reports without IT involvement. This independence leads to faster insights and more efficient workflows.
You see the impact of self-service analytics tools in many organizations. These tools simplify data access for business users, making it easier to find answers and act quickly. Research shows that when you equip frontline workers with these solutions, you improve customer and employee satisfaction, as well as product quality.
Consider these benefits:
A table below highlights the business value:
| Benefit | Description |
|---|---|
| Enhanced Data Accuracy | Ensures users access the same version of critical data, improving collaboration and productivity. |
| Increased Efficiency | Reduces reliance on disparate data sources, streamlining decision-making processes. |
| Democratization of Access | Allows all users to access reliable data, fostering a data-driven culture within the organization. |
You empower your team when you choose self-service tools. You give business users the ability to make informed decisions, which drives better outcomes for your company.

When you compare the best self-service analytics tools, you want to see how each one supports business users in their daily work. The table below highlights the most important features you should consider. These include usability, data access integration, visualization options, AI capabilities, and governance.
| Tool | Usability | Data Access Integration | Visualization | AI Capabilities | Governance & Security |
|---|---|---|---|---|---|
| FineBI | Zero-code, intuitive | 60+ connectors, strong ETL | Drag-and-drop, rich | Conversational AI, | Row-level security, |
| interface for business | (databases, files, APIs) | dashboards, 60+ charts | predictive analytics | audit logs, compliance | |
| Tableau | Visual, easy to learn | Many connectors, strong API | Advanced, interactive | Some AI, forecasting | Role-based permissions |
| Power BI | Familiar, user-friendly | Deep Microsoft integration | Custom visuals, | AI insights, natural | Data loss prevention, |
| for Microsoft users | (Excel, Azure, SQL) | real-time dashboards | language queries | row-level security | |
| Qlik Sense | Associative, flexible | Broad data source support | Interactive, responsive | AI-powered suggestions | Centralized governance |
| Looker | Modern, web-based | Strong cloud integration | Clean, web dashboards | Embedded analytics | Data modeling, access |
| (BigQuery, Redshift, etc.) | controls |
Tip: When you evaluate analytics tools, focus on how easily business users can access data, create dashboards, and share insights. Look for tools that offer intuitive interfaces, trusted connectors, and secure data access.
You want to choose the best self-service analytics tool for your needs. Each platform has unique strengths and some limitations. Here is a quick overview to help you decide:
You should always match the tool’s strengths to your business users’ needs. Consider how each platform supports data access, visualization, and secure sharing as you search for the best self-service analytics solution.

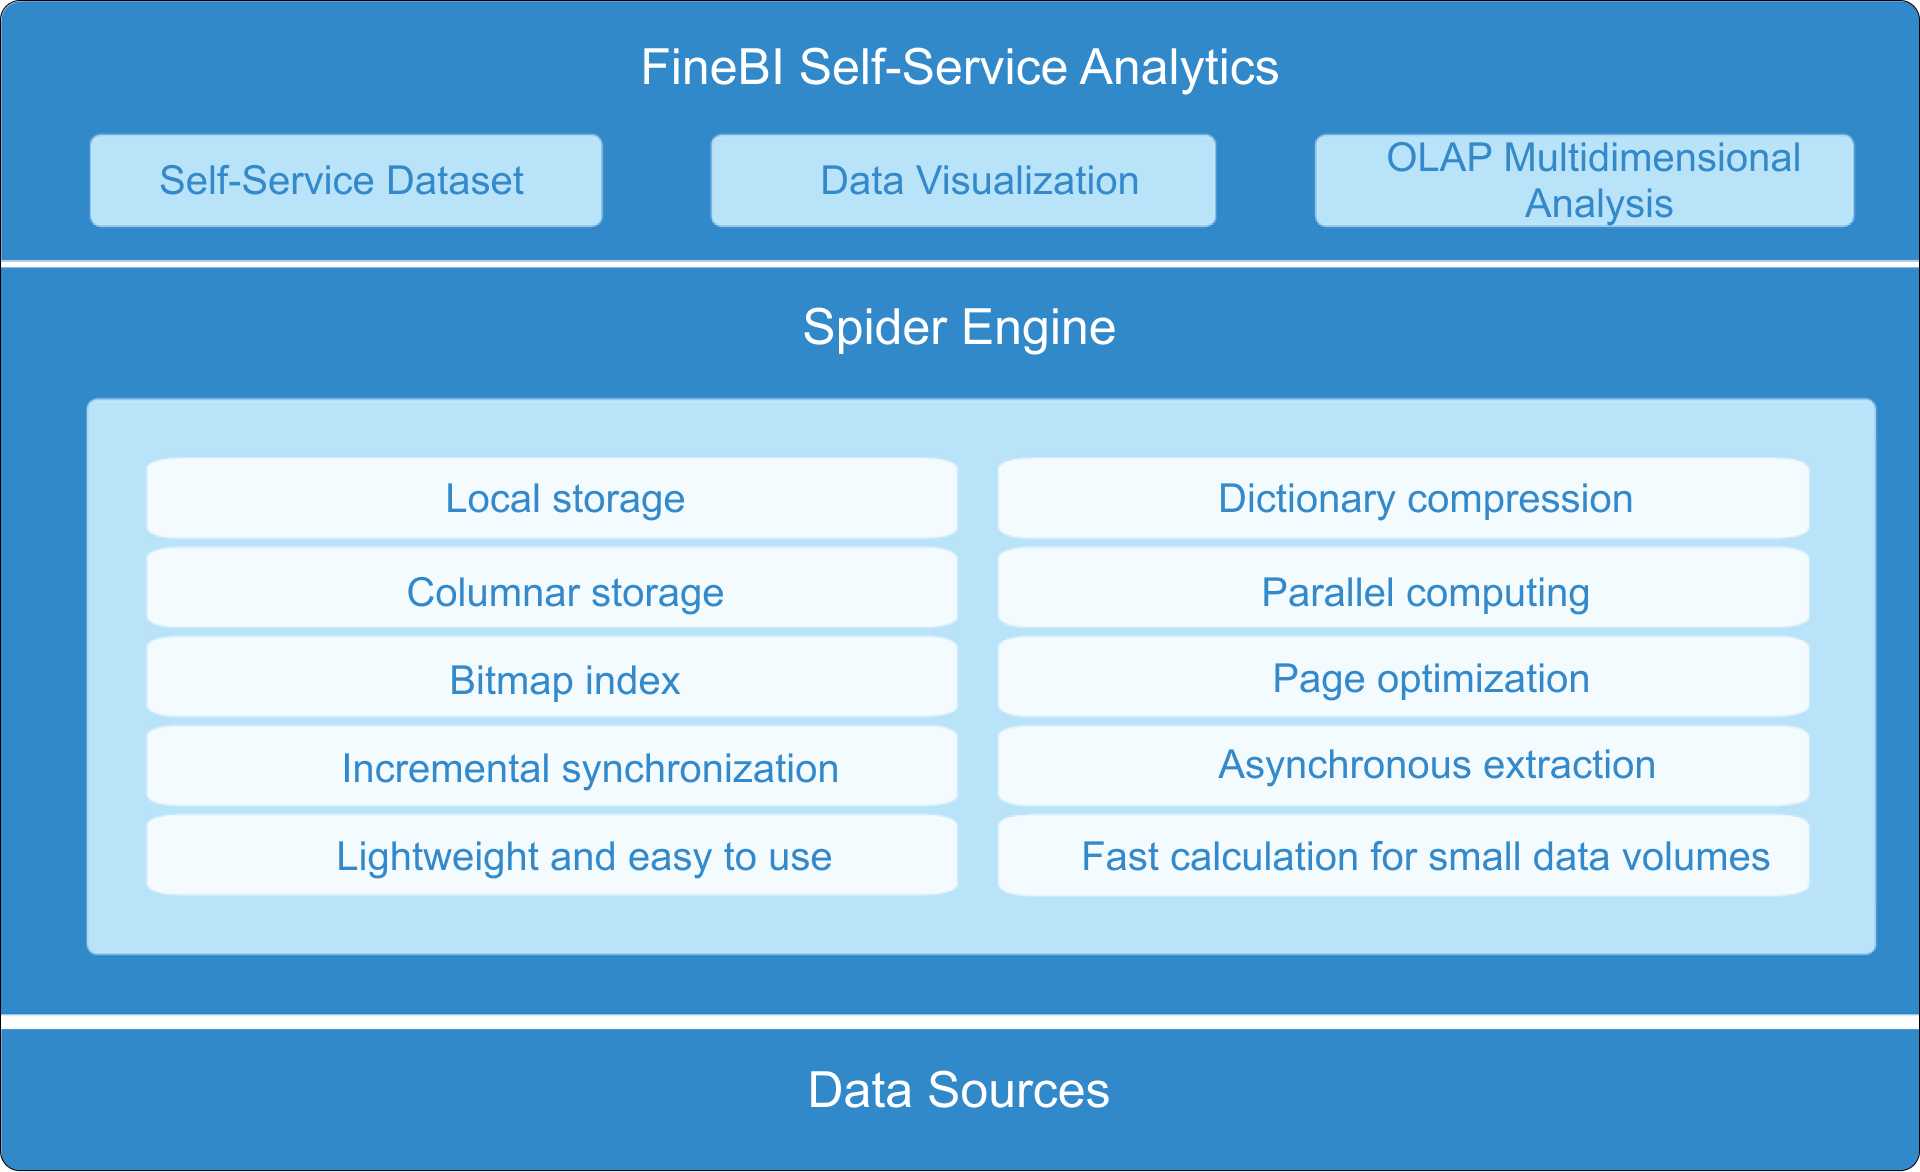
FineBI stands out among self-service analytics tools for its focus on empowering business users with direct data access and advanced analytics. You can use FineBI’s drag-and-drop interface to create dashboards and reports without writing code. The platform supports over 60 data connectors, including databases, files, and APIs, making it easy for you to unify information from different sources.
FineBI’s workflow covers every step you need for analytics. You start by connecting to your data sources. The integrated ETL tools help you prepare and clean your data, so you can trust your results. You can then build visualizations using a wide variety of charts and tables. FineBI’s in-memory computing engine ensures fast response times, even with large datasets. You can access your dashboards on any device, including mobile, which means you always have insights at your fingertips.
Security is a top priority in FineBI. You can set role-based access control, row-level security, and audit logs to protect sensitive information. The platform also supports single sign-on for easy and secure user management. FineBI’s scalability allows your analytics environment to grow with your business, supporting both small teams and large enterprises.
The table below summarizes FineBI’s key strengths:
| Feature | Description |
|---|---|
| User-Friendly Interface | Drag-and-drop GUI lets you create complex visualizations without coding. |
| Real-Time Data Processing | Enables real-time updates and processing for timely insights. |
| Integrated ETL Tools | Seamlessly prepares and cleans data within the platform. |
| Mobile App Support | Access insights anytime, anywhere, with a consistent experience across devices. |
| Scalability | Grows with your business, supporting expanding analytics needs. |
| In-Memory Computing Engine | Handles large data volumes efficiently for fast queries. |
| Enterprise-Grade Security | Role-based access, row-level security, single sign-on, and audit logging for strong governance. |
You also benefit from FineBI’s strong localization, which supports Asian languages and regional data formats. The platform offers competitive pricing, making it accessible for mid-sized organizations. FineBI’s self-service approach means you can explore data and generate insights independently, reducing your reliance on IT teams.
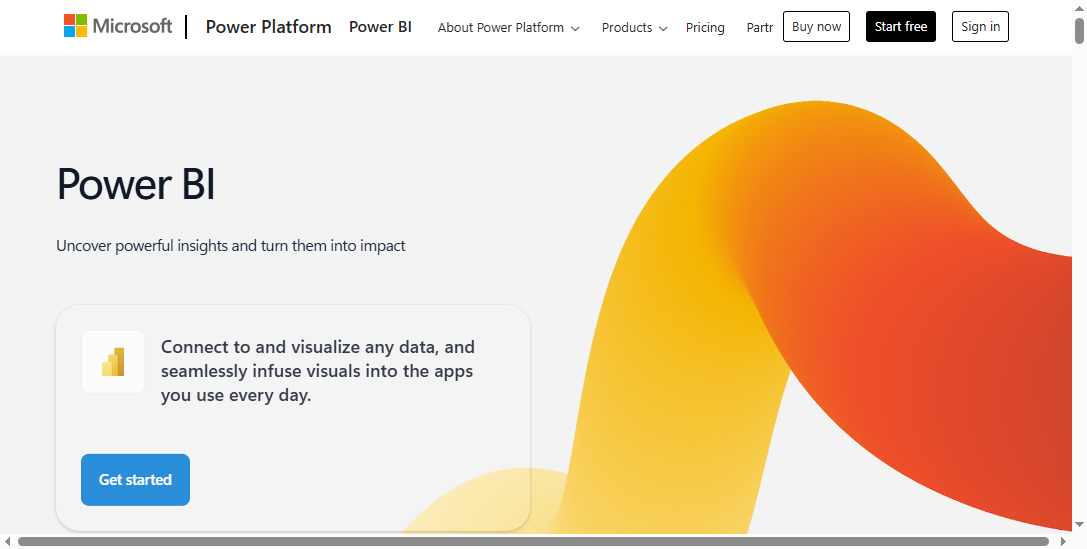
Microsoft Power BI is a popular choice for organizations that need robust data access and integration with Microsoft products. You can connect Power BI to a wide range of data sources, including Excel, Azure, and SQL databases. The platform offers interactive dashboards and reports, which help you visualize trends and share insights with your team.
Power BI’s main advantages include a user-friendly interface, affordable pricing, and strong self-service functionality. You can start with a free version, which is helpful for small businesses. The platform supports centralized data models, role-based access control, and audit logs, which enhance governance and security for enterprise users.
| Advantages | Drawbacks |
|---|---|
| User-friendly interface | Challenges with complex data modeling |
| Strong data source support | Limited compatibility on non-Windows platforms |
| Affordable pricing | Dataset size constraints |
| Interactive content | Confusing licensing structure |
| Self-service functionality | Limited localization and language support |
You may find the interface bulky at times, and the formula language (DAX) can be challenging for new users. Power BI also has some limitations in handling very large datasets, especially in the free version. However, its integration with Microsoft Entra ID, data loss prevention policies, and secure sharing features make it a solid choice for organizations focused on governance.

Tableau is known for its leadership in data visualization. You can use Tableau to create interactive dashboards that highlight key metrics and trends. The platform supports self-service analytics, allowing business users to analyze data without a technical background. Tableau’s predictive analytics features help you identify future trends and make proactive decisions.
| Feature | Description |
|---|---|
| Interactive Dashboards | Create customized dashboards for quick insights. |
| Self-Service Analytics | Empower all employees to analyze data independently. |
| Predictive Analytics | Identify trends and make proactive decisions. |
| Cloud-Based Analytics | Access data anytime, anywhere for real-time collaboration. |
| Data Governance | Protect data and ensure compliance. |
| Data Integration and Transformation | Merge data from various sources for comprehensive analysis. |
You may encounter some challenges with Tableau. The platform’s premium pricing can be a barrier for large deployments. While basic visualizations are easy to create, advanced features require more training. Governance can become complex if you do not manage dashboards and metrics carefully. Tableau Prep, the data preparation tool, is improving but may not match dedicated ETL solutions for complex tasks.
Qlik Sense offers a unique approach to data access with its associative analytics engine. You can explore data in any direction, selecting elements and instantly seeing related information while unrelated details fade into the background. This associative logic helps you uncover patterns and trends without needing technical expertise.
You may face challenges when migrating from other platforms, as data modeling and transformation logic often need to be redesigned. Users sometimes report confusion due to an overabundance of dashboards and inconsistent metrics. Performance issues can arise with very large datasets, so you should plan your deployment carefully.

Looker positions itself as a modern data platform with strong integration and scalability. You can connect Looker to various data sources, including all major cloud data hosting platforms. The platform is designed to scale with your organization’s growing data needs.
| Feature | Description |
|---|---|
| Integration | Seamlessly connects with various data sources and cloud platforms. |
| Scalability | Accommodates expanding data requirements effectively. |
You may find that Looker requires more manual effort for report preparation and sharing. The platform can face scalability issues if too many automated schedulers run at once. Some users report limited options for slicing and dicing data in generic reports. Drill-down functionality needs explicit field definitions, which can limit flexibility for end users. Developers often need to write custom code to enhance features, which increases complexity.
Several other self-service analytics tools are gaining attention. You may want to explore these options based on your organization’s needs:
You can choose from these tools to match your data access requirements, business user needs, and analytics goals. Each platform offers unique features that support different use cases, so you should evaluate them based on your organization’s priorities.
You need to focus on several important factors when selecting the Best Self-Service Tools for Analytics. The right choice will help business users gain value from data access and analytics. Use the table below to compare the most critical criteria:
| Evaluation Criteria | Description |
|---|---|
| User-friendliness | Platforms should have natural-language querying and user-friendly interfaces for quick insights. |
| Security and Data Governance | Look for features like SOC 2 Type II compliance and role-based access controls. |
| Integration Capabilities | Assess compatibility with existing data infrastructure to save time and effort. |
| Total Cost of Ownership | Consider the complete cost structure, including implementation and training. |
| Simplification of Data Preparation | Tools that simplify data preparation can significantly reduce time spent on analytics projects. |
You should also consider cost and scalability. Many self-service tools offer subscription-based pricing, which lowers your initial investment. These platforms require less IT support, so you save on operational costs. You can scale these tools quickly as your organization grows, especially with cloud-based options. When business users generate their own reports, you reduce the need for specialized analysts and free up IT resources for strategic work.
You should match the Best Self-Service Tools for Analytics to your specific business needs. Start by identifying the most important data-driven processes in your organization. Work with business users to review and select the right platform. Begin with simple use cases that show quick results. As your team gains confidence, introduce more advanced analytics features.
Encourage business users to experiment with different types of analysis. Identify any gaps in your data and ensure your information is accurate and ready for use. Plan for future growth by preparing your infrastructure for more users and larger data sets. Set clear data standards and promote a culture of exploration. Always make security, privacy, and compliance a priority. Understand the limits of self-service tools so you can set realistic expectations for your team.
Tip: Involve business users early in the selection process. Their feedback will help you choose a tool that fits your company’s workflow and goals.


When you adopt the Best Self-Service Tools for Analytics, you may face several obstacles. Many organizations struggle with data governance, user adoption, technical limitations, and security. You need to address these challenges early to ensure a smooth rollout.
| Challenge Type | Description |
|---|---|
| Data Governance and Quality Issues | Maintaining data quality and governance is crucial when multiple users access and manipulate data. |
| User Adoption and Data Literacy | Resistance to new tools and varying levels of data skills can hinder effective use of analytics. |
| Technical Challenges | As data grows, organizations face scalability and performance issues that need to be addressed. |
| Security and Compliance Obstacles | Ensuring data security and compliance with regulations is essential in self-service analytics. |
You can overcome these barriers by following proven best practices:
Tip: Start with small, high-impact projects to show value quickly and build momentum for broader adoption.
You can unlock the full potential of the Best Self-Service Tools for Analytics by integrating them into your daily operations. When you empower users with direct data access, you reduce bottlenecks and accelerate time-to-insight. This approach helps your organization respond faster to changing business needs.
A real-world example shows how a healthcare analytics team reduced hospital stays by 33% after deploying self-service analytics. Analysts focused on high-value tasks while clinical teams accessed real-world data directly. This shift improved efficiency and quality.
To maximize value, you should:
You should also track your progress. Use these metrics to measure success:
| Metric Category | Metrics |
|---|---|
| Adoption Metrics | Active Users, Query Volume, User Diversity, Champion Network |
| Impact Metrics | Time to Insight, IT Ticket Reduction, Decision Velocity, ROI |
| Quality Metrics | Data Quality Score, User Satisfaction, Dashboard Utilization, Support Ticket Trends |
| Governance Metrics | Policy Compliance, Security Incidents, Certification Coverage, Metric Consistency |
By following these best practices, you ensure that your investment in the Best Self-Service Tools for Analytics delivers measurable results and supports a data-driven culture.
You have explored the Best Self-Service Tools for Analytics, including FineBI, Tableau, Power BI, Qlik Sense, and Looker. FineBI stands out for its zero-code interface, strong governance, and advanced analytics. When choosing a tool, consider user skills, tool capabilities, training needs, and governance. Free trials and demos help you compare features:
| Tool | Free Trial Duration | Additional Features |
|---|---|---|
| Power BI | 30 days | Free training resources |
| Tableau | 30 days | Comprehensive analytics with CRM |
| Qlik Sense | 30 days | Demo available |
After selection, follow these steps for success:
Like choosing a checkout lane, your decision depends on your needs and readiness. Start with training and support for your team.

How to Do Retention Analysis for Business Success
What is Pareto Chart and How Does it Work
How DuPont Analysis Helps You Understand Your Business

The Author
Lewis
Senior Data Analyst at FanRuan
Related Articles
Data Analyst Dashboard: A Scenario-Based Guide to KPI Views That Drive Better Business Decisions
Learn how data analyst dashboards turn raw data into actionable KPI views for operational, analytical, and strategic decisions. Drive better business outcomes.
Lewis Chou
May 03, 2026

Self-Service Analytics Defined and Why You Need It
Self-service analytics lets you analyze data without IT help, empowering faster, data-driven decisions and boosting agility for your business.
Lewis
Jan 04, 2026

Understanding Predictive Analytics Services in 2026
Predictive analytics services use data and AI to forecast trends, helping businesses make informed decisions, reduce risks, and improve efficiency in 2026.
Lewis
Dec 30, 2025


