Distribution analysis in mathematics and statistics examines how values spread across a dataset, helping you understand patterns and predict outcomes. You gain clearer insights by recognizing the type of distribution present, which improves accuracy in interpreting data.
Evidence
Explanation
Distribution analysis helps identify how values are spread across a dataset.
Accurate predictions and decisions become possible.
Recognizing the type of distribution fits your dataset.
Interpreting data and forecasting trends gets easier.
Consider rolling a die as a simple example:
Each face has an equal probability (1/6).
Probability of rolling an even number (2, 4, 6) is 1/2.
Probability of rolling a sum of 10 with two dice is 1/12.
Modern tools like FineBIallow you to visualize and analyze statistical distributions with advanced components, flexible dashboards, and a variety of chart types. You can apply distribution analysis to improve business decisions and everyday problem-solving.
Distribution Analysis Explained
What Are Distributions?
Distribution analysis in mathematics and statistics helps you understand how values are spread across a dataset. You use this approach to identify patterns and make predictions based on statistical data distribution. Distributions describe the likelihood of different outcomes in a random experiment or real-world scenario. You encounter distributions in many areas, from scientific research to business forecasting.
A distribution refers to the way data points or outcomes are arranged. You can classify distributions into two main types: discrete and continuous. Discrete distributions involve countable outcomes, such as the number of heads when flipping coins. Continuous distributions cover outcomes that can take any value within a range, like the height of students in a class.
Here is a table that summarizes the types of statistical distributions you will often see:
Type of Distribution
Description
Examples
Discrete Distribution
Used when data can take only certain separate values, countable.
Binomial, Poisson
Continuous Distribution
Used when data can take any value within a range, including fractions.
Normal, Exponential
You work with several common statistical distributions in mathematics and statistics. Each type has unique properties and applications:
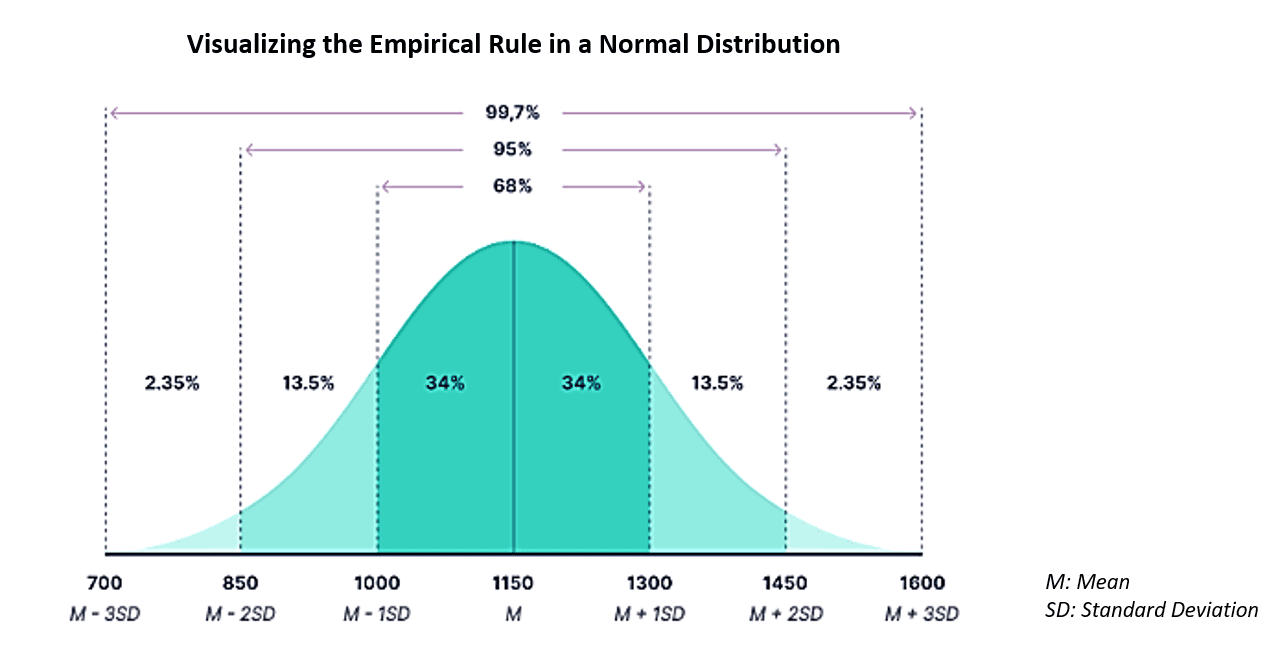
Normal distribution: Most data points cluster around the mean, forming a symmetrical bell-shaped curve.
Binomial distribution: You use this for experiments with two possible outcomes, such as success or failure.
Poisson distribution: This models random events that occur over a fixed interval, like the number of emails received in an hour.
Exponential distribution: You apply this to measure the time between events, such as waiting for a bus.
Uniform distribution: Every outcome has an equal chance, like rolling a fair die.
Student’s T-distribution: This resembles the normal distribution but has heavier tails, making it useful for small sample sizes.
You define a probability distribution as a description of the probabilities of events within a sample space. Discrete distributions use a probability mass function to assign probabilities to distinct outcomes. Continuous distributions use a probability density function, which describes the density of outcomes over a range. You also use the cumulative distribution function to measure the probability that a variable falls below a certain value.
You distinguish between theoretical and empirical distributions. Theoretical distributions rely on mathematical models and assumptions. Empirical distributions come from actual observed data, reflecting real outcomes.
Type of Distribution
Description
Theoretical Distribution
Based on theoretical models and assumptions about the data.
Empirical Distribution
Derived from actual observed data, reflecting real outcomes.
You use random variables to quantify outcomes in probability experiments. A random variable links the abstract concept of randomness to numerical values, allowing you to perform statistical analysis.
Why Distribution Analysis Matters
Distribution analysis gives you the tools to interpret statistical data distribution accurately. You identify patterns and predict trends by examining how data points are spread. This process provides a solid foundation for making strategic decisions based on concrete evidence.
Distribution analysis helps you spot patterns in data.
You use it to predict future trends.
It supports objective decision-making with reliable evidence.
Ignoring distribution analysis can lead to serious consequences. You risk making decisions based on random chance rather than factual evidence. This oversight can result in false positives, wasted resources, and compromised research integrity. In fields like medicine and finance, neglecting statistical significance may cause ethical dilemmas and risky investments.
Erroneous conclusions affect decision-making in critical fields.
Decisions based on random chance can have severe implications.
False positives waste resources and mislead future research.
Research integrity suffers, eroding trust in scientific findings.
Biased conclusions may lead to unequal treatment and resource distribution.
You validate the accuracy of distribution analysis by following several steps:
Understand and profile your data.
Validate data types and field formats.
Detect and manage missing data.
Identify and treat outliers.
Remove duplicate records.
Standardize and normalize data for consistency.
Verify data consistency and integrity.
Automate validation and cleaning processes.
Use sampling and parallel processing for scalability.
Document cleaning steps for transparency.
Distribution analysis in mathematics and statistics forms the backbone of statistical analysis. You rely on it to interpret statistical distributions, apply the probability density function and cumulative distribution function, and work with normal distribution and other types of statistical distributions. You use these concepts to analyze data, make predictions, and support decision-making in science, business, and everyday life.
Statistical Distribution Analysis in Practice
Probability and Outcomes
You use probability theory to understand how distributions work in practical scenarios. A probability distribution shows the likelihood of different outcomes in an experiment. This concept is essential in both probability theory and statistics. You rely on probability distributions to analyze scientific data and make predictions about future events.
Consider rolling a die. Each face has an equal chance of appearing, which means you observe a uniform distribution. You see the probabilities for each outcome in the table below:
Outcome
Probability
1
1/6
2
1/6
3
1/6
4
1/6
5
1/6
6
1/6
When you roll two dice, the probability distribution changes. For example, the sum of 7 appears more often than other sums. You use these distributions to describe and predict the likelihood of events. Selecting the correct distribution, such as the normal distribution for continuous data, allows you to model outcomes effectively.
Real-World Examples
You encounter statistical distributions in many fields. In science, you model the distribution of coal particle size using lognormal and GB2 distributions to optimize simulations. In finance, you analyze the distribution of stock prices to assess expected returns and risks. The normal distribution plays a key role in these analyses, helping you forecast trends and make informed decisions.
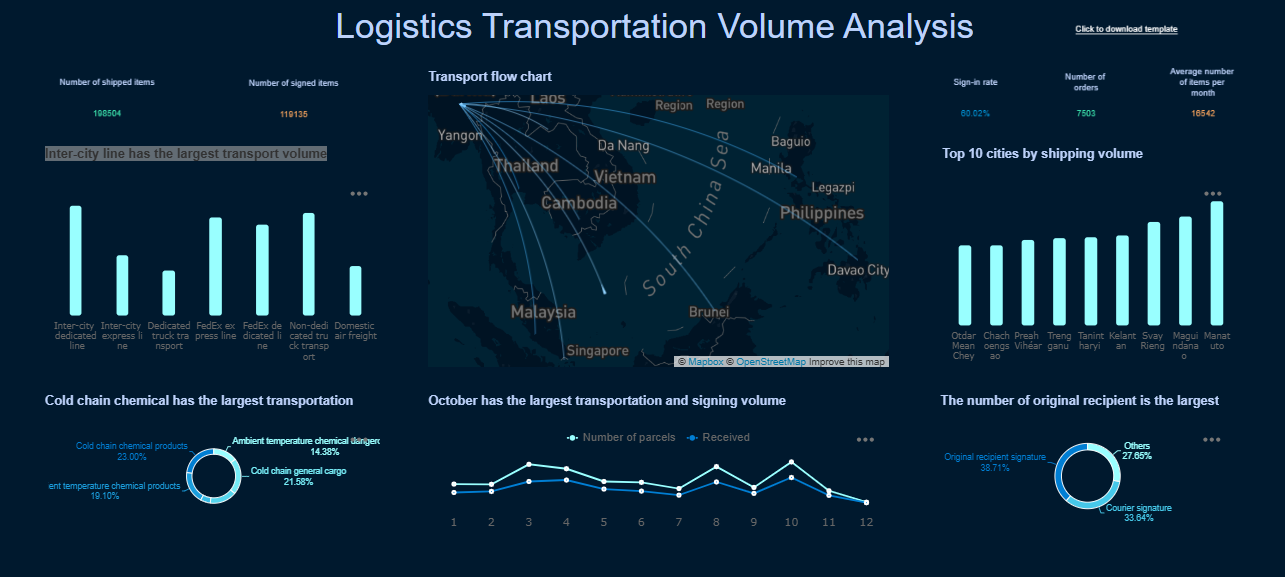
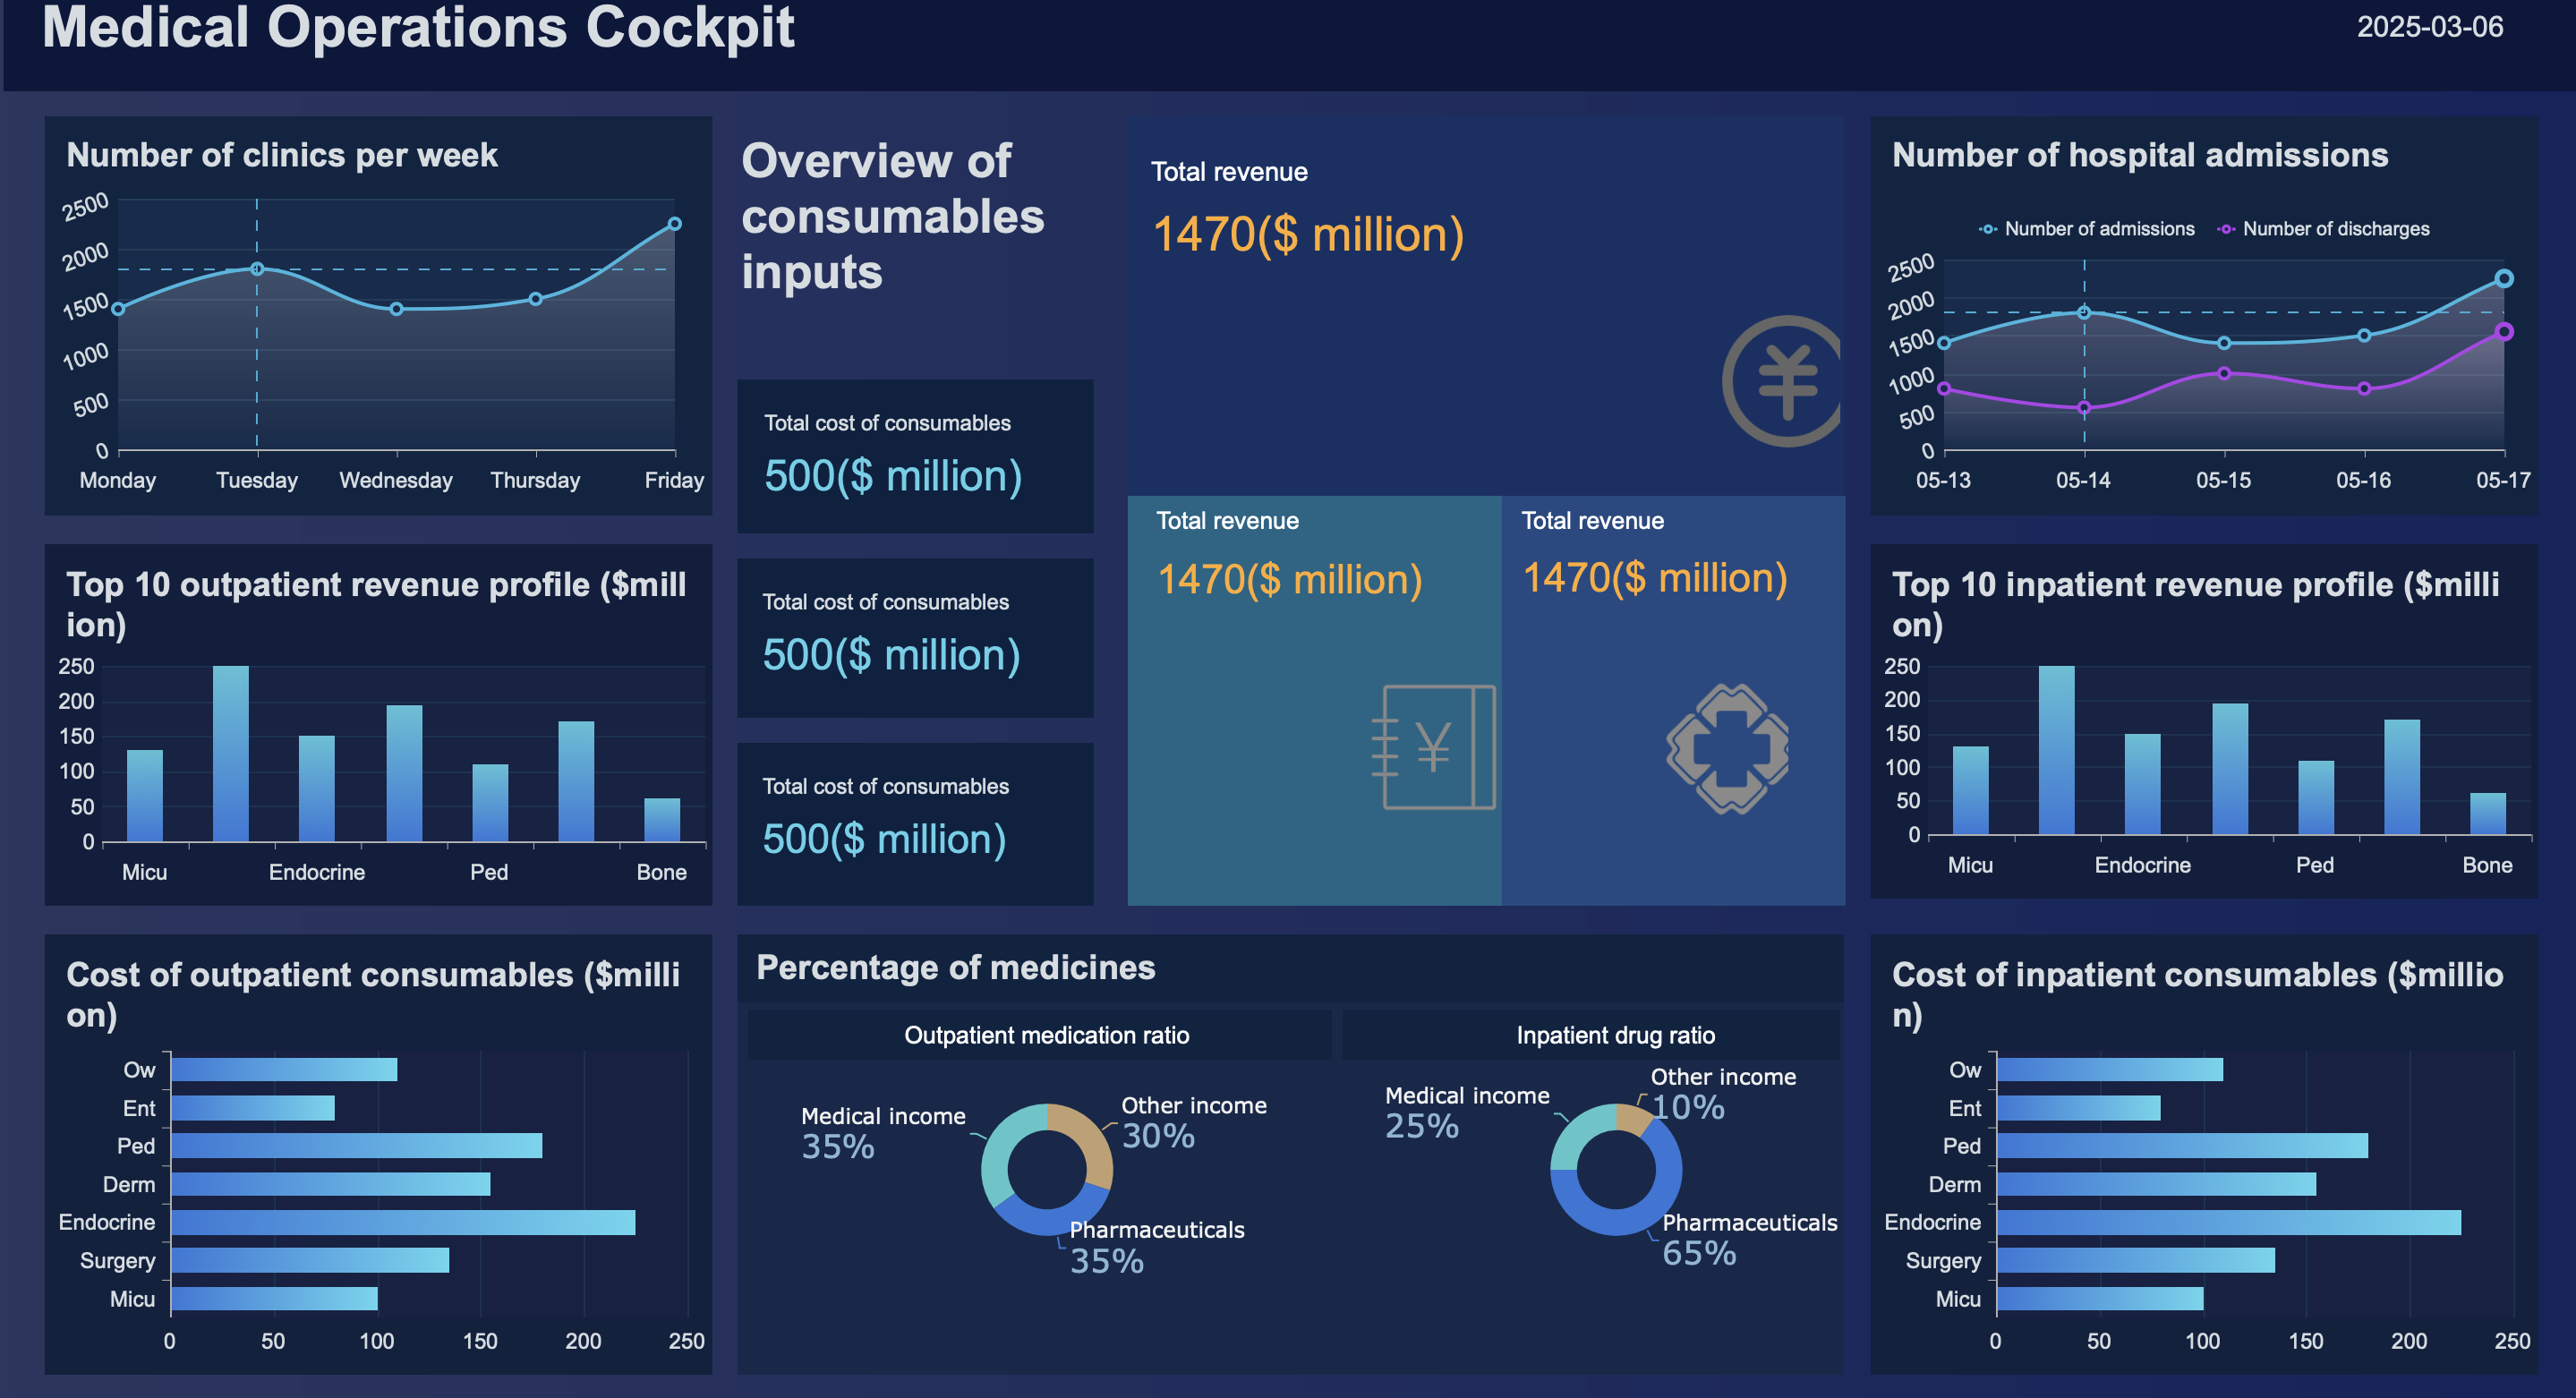
Distribution analysis supports decision-making in industries like manufacturing and supply chain management. You usedata visualization toolssuch as FineBIto process and visualize statistical distributions with real business data. These tools help you monitor key metrics, identify issues early, and improve operational efficiency. You integrate data from suppliers, distributors, and retailers to gain a holistic view of supply chain performance. This empowers you to streamline processes and anticipate challenges.
Key Performance Indicators
Description
Inventory Management
Helps in optimizing stock levels and reducing costs.
Operational Efficiency
Enhances productivity by identifying bottlenecks.
Proactive Strategies
Enables organizations to anticipate issues and respond effectively.
You see the normal distribution in quality control, demand forecasting, and risk assessment. You use the uniform distribution for random sampling and simulations. Statistical distributions give you the foundation to solve business and scientific problems with confidence.
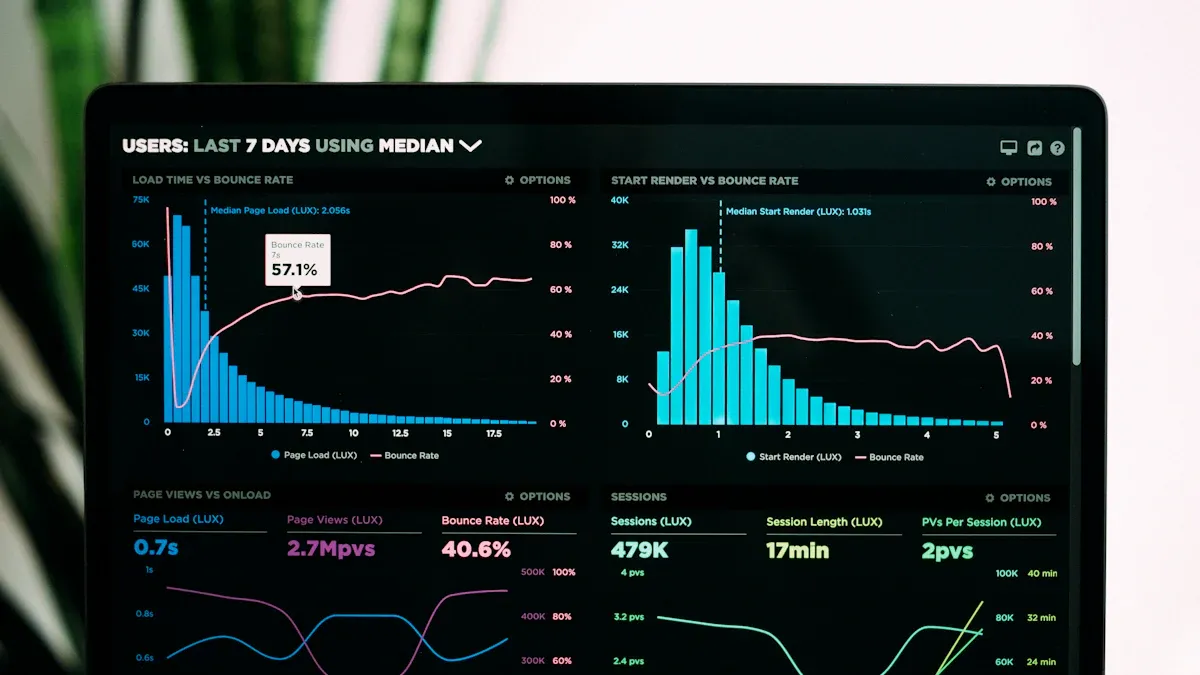
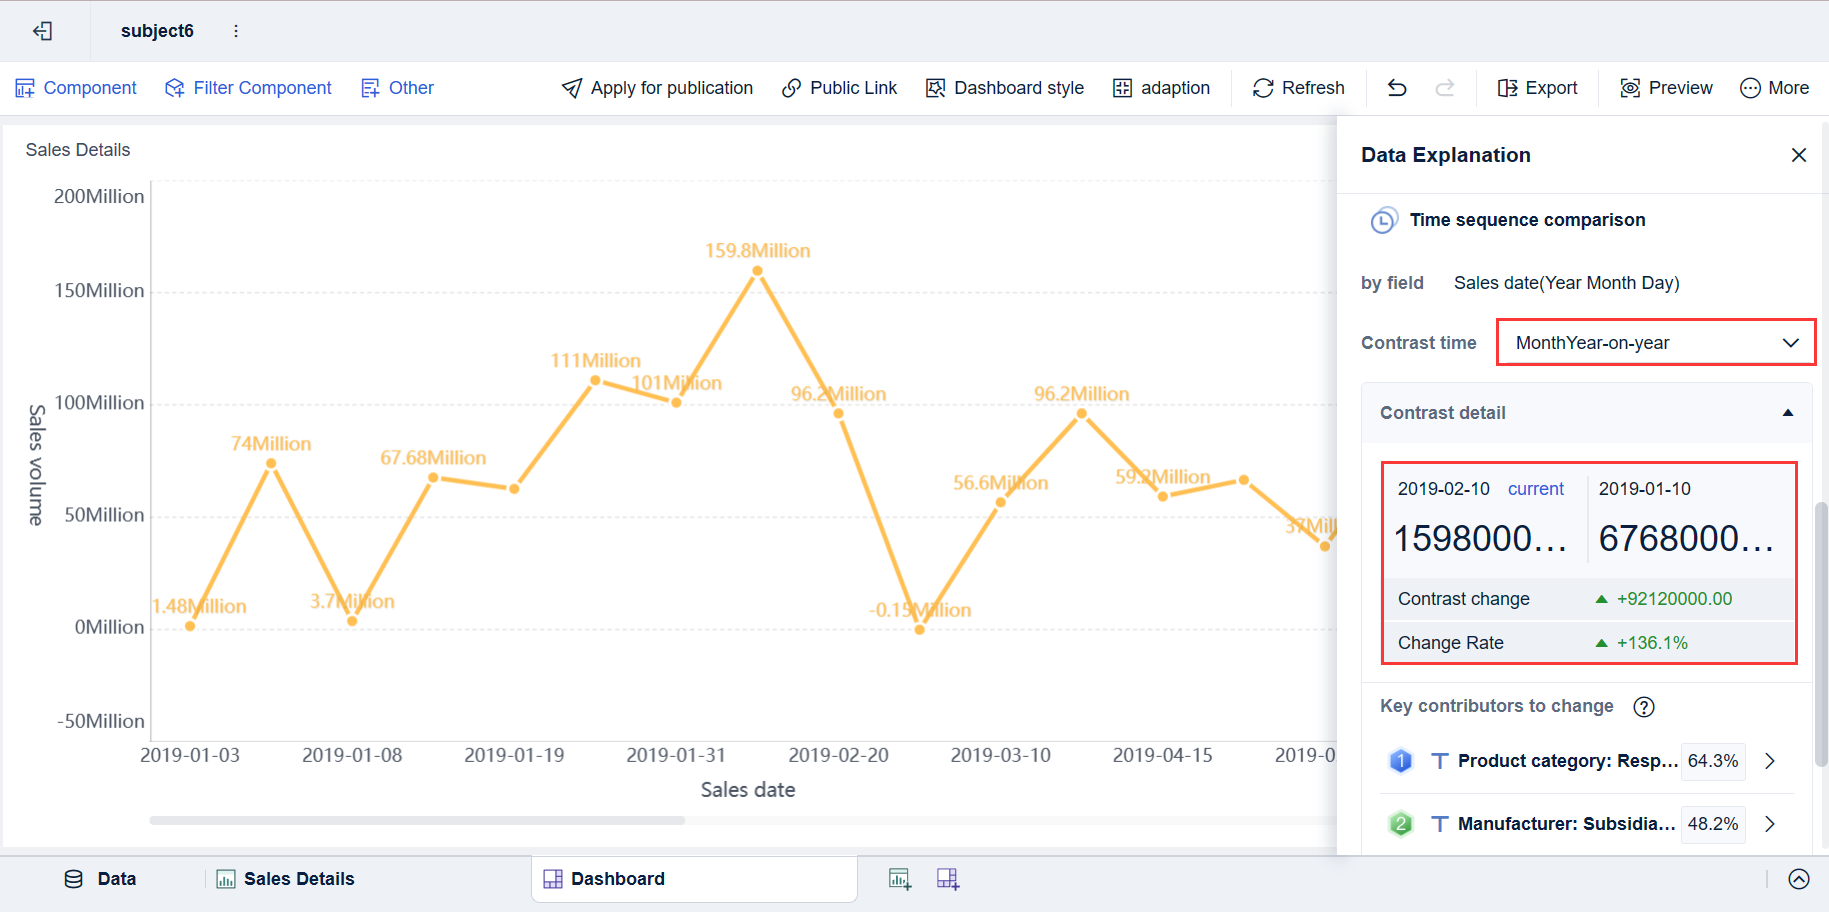
You can use FineBI to explore distributions with interactive dashboards and a wide range of chart types. FineBI gives you the ability to visualize statistical distributions, making it easier to spot patterns and trends. You can drag and drop data fields to create charts that reveal how values spread across your dataset. Scatter charts display the shape of data clusters and help you analyze distributions with large amounts of data. Heatmaps highlight the weight of points within a coordinate range, allowing you to view distributions at a glance. Funnel charts show process flows and help you compare logical sequences. If you need a comparison without a logical order, column charts work well.
Chart Type
Introduction
Features
Scatter Chart
Displays the shape of a data cluster and analyzes data distribution.
Reflects data distribution effectively with a large amount of data.
Heatmap
Highlights weight information of points within a coordinate range.
Mainly used for viewing distributions.
Funnel Chart
An inverted triangle diagram used for process analysis.
Requires a logical order; column chart recommended for comparison if order is absent.
FineBIdashboards support real-time filtering, adaptive layouts, and component linkage. You can filter data to focus on specific segments, link components for related analysis, and use the jump function to combine multiple dashboards. These features help you examine distributions from different perspectives and gain deeper insights.
FineBI enhances your understanding of distributions by offering user-friendly interfaces and visual data representation. You can drill into data layers to uncover hidden trends and merge analytic data for unified reporting. The dashboard adapts to your needs, making it easy to monitor key indicators and compare results. You can use filters to narrow your analysis and linkage to connect related data components.
Data drilling lets you explore details within distributions.
Jumping between dashboards provides comprehensive analysis.
Linkage connects different data components for related insights.
Filter components help you focus on specific data segments.
You see the impact of FineBI in real-world scenarios. For example, BOE used FineBI to unify data across factories, standardize metrics, and improve operational efficiency. In manufacturing supply chain management, FineBIhelps you visualize distributions in inventory, logistics, and sales data. You can identify bottlenecks, optimize stock levels, and respond proactively to changes. FineBI empowers you to interpret normal distribution patterns in quality control and demand forecasting, supporting better decision-making.
You can use distribution analysis to transform manufacturing and supply chain operations. In manufacturing, you need to track how inventory moves and how quickly you sell and replace products. Distribution analysis reveals inventory turnover rates and helps you compute average inventory levels. With FineBI, you can visualize these insights on dashboards. This approach allows you to make informed decisions about stock levels, reduce excess inventory, and improve cash flow.
Distribution analysis also plays a key role in logistics and sales forecasting. You can use statistical distributions to optimize purchasing and minimize waste. By understanding the probability distribution of demand, you can position inventory closer to customers and reduce lead times. The table below shows how distribution analysis benefits supply chain management:
Benefit
Description
Cost Savings
Reduces supply chain costs by optimizing purchasing and minimizing waste.
Improved Customer Satisfaction
Ensures products are available, reducing stockouts and enhancing service quality.
Enhanced Operational Efficiency
Streamlines supply and production schedules, optimizing resources and minimizing disruptions.
Positive Impact on Inventory Management
Balances inventory levels based on real-time sales signals, preventing overstock and shortages.
Better Supplier Relationships
Improves communication with vendors, allowing for better planning and stronger partnerships.
Improved Risk Management
Helps anticipate demand shifts and supply shortages, allowing for proactive adjustments.
Increased Sales
Ensures top-selling items are in stock, boosting revenue by fulfilling orders promptly.
Fast Delivery
Positions inventory closer to demand points, improving delivery speed and reducing lead times.
You face challenges such as supply chain disruptions, inefficient inventory management, and unreliable reporting. Distribution analysis helps you address these issues by providing actionable insights from statistical data.
You can see the impact of distribution analysis in real business environments. BOE, a leader in the semiconductor display industry, used FineBI to unify data across factories and standardize metrics. This change led to a 5% reduction in inventory costs and a 50% increase in operational efficiency. Teams could focus on analysis rather than manual data preparation.
Other industries also benefit from FineBI's distribution analysis solutions. In finance, companies reduced reporting cycles from weeks to days. In retail, businesses embedded analytics into daily operations and improved decision-making. Healthcare organizations used statistical distributions to enhance data diagnosis and efficiency.
Industry
Company
Application Description
Retail
Xibei Oat Noodle Village
Built a high-performance big data architecture to support analytics and improve decision-making.
Retail
Better Life Group
Conducts ad-hoc analysis with over 1000 templates, meeting 800 self-service demands monthly.
Healthcare
Medsoft
Promotes self-service data processing and analysis, enhancing efficiency in data diagnosis.
You can explore FineBI’s solutions for other industries, including HR and finance, to see how distribution analysis and different types of statistical distributions can drive better outcomes.
You gain valuable insights when you apply distribution analysis in mathematics, statistics, and business. This approach helps you make informed decisions, evaluate performance, and manage risks. FineBI empowers you to visualize and interpret statistical distributions through self-service analysis and rapid insight generation. If you want to explore FineBI's features, start by connecting your data, organizing tables, and processing fields for accurate analysis.
Access a wealth of case studies, industry insights, and solution guides to accelerate digital transformation.
FAQ
What is distribution analysis in mathematics and statistics?
Distribution analysis in mathematics and statistics examines how values spread across a dataset. You use it to identify patterns, predict outcomes, and make informed decisions based on statistical evidence.
Why do you need distribution analysis in mathematics and statistics?
You need distribution analysis in mathematics and statistics to understand data behavior. This helps you spot trends, validate results, and improve decision-making in fields like science, business, and everyday life.
How does FineBI support distribution analysis in mathematics and statistics?
FineBI supports distribution analysis in mathematics and statistics by letting you connect data sources, process datasets, and visualize distributions with interactive dashboards. You gain insights quickly and share results across your organization.
What types of distributions can you analyze with FineBI?
You can analyze discrete and continuous distributions with FineBI. The platform supports normal, binomial, Poisson, exponential, and uniform distributions, helping you explore various data scenarios.
Can you use distribution analysis in mathematics and statistics for business decisions?
You can use distribution analysis in mathematics and statistics to optimize inventory, forecast demand, and manage risks. This approach improves operational efficiency and supports strategic planning in industries like manufacturing and supply chain management.