A summary report gives you a clear view of essential information without overwhelming details. You use summary reports to quickly grasp trends, spot issues, and share insights with your team. These reports help you make better decisions faster by focusing on key metrics instead of data overload.
- Interactive summary reports make dashboards easy to understand, speeding up decision-making.
- Financial summary reports track liquidity and working capital, reducing inefficiencies.
- Sales and marketing summary reports highlight campaign ROI and KPIs, so you can act in real time.
A professional summary report streamlines communication and keeps your organization focused on what matters most.
Key Takeaways
- A summary report highlights key information clearly, helping you focus on what matters without getting lost in details.
- These reports speed up decision-making by showing trends, spotting issues, and sharing insights quickly with your team.
- Good summary reports use visuals like charts and simple language to make data easy to understand at a glance.
- Tailoring summary reports to your audience in Malaysia ensures the right people get the most relevant information for their needs.
- Automating data collection and report generation saves time and keeps your reports accurate and up to date.
- Summary reports support better communication, align teams, and help track performance and progress effectively.
- Using tools like FineReport lets you create interactive, customized reports that combine data from many sources.
- Avoid overloading reports with details; focus on clear, concise, and actionable insights to drive smarter decisions.
Summary Report Basics
What is a Summary Report
A summary report gives you a concise overview of important information. You use a summary report to highlight the key points and main points from a larger set of data or events. Instead of reading through pages of raw data, you see only what matters most. For example, meeting summary reports capture the main points of a discussion, so you can review decisions and action items quickly. In business in Malaysia, a summary report often includes charts, tables, or bullet points that make information easy to understand at a glance.
You do not need to sift through every detail. The summary report organizes information in a way that saves you time and helps you focus on results. When you use tools like FineReport from FanRuan, you can create summary reports that are visually clear and tailored to your needs. These tools let you pull information from different sources and present it in a format that supports fast decision-making.
Tip: A summary report is not just a shorter version of a full report. It is a focused document that brings out the key points and main points, making it easier for you to act on the information.
To learn more about the FineReport features, you can click on the button below to go to the product guide.
Purpose and Value
You rely on summary reports to make sense of complex information. The main purpose of a summary report is to give you the insights you need without overwhelming you with unnecessary details. You can use summary reports to track progress, monitor performance, or communicate results to your team. Meeting summary reports, for example, help everyone stay aligned by capturing the key points from each session.
The value of a summary report comes from its ability to turn raw data into actionable information. You can spot trends, identify issues, and make informed decisions faster. When you use FineReport, you gain access to features that automate data collection and visualization, so your summary reports always reflect the latest information. This efficiency means you spend less time preparing reports and more time acting on the results.

Summary Report vs. Other Reports
You might wonder how a summary report differs from other types of reports. Unlike operational or detailed reports, which often include every piece of data, a summary report focuses on clarity and efficiency. Industry statistics show that summary reports and analytical reports provide greater clarity for decision-making. They tailor information to your audience in Malaysia, making it easier to understand and act on the key points.
| Report Type | Focus | Level of Detail | Best For |
|---|---|---|---|
| Summary Report | Key points, insights | Low | Decision-making, updates |
| Operational Report | Processes, tasks | High | Daily operations |
| Analytical Report | Trends, analysis | Medium-High | Strategic planning |
| Meeting Summary Report | Main points, actions | Low | Team alignment, follow-up |
You use summary reports when you need to communicate the main points quickly. Detailed reports may be useful for technical teams, but summary reports help leaders and stakeholders see the big picture. With FineReport, you can easily switch between summary and detailed views, ensuring everyone gets the information they need.
Note: Choosing the right report type depends on your audience and goals in Malaysia. For strategic decisions, summary reports offer the clarity and efficiency you need.
Why Summary Report Matters in Malaysia
Benefits for Organizations in Malaysia
You rely on summary reports to keep your organization focused and productive. These reports help you track performance, spot trends, and communicate crucial insights across teams. When you use summary reports, you avoid information overload and ensure that everyone sees the most important conclusions.
Summary reports use descriptive statistics, such as averages and conversion rates, to give you a clear snapshot of your current performance. You can also track metrics like revenue per employee, task completion rate, and work efficiency. These numbers help you measure productivity and identify areas for improvement.
- Descriptive statistics in summary reports show you trends and progress.
- Performance metrics highlight how well your team meets goals.
- Summary reports communicate these findings clearly to all stakeholders.
- Inferential statistics in summary reports help you forecast and test new strategies.
- These approaches support data-driven decisions that boost productivity.
You can see how summary reports make it easier to share information, align teams, and drive results.
Impact on Decision-Making
Summary reports play a key role in decision-making. You use them to turn complex data into actionable information. When you review a summary report, you gain the confidence to make business decisions quickly and accurately. Data-driven studies show that summary reports help you identify risks, save costs, and benchmark progress.
| Benefit | Explanation |
|---|---|
| Increased Confidence | Data-driven summary reports give you evidence to support your decisions. |
| Proactive Identification | You can spot opportunities and threats before they become problems. |
| Cost Savings | Summary reports help you allocate resources wisely and reduce waste. |
| Risk Reduction | You minimize errors and bias by relying on clear information. |
| Benchmarking and Monitoring | You track the impact of your decisions over time and adjust as needed. |
You can see that summary reports empower you to act faster and with more certainty. They help you move from guesswork to informed decision-making, which is essential for staying competitive.
FanRuan and FineReport Value in Malaysia
FanRuan and FineReport enable you to create efficient summary reports that support strategic planning and communication. With FineReport, you can pull information from multiple sources and visualize it in a way that makes sense for your audience in Malaysia. This is especially valuable when you need to present a clinical summary report or share updates with stakeholders.
Survey data shows that organizations using more diverse data sources in their summary reports achieve better results in strategic planning. The chart below illustrates how effective organizations use more data sources than less effective ones:
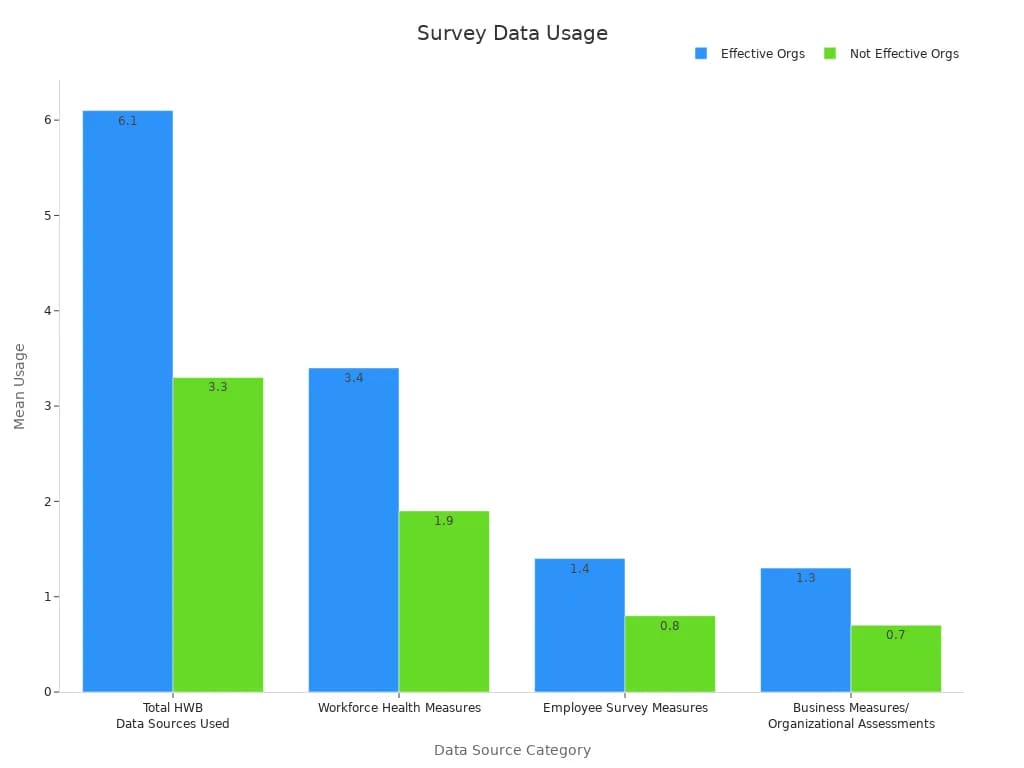
You can use FineReport to gather survey data, employee feedback, and business metrics, then turn them into actionable summary reports. This approach ensures your strategic plans stay relevant and effective. FineReport’s automation and visualization features help you deliver efficient summary reports that drive better decisions and keep your organization moving forward.

Tip: When you use summary reports powered by FanRuan and FineReport, you gain a clear advantage in communication, planning, and decision-making.
Good Summary Report Elements
Key Components
A good summary report always starts with the right building blocks. You want your report to deliver key information in a digestible format, so your audience in Malaysia can act quickly. Here are the essential elements you should include:
- Begin with a clear executive summary that highlights the main points and key points.
- Organize your content into logical sections with headers and subheaders for easy navigation.
- Use visual elements like charts and graphs to make trends and comparisons stand out.
- Present findings and recommendations in a concise format, focusing on actionable insights.
- Include condensed versions or summaries for quick reference, especially for busy stakeholders.
- Write in clear, jargon-free language tailored to your audience in Malaysia.
- Prioritize the most important data and avoid overwhelming readers with unnecessary details.
FineReport helps you build high-quality summary reports by offering drag-and-drop templates, built-in visualizations, and flexible layouts. You can easily structure your report and present key points in a way that supports fast, informed decisions.

Tip: Use FineReport’s dashboard features to combine multiple data sources and present your main points in a single, digestible format.
Clarity and Brevity
Clarity and brevity set a good summary report apart from a cluttered document. You need to focus on the main points and avoid extra information that distracts from your message. Performance metrics show that concise synthesis of data leads to better understanding and faster action.
- Identify and prioritize key messages for your audience in Malaysia.
- Use simple language and avoid jargon.
- Incorporate visual aids to illustrate trends and reduce lengthy explanations.
- Limit each section to one important idea for maximum impact.
FineReport supports clarity by letting you automate data collection and use comparison analysis. You can create reports that highlight changes over time or between groups, making your findings easy to understand. The software’s visual tools help you present information in a digestible format, so your audience in Malaysia grasps the key information at a glance.
Audience Relevance
You must tailor every good summary report to your audience in Malaysia. Different stakeholders care about different results. For example, a CFO looks for cost savings, while a CTO wants to see system performance. When you understand your audience’s priorities, you can frame your main points to match their needs.
FineReport makes this easy by allowing you to customize dashboards and reports for different roles. You can highlight the metrics that matter most to each group, whether it’s financial performance, operational efficiency, or customer satisfaction. By aligning your report with your audience’s interests in Malaysia, you ensure your message is clear and persuasive.
Note: Always support your claims with measurable results and real-world examples. FineReport lets you add charts, customer stories, and pilot results to reinforce your message.
A good summary report delivers the right information, in a concise format, to the right people. When you use FineReport, you gain the tools to create summary reports that are clear, relevant, and actionable.
Creating Summary Report with FineReport in Malaysia
Step-by-Step Process
You can create a summary report in FineReport by following a clear, structured process. Start by connecting FineReport to your data sources. Use the built-in data connectors to link databases, spreadsheets, or cloud platforms. Next, select or design a report template that matches your reporting needs. FineReport offers drag-and-drop tools, so you can add tables, charts, and key metrics without coding.
After setting up your template, define the data fields you want to summarize. You can filter, group, or aggregate data to focus on the most important information. FineReport lets you preview your report in real time, so you can adjust layouts and visualizations as needed. Once satisfied, schedule your report for automatic generation. FineReport can run tasks daily, weekly, or on demand, ensuring your summary reports always reflect the latest data.
Tip: Use FineReport’s automation features to eliminate manual data gathering. This approach saves time and ensures your reports are always accurate and up to date.
Best Practices
To get the most value from your summary reports, follow these best practices:
- Automate data collection and report generation. FineReport allows you to schedule tasks, which reduces manual work and minimizes errors.
- Integrate multiple data sources. Pull information from different platforms to create a comprehensive view.
- Use clear visualizations. Charts and dashboards help your audience in Malaysia understand trends and key metrics at a glance.
- Customize reports for your audience in Malaysia. Tailor the content and layout to match the needs of executives, managers, or team members.
- Test and validate your reports. Preview your summary reports before sharing to ensure accuracy and clarity.
FineReport’s automation capabilities directly improve efficiency. By automating data collection and consolidation, you avoid repetitive manual tasks. This process leads to dynamic, timely, and actionable summary reports. Automated dashboards provide clear overviews and enable detailed analysis, supporting faster and more confident decision-making.
Common Mistakes
You should watch out for common mistakes when creating summary reports:
| Mistake | How to Avoid It |
|---|---|
| Overloading with details | Focus on key metrics and main points |
| Ignoring automation | Schedule tasks to keep reports current |
| Using unclear visuals | Choose simple, relevant charts and tables |
| Not validating data sources | Check connections and data accuracy regularly |
| Failing to tailor for audience | Adjust content for each stakeholder group |
Avoiding these pitfalls ensures your summary reports remain clear, relevant, and actionable. Rely on FineReport’s automation and visualization tools to streamline your workflow. When you use these features, you minimize errors and deliver summary reports that drive better business outcomes.
Note: Consistent use of automation and real-time data integration in FineReport leads to measurable improvements in reporting efficiency and decision quality.
Summary Report Use Cases in FineReport in Malaysia
Business and Finance in Malaysia
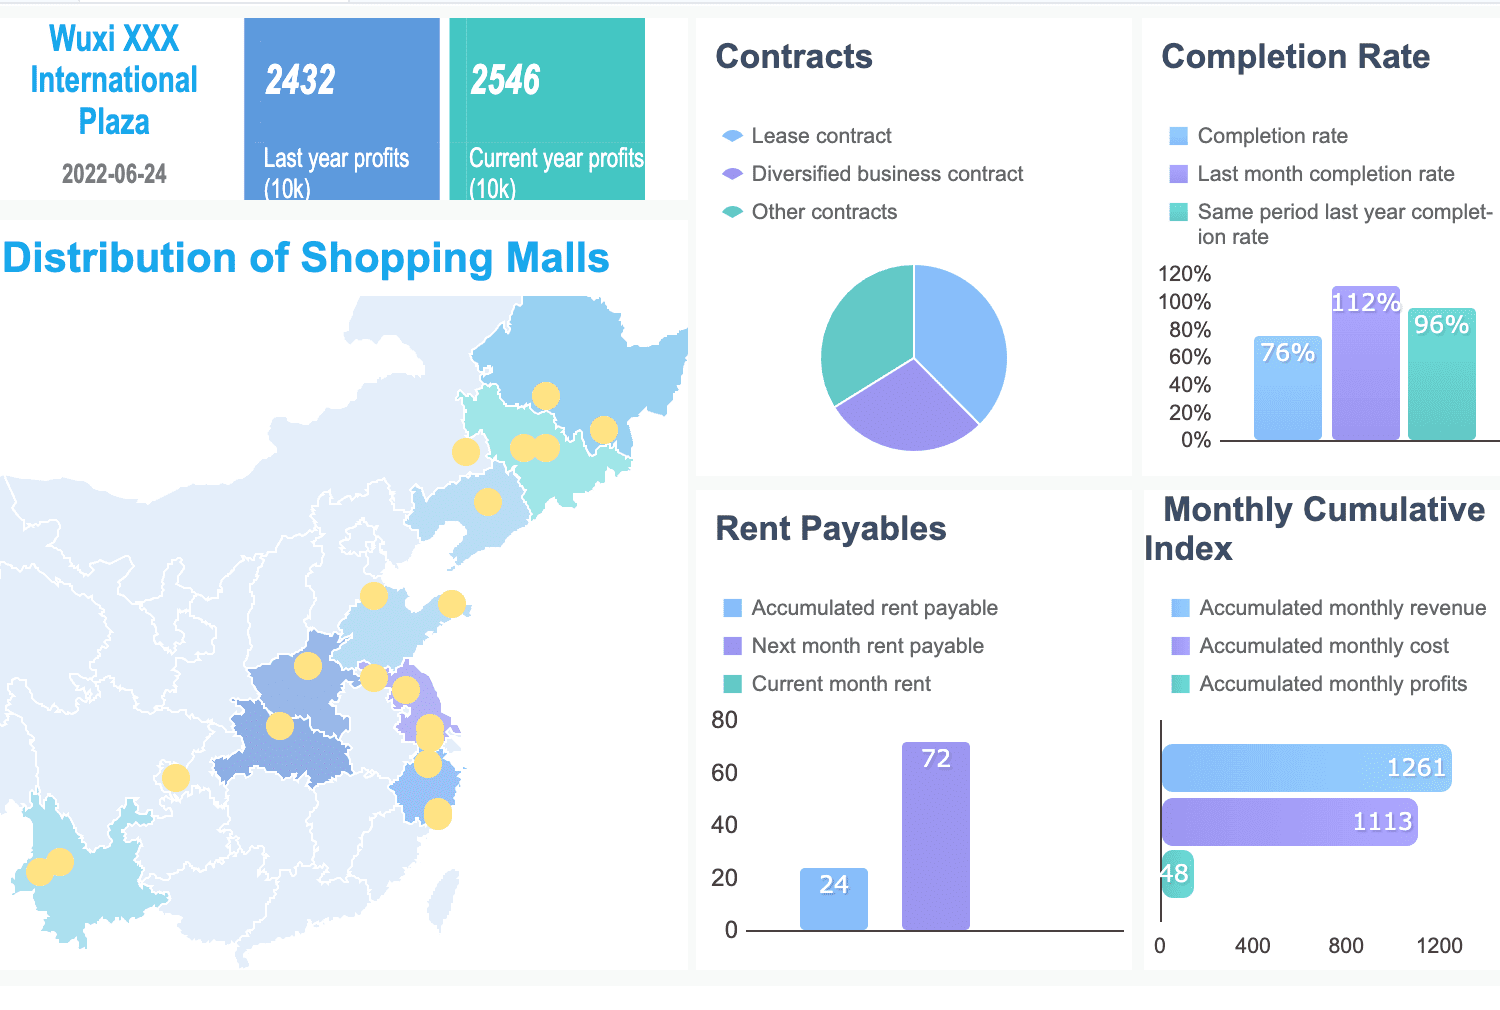
You can use FineReport to transform how you manage business and finance data in Malaysia. Summary reports in this sector help you track key performance indicators (KPIs) and compare results across regions or departments. You see profit and profit rate side by side, making it easy to evaluate performance. FineReport lets you unify dealer and store data, so you can view total orders, sales, and inventory in one dashboard.
- Measure and compare KPIs by region or department.
- Aggregate dealer and store data for a unified view.
- Use predictive analysis to forecast sales with trend prediction and regression analysis.
- Display key financial metrics like profit and loss, cash flow, and budget management.
- Review monthly KPI overviews for individuals and departments.
- Compare actual versus predicted sales and costs to guide decisions.
Financial dashboards in FineReport consolidate data from accounting software, CRM systems, and sales platforms. You get a centralized view of financial performance, which supports effective summary reporting and better resource allocation. Here is an financial KPI dashboard created by FineReport, click to experience it.
Manufacturing and Lean Production
In manufacturing, you rely on summary reports to drive lean production strategies. FineReport enables you to optimize resources, manage raw materials, and monitor production capacity. You can use summary reports to analyze machine performance and schedule predictive maintenance. Waste reduction becomes possible when you identify slow cycles, breakdowns, and defects.
- Optimize resources and production capacity.
- Enable predictive maintenance through machine performance analysis.
- Reduce waste by tracking losses and defects.
- Increase yield and revenue by improving efficiency.
- Align production with business goals in Malaysia for strategic success.
| KPI Name | Description | Example Formula |
|---|---|---|
| Overall Equipment Effectiveness (OEE) | Measures equipment efficiency during scheduled production time. | OEE = Availability × Performance × Quality |
| Takt Time | Time required to produce a unit to meet demand. | Takt Time = Available time / Customer demand |
| First Pass Yield (FPY) | Percentage of products meeting quality standards without rework. | FPY = Quality Units / Total Units Produced |
| Machine Downtime Rate | Ratio of downtime hours to total operational hours. | Downtime Rate = Downtime / (Downtime + Operation) |
| Capacity Utilization | Measures use of total production capacity. | Utilization = Actual Use / Total Capacity |
These KPIs give you real-time transparency and actionable insights. FineReport summary reports help you validate lean strategies and support continuous improvement.
Clinical Summary Report Applications
You can use FineReport to create a clinical summary report that brings clarity to complex healthcare data. The clinical summary report serves as a vital tool in hospitals and research centers. You can present research findings, patient outcomes, and trial objectives in a clear, interactive format. FineReport supports drag-and-drop report creation, so you can build detailed clinical summary reports without advanced technical skills.
A clinical summary report integrates forms, graphics, and parameters, making it easy to analyze clinical trials and share results. You can perform multi-sheet and cross-sheet calculations, compatible with Excel formulas, to support in-depth performance analysis. Healthcare organizations use the clinical summary report to present and analyze statistical data from clinical trials, ensuring that research findings and trial objectives are easy to understand.
- Create detailed, interactive clinical summary reports.
- Integrate statistical data and research findings for clinical trials.
- Support multi-sheet calculations and Excel compatibility.
- Present trial objectives and outcomes in a user-friendly format.
- Share clinical summary reports with stakeholders for better decision-making.
- Use clinical summary reports to track progress and highlight key research findings.
- Analyze clinical trials data for performance analysis and reporting.
- Enhance usability and clarity of clinical summary reports in healthcare settings.
- Facilitate sharing and collaboration on clinical summary reports.
- Ensure clinical summary reports support regulatory and research requirements.
You gain a powerful way to communicate research findings and trial objectives, making the clinical summary report an essential part of healthcare analysis and reporting.
EHS and Risk Management
You face many challenges when managing environmental, health, and safety (EHS) risks in your organization. You need to track incidents, monitor compliance, and ensure the well-being of your employees. A clinical summary report gives you a powerful way to organize and present this information. When you use a clinical summary report, you can quickly see trends in workplace injuries, identify hazards, and review safety training outcomes.
You can use FineReport to create a clinical summary report that brings together data from inspections, audits, and incident logs. This report helps you spot patterns and take action before small issues become big problems. For example, you might use a clinical summary report to track the number of safety incidents each month. You can also compare results across different departments or locations. This approach helps you focus your resources where they are needed most.
A clinical summary report supports compliance with regulations. You can show auditors and regulators that you have a clear record of safety checks, corrective actions, and employee training. FineReport lets you automate the creation of a clinical summary report, so you always have up-to-date information ready for review. You can schedule reports to run weekly or monthly, making it easy to stay on top of EHS requirements.
You also improve communication with your team when you share a clinical summary report. Everyone can see the main findings and recommendations. You can use charts and tables to highlight key metrics, such as lost-time injury rates or near-miss incidents. This makes it easier for managers and employees to understand what actions they need to take.
FineReport’s flexibility means you can customize your clinical summary report for different audiences in Malaysia. Senior leaders might want a high-level overview, while safety officers need more detailed data. You can tailor the clinical summary report to meet these needs. You can also integrate data from multiple sources, such as HR systems, equipment logs, and environmental sensors.
Tip: Use a clinical summary report to drive continuous improvement in your EHS program. Regularly review your reports to identify trends, set new goals, and measure progress.
A clinical summary report is not just a document. It is a tool that helps you manage risk, protect your people, and build a culture of safety. When you use FineReport, you make it easier to create, share, and act on the insights from your clinical summary report.
Sharing and Distributing Summary Report
Presenting to Stakeholders
You need to present summary reports in a way that makes complex data easy to understand. FineReport gives you tools to organize your findings, use visual aids, and highlight key insights for your audience in Malaysia. When you share summary reports with stakeholders, you help everyone see the main points quickly. This approach saves time and keeps your team focused on what matters most.
Well-structured summary reports increase transparency, credibility, and alignment among stakeholders. For example, companies have used summary reports to highlight workplace safety issues and guide actionable recommendations. Academic research also shows that clear presentation of findings leads to faster understanding and better decision-making.
- Summary reports condense complex information into digestible formats.
- They keep teams aligned and informed on project status and outcomes.
- Written records provide accountability and future reference.
- Automation tools like FineReport ensure consistency and save time.
You build trust and support better decisions by making your reports clear and accessible.
Automation and Scheduling
FineReport lets you automate the sharing and scheduling of summary reports. You can set up reports to run daily, weekly, or monthly, so your team always has the latest information. Automation reduces manual work and ensures that everyone receives updates on time.
- Schedule reports to be sent by email or mobile notification.
- Use automated workflows to deliver reports to specific groups or individuals.
- Maintain a consistent reporting schedule for regular updates.
Automated distribution means you never miss a deadline. Your stakeholders stay informed, and you can focus on analysis and decision-making instead of manual tasks.
Accessibility and Security
You want your summary reports to be accessible to the right people, anytime and anywhere. FineReport supports mobile access, so you and your team can view reports on smartphones, tablets, or computers. This flexibility helps you make quick decisions, even when you are away from your desk.

Security is a top priority. FineReport offers robust permission controls, so only authorized users can view or edit sensitive information. You can assign roles, set access levels, and track report usage. Secure sharing of summary reports builds trust within your organization. Real-world data shows that organizations with transparent and reliable information sharing see higher employee motivation, customer loyalty, and better financial results. The importance of transparency in sharing reports cannot be overstated, as it directly impacts organizational trust and performance.
Tip: Use FineReport’s permission settings to protect confidential data while ensuring that key stakeholders have the access they need.
With FineReport, you combine accessibility, security, and automation to deliver summary reports that drive better decisions and foster a culture of trust.
You rely on summary reports to drive clarity, efficiency, and results in your organization. These reports transform complex data into actionable insights, helping you focus on important conclusions and key takeaways. In modern industries, summary reports support real-time monitoring, process optimization, and continuous improvement:
- Control charts and T-tests validate improvements, reduce defects, and boost operational efficiency.
- Automated data collection and advanced analytics turn raw data into clear summary reports that guide decision-making.
- Case studies show summary reports lead to measurable gains, such as reduced production time and higher ROI.
Leverage FineReport to create summary reports that empower your team, reinforce takeaways, and keep everyone aligned. When you deliver clear, actionable summary reports, you set the stage for smarter decisions and lasting success.
Click the banner below to try FineReport for free and empower your enterprise to transform data into productivity!

Continue Reading About Report
Empower Your Business: Best Financial Reporting Tools 2025
Free Daily Report Template – Streamline Reporting Fast
What Is a Daily Report and Why Does It Matter for Businesses


FAQ

The Author
Lewis
Senior Data Analyst at FanRuan
Related Articles

Financial Reporting Valuation Explained: A Practical Guide to ASC 820, ASC 805, ASC 350, and ASC 718
$1 valuation is the process companies use to measure assets, liabilities, equity instruments, and reporting units for compliant $1. For CFOs, controllers, finance directors, and audit facing accounting teams, the challen
Yida Yin
Jun 25, 2026

Best Ad Reporting Tool in 2026: 8 Options Compared for Marketers and Analysts
$1 is an $1 and dashboard platform that helps teams unify ad data, build highly customized reports, and automate distribution at scale. 8 ad reporting tool options compared 1. DashThis One sentence overview: DashThis is
Yida YIn
Jun 25, 2026
Office 365 Reporting Tool Guide: Track Usage, Security, and License Waste in One Dashboard
An office 365 $1 should do more than generate static usage charts. For IT managers, operations leaders, and Microsoft 365 administrators, the real value is operational visibility: who is actually using the platform, wher
Yida Yin
Jun 25, 2026