A management information system report, or MIS report, gives you a clear view of your business activities. MIS reports turn raw data into insights that support quick decision-making and help you monitor performance across departments. With modern MIS reporting tools like FineReport, you move from static reports to interactive dashboards. You gain real-time access to key metrics, which streamlines workflows and improves efficiency. MIS reports reduce repetitive reporting, collapse approval chains, and help your team focus on what matters most. When you use MIS reporting, you align your business goals, track progress, and make informed choices that drive growth.
Every report here was built with FineReport—the smarter way to automate and visualize your data.
Start your free trial and turn complex reports into clarity.

A management information system report, or MIS report, is a structured document that helps you understand your business performance. You use these reports to track important indicators like sales, revenue, and financial health. MIS reports take raw data from different sources and turn it into clear, useful information. This process supports your decision-making and helps you plan for the future.
You can think of an MIS report as a tool that brings together data from across your company. It organizes this information in a way that makes it easy for you to spot trends, identify problems, and see where you can improve. The main goal of MIS reporting is to give you the insights you need to make smart choices and keep your business moving forward.
Here is how a typical MIS report works:
MIS reports help you communicate with your team and stakeholders. They summarize complex information in a standard format, making it easier for everyone to understand what is happening in your business. These reports also help you look back at past trends, which is important for long-term planning and staying competitive.
Every MIS report contains several key components that make it valuable for your business. When you create an MIS report, you want to include the following elements:
MIS reports also include details about data sources, stakeholders, and the business procedures used to collect and analyze information. You use software tools to process and visualize the data, making the report easy to read and understand.
Tip: When you use clear visuals and summaries, your MIS reports become more actionable. You can quickly identify what needs attention and share insights with your team.
The key components of an MIS report work together to turn raw data into actionable insights. For example, summary reports give you a high-level view for planning, while trend and exception reports help you spot changes or problems early. Financial and inventory reports keep you informed about your resources, and KPI reports let you track progress toward your goals.
| MIS Report Type | How It Helps You Take Action |
|---|---|
| Summary Reports | Guide your strategic planning and resource use |
| Trend Reports | Show patterns so you can adjust your strategy |
| Exception Reports | Highlight problems for quick fixes |
| Financial Reports | Inform your budgeting and investment decisions |
| Inventory Reports | Help you manage stock and reduce costs |
| Sales Reports | Guide your sales and marketing efforts |
| KPI Reports | Track your most important business metrics |
| Dashboard Format | Give you real-time, interactive data views |
When you include these elements, your MIS reports become powerful tools for monitoring, analysis, forecasting, and control.

You need the right tools to make MIS reporting easy and effective. FanRuan is a leader in management information systems and business intelligence. The company focuses on helping you turn data into insights that drive your business forward.
FineReport, one of FanRuan’s flagship products, gives you a flexible and user-friendly way to create MIS reports. With FineReport, you can:
FineReport supports all the key components of an MIS report. You can build executive summaries, track KPIs, and create trend analyses with ease. The platform also helps you manage data quality and security, which are essential for reliable MIS reporting.

FanRuan and FineReport help you break down data silos and bring all your information together. You get a complete view of your business, which makes it easier to spot opportunities and solve problems. With these tools, you can move from manual, time-consuming reporting to automated, real-time insights that support better decisions.
Note: Many leading companies trust FanRuan and FineReport for their MIS reporting needs. You can join them and start making data-driven decisions with confidence.

You need accurate information to make the right choices for your business. MIS reports fill information gaps and reduce risks. These reports give you facts instead of guesses, so you can avoid mistakes caused by relying only on past experience or intuition. When you use MIS reporting, you get clear data that helps you spot trends, predict outcomes, and test different options. For example, companies like Amazon use MIS to run simulations and see how changes in price or supply affect sales. This approach helps you make decisions that are based on real numbers, not just opinions.
When you use MIS reports, you reduce the impact of cognitive biases and improve the quality of your decisions.
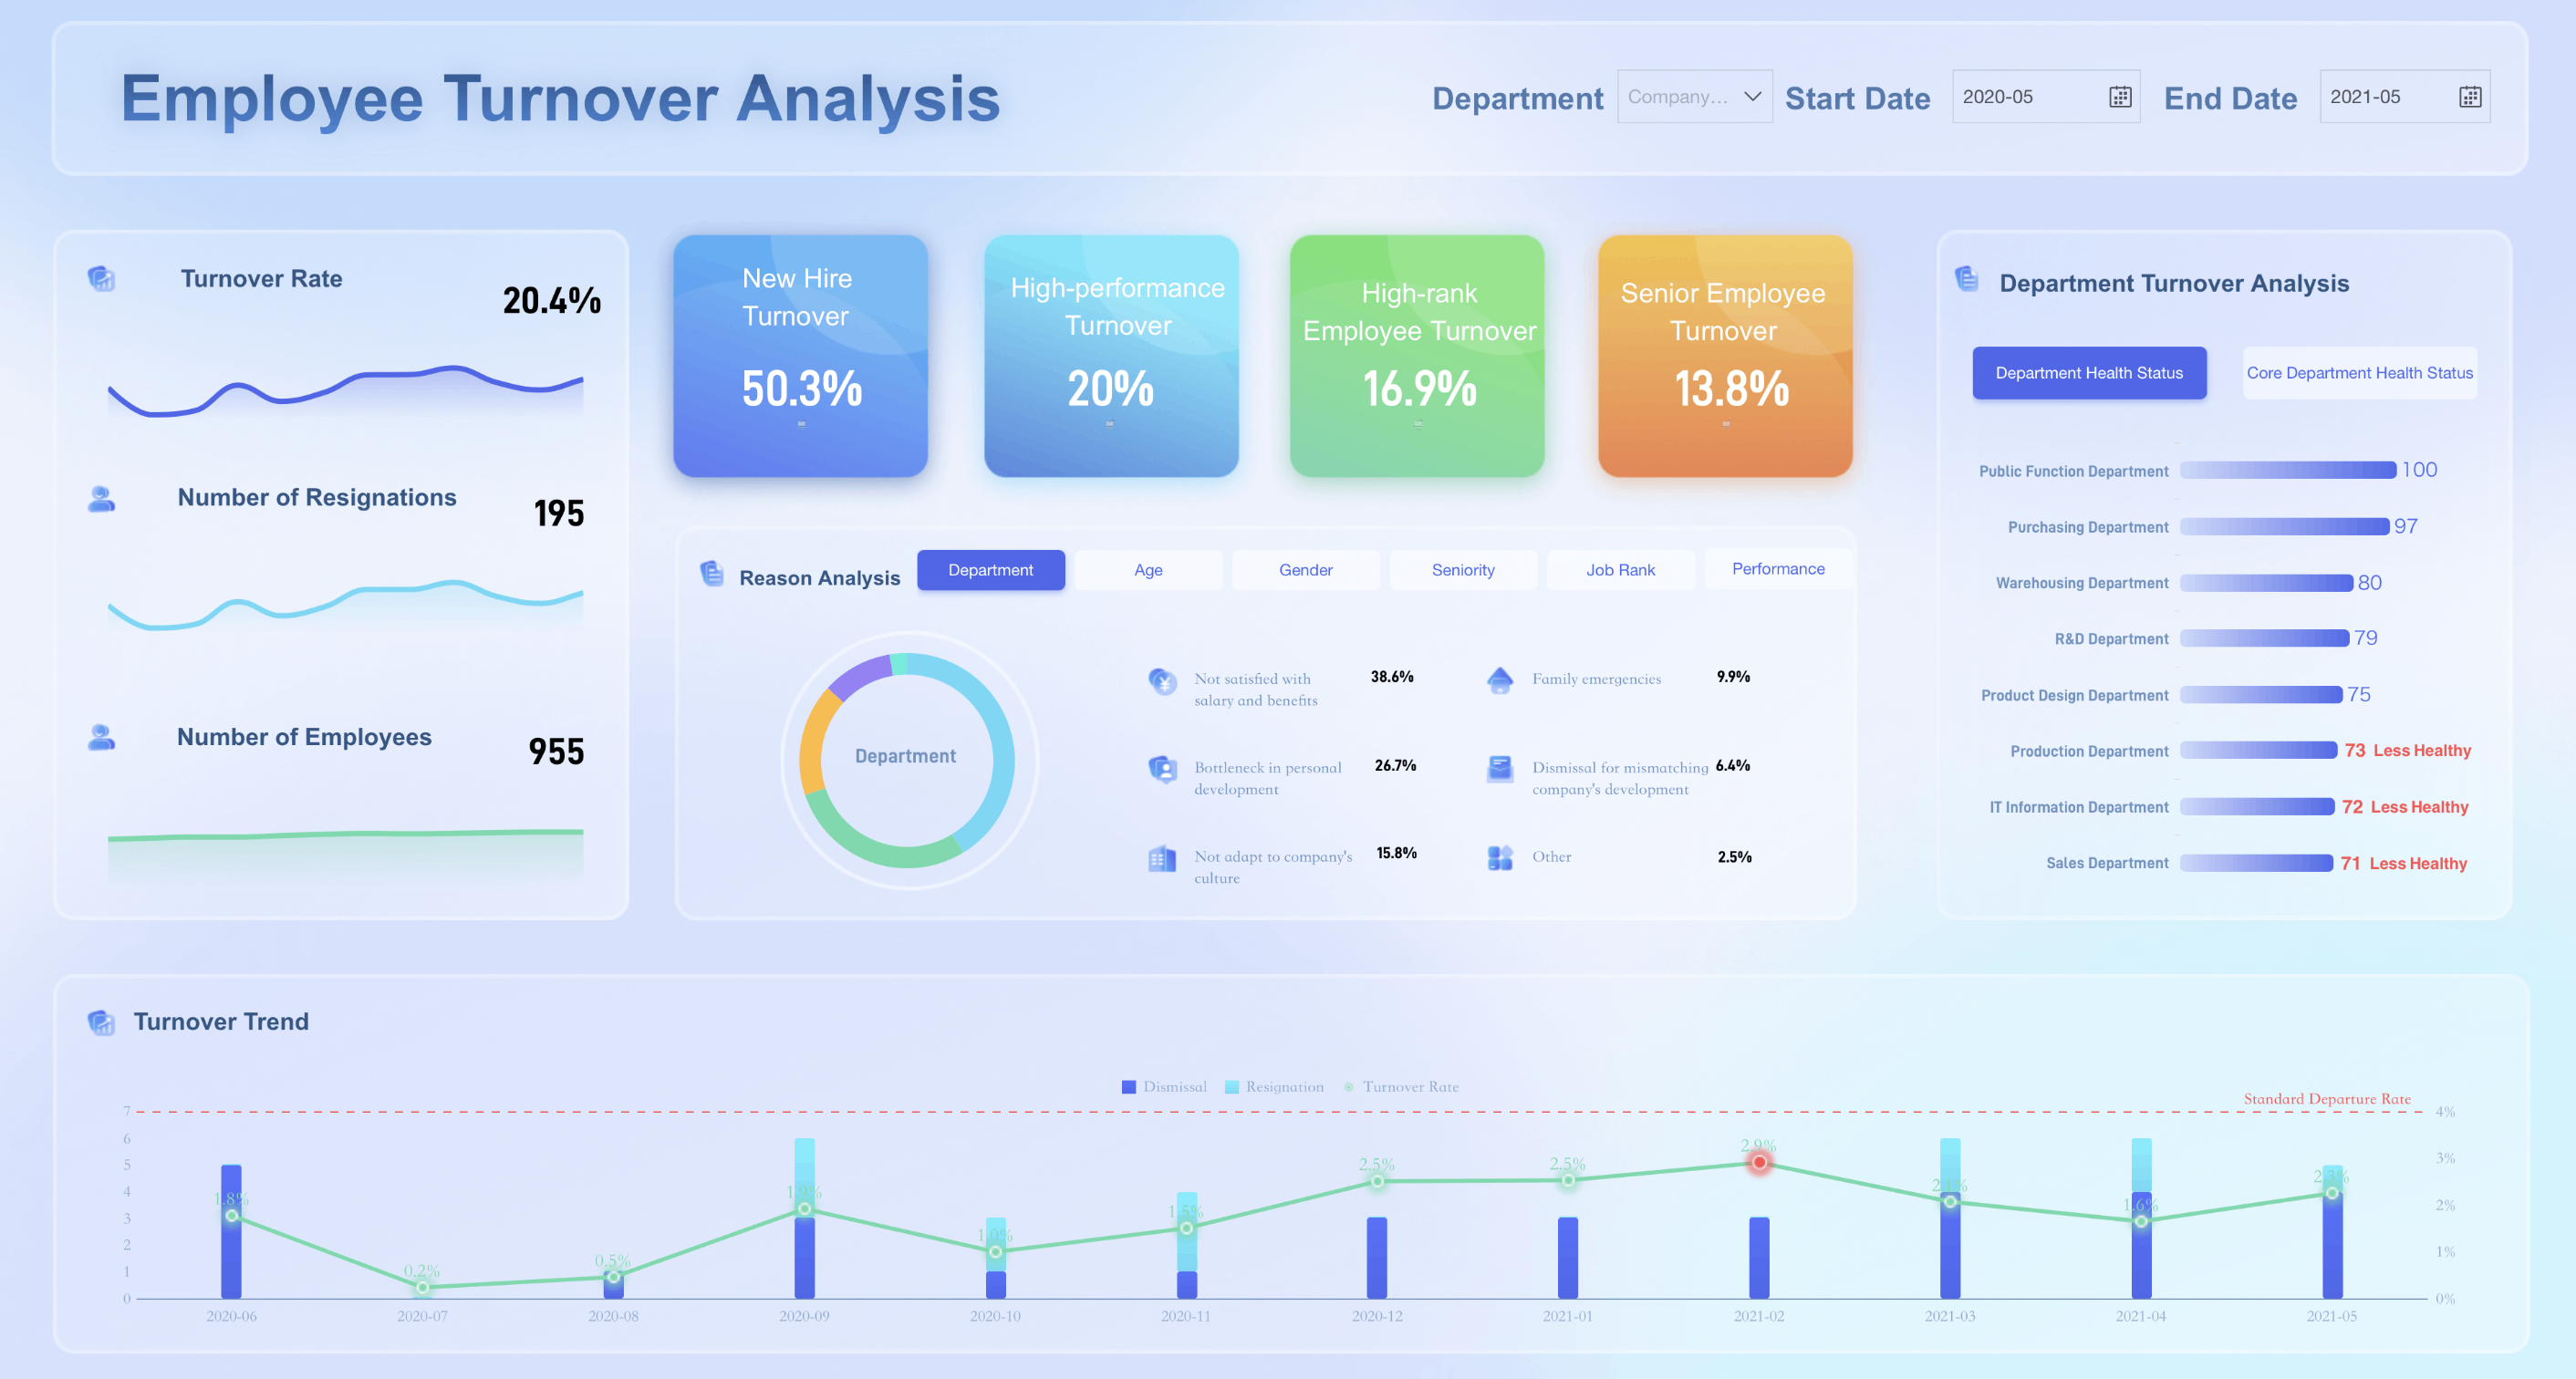
You want to know how your business is doing at all times. MIS reports let you track key performance indicators (KPIs) such as sales, costs, and customer satisfaction. These reports show you where your business is strong and where you need to improve. For example, you can use employee productivity reports to find out if your team is meeting targets or if there are gaps in skills. Maintenance cost reports can reveal if equipment is breaking down too often, so you can take action before problems grow.
| MIS Report Type | What You Track | How It Helps You Improve |
|---|---|---|
| Employee Productivity Reports | Overtime, absenteeism | Spot labor issues, boost output |
| Maintenance Cost Reports | Repair costs, downtime | Reduce breakdowns, save money |
| Utility Usage Reports | Energy, water, costs | Cut waste, lower expenses |
MIS reporting gives you a clear view of your business performance, so you can act quickly and stay ahead of problems.
MIS reports play a big role in helping your business grow. Research shows that companies with strong MIS systems improve financial results and work more efficiently. These reports give you real-time updates, so you can respond fast to new opportunities or threats. By tracking KPIs and aligning your IT strategy with business goals, you keep your company moving in the right direction. MIS reporting also automates routine tasks and brings data from many sources together. This saves time and lets you focus on what matters most—growing your business.
FineReport takes the importance of MIS reports to the next level. You get real-time data and automation, which means you always have the latest information at your fingertips. FineReport connects to many data sources and lets you design reports with a simple drag-and-drop interface. You can schedule reports to run automatically, so you never miss a deadline. The platform helps you track business performance, monitor KPIs, and share insights with your team on any device.
FineReport empowers you to make smarter decisions, improve efficiency, and drive business growth with powerful MIS reporting tools.

You rely on financial MIS reports to understand your company’s financial health. These reports include balance sheets, income statements, and cash flow statements. You can use them to compare actual results with your budget and spot any differences quickly. Financial MIS reports help you update your plans and forecasts when new information appears. You can identify risks early and take action before problems grow. These reports also connect your operational and financial plans, making it easier to see the big picture.
Financial MIS reports pull data from accounting, sales, and payroll systems. You get a single source of truth, which helps you track revenue, expenses, and cash flow. This makes your planning more accurate and your business more agile.
Operational MIS reports give you a clear view of daily business activities. You can track important metrics such as order accuracy, inventory costs, and on-time delivery. These reports help you monitor how well your warehouse, manufacturing, or retail operations perform.
You use operational MIS reports to spot bottlenecks, improve efficiency, and keep your business running smoothly. These reports also help you plan resources and measure staff performance.
Sales and marketing MIS reports show you how your campaigns perform and where your customers come from. You can measure sales growth, channel effectiveness, and customer behavior. These reports use models like marketing mix modeling and attribution analysis to help you see which campaigns drive the most value.
For example, you might shift your budget from print ads to digital channels if the data shows better results. You can track key metrics such as cost per acquisition, lifetime value, and direct sales. These insights help you adjust your strategy, improve ROI, and avoid wasting resources on low-performing campaigns.
Tip: Use sales and marketing MIS reports to refine your campaigns and justify your marketing budget with real data.
You can create custom MIS reports with FineReport to fit your unique business needs. FineReport offers a drag-and-drop designer, so you build interactive reports without coding. You connect to databases with one click and choose from over 50 chart styles, including dynamic and 3D options. FineReport lets you extend features with open-source libraries and access dashboards on mobile devices.
Custom MIS reports help you focus on the metrics that matter most to your business. You get the flexibility to analyze data your way and share insights with your team anytime, anywhere.
You start by defining the purpose of your MIS report. This step helps you align your data and analysis with your business goals. Next, select the key performance indicators that matter most to your team. Gather data from different departments, making sure it is accurate and complete. Use reliable sources to avoid errors or bias. Automated systems help you collect data quickly and reduce mistakes. Always sort and filter out irrelevant information before you move to the next step.
Tip: Keep your data sources credible and your collection process neutral. This ensures your MIS reports reflect the true state of your business.
FineReport makes report design simple and efficient. You use its drag-and-drop interface to build clear layouts and add visual aids like charts or graphs. Connect to multiple data sources, such as databases or spreadsheets, in just a few clicks. Organize your data into tables, summaries, and dashboards that highlight trends and KPIs. FineReport lets you customize your MIS report to fit your needs, whether you want a detailed analysis or a quick overview.
Automating your MIS reporting saves time and keeps your reports up to date. Set clear goals for each report and choose the right KPIs. Decide how often you need updates—daily for operations or weekly for strategy. FineReport allows you to schedule reports, so they run automatically and reach the right people on time. Train your team to read and use these reports for better decisions. Monitor your reporting system and make improvements as your business grows.
Follow these best practices to ensure accuracy and clarity in your MIS reports:
Using tools like FineReport and following these steps, you master how to prepare an MIS report that supports strong business decisions.
You often face challenges when you try to bring together data from different sources. Many organizations struggle to link their MIS with existing systems. You might find that your sales, finance, and inventory systems do not communicate well. This can lead to inconsistent or incomplete data in your reports. When you cannot combine all your information, your MIS loses value. You need a solution that connects databases, spreadsheets, and cloud services with ease.
Accurate data is the foundation of reliable MIS reports. If your data is incomplete or contains errors, your reports will not reflect the true state of your business. You may overlook data cleaning or validation, which leads to mistakes in your analysis. Poor data quality can cause you to make the wrong decisions. You must ensure that your data is consistent, up-to-date, and secure.
Tip: Regularly review and clean your data to maintain high-quality MIS reports.
Even the best MIS will not help if your team does not use it. Many users resist new systems because they lack training or do not see the value. Inadequate training and poor change management can cause underutilization. You need to engage stakeholders early and provide clear instructions. When users understand how MIS reports help them, they are more likely to adopt the system.
FanRuan solutions, such as FineReport, help you overcome these challenges. FineReport supports all mainstream databases, so you can integrate data from many sources with a single click. The platform simplifies deployment and reduces maintenance costs. You can use open APIs to customize your MIS reports quickly. FineReport also offers rich data entry controls, including validation and temporary storage, which improve data quality. With these features, you create accurate, timely, and actionable MIS reports that your team will trust and use.
With FanRuan, you turn data integration and quality challenges into strengths, making your MIS a powerful tool for business success.
MIS reports give you a single source of reliable information, helping you reduce errors and improve efficiency. You can quickly access vital data, automate workflows, and spot trends that drive business growth. With FanRuan and FineReport, you create and manage reports that support informed decision-making. These tools help you analyze customer behavior, track operations, and respond to market changes. Explore MIS reporting tools and best practices to elevate your business intelligence and stay ahead in a competitive market.

The Author
Lewis
Senior Data Analyst at FanRuan
Related Articles

11 Best Data Management Tool Options Compared in 2026: Features, Pros, Cons & Use Cases
Compare the best data management tools for 2026. Review features, pros, cons, and ideal use cases for platforms like FineBI, Microsoft Purview, and Talend.
Lewis Chou
Apr 26, 2026

7 Best Data Governance Platforms Compared: Pros, Cons, and Which Teams They Fit Best
A data governance platform is software that helps organizations define, manage, monitor, and enforce how data is cataloged, accessed, trusted, and used across the business. 7 best data governance platforms compared at a
Howard Chu
Apr 20, 2026
What is a data management platform in 2025
A data management platform in 2025 centralizes, organizes, and activates business data, enabling smarter decisions and real-time insights across industries.
Howard
Dec 22, 2025


