You need a clear metric to measure how your equipment performs on the shop floor in Malaysia. OEE, or overall equipment effectiveness, gives you that insight. The oee definition combines availability, performance, and quality to show how well your equipment supports manufacturing productivity. When you track oee, you find hidden losses in your production process in Malaysia. Many manufacturers boost oee by focusing on equipment maintenance and process changes. In real-world manufacturing, improving oee often leads to lower costs, better product quality, and stronger competitiveness. High oee helps you respond to changing production demands and keeps your equipment running at its best.
OEE Definition
What Is OEE?
You need a clear way to measure how well your equipment supports your manufacturing process. The oee definition gives you a standardized method to do this. Overall equipment effectiveness (OEE) measures how much of your scheduled production time is truly productive. You calculate oee by multiplying three factors: availability, performance, and quality. When you reach an oee score of 100%, your equipment produces only good parts, at maximum speed, with no downtime.
Here is a quick breakdown of the three components:
| Component | Definition | Formula/Explanation |
|---|---|---|
| Availability | Proportion of scheduled production time equipment is operating | Operating Time / Scheduled Production Time |
| Performance | Speed of equipment compared to its designed maximum | Actual Output / Theoretical Maximum Output |
| Quality | Ratio of good, defect-free products to total products produced | Good Units Produced / Total Units Produced |
OEE acts as a key metric for understanding how well your equipment supports your manufacturing process in Malaysia. It helps you see where you lose efficiency and where you can improve.
Why OEE Matters in Manufacturing
OEE is a critical performance metric in manufacturing. You use it to see how effectively your equipment runs during production. High oee scores mean your equipment operates with fewer stops, faster speeds, and fewer defects. This leads to better manufacturing efficiency and higher operational efficiency.
When you track oee, you can compare your performance to industry benchmarks. Many manufacturers aim for an oee score of 85% or higher, which is considered world class. Most production lines operate at about 60%, so there is often room for improvement. By focusing on oee, you can reduce downtime, increase throughput, and improve product quality in Malaysia.
You can use oee to identify losses in your manufacturing processes in Malaysia. These losses often come from equipment breakdowns, slow cycles, or quality problems. When you improve oee, you see real results: less waste, more good products, and a smoother manufacturing process. OEE gives you a clear path to boost efficiency and stay competitive in the manufacturing industry in Malaysia.
OEE Formula
You can use the oee formula to measure how well your equipment performs on the shop floor. This formula combines three important factors: availability, performance, and quality. When you multiply these three numbers together, you get your oee percentage. This number shows how much of your scheduled production time actually produces good products at the right speed.
Here is the standard oee formula:
- OEE = Availability × Performance × Quality
Let’s break down each part so you can see how to calculate and improve your oee.
Availability
Availability tells you how much of your planned production time your equipment actually runs. You calculate availability by dividing the actual run time by the planned production time. Run time means the time your equipment operates without stops. Planned production time is the total time you schedule for production.
Formula:
Availability = (Run Time / Planned Production Time) × 100
You lose availability when your equipment stops unexpectedly or when you need to change over to a new product. Common causes include equipment breakdowns, material shortages, and setup or adjustment time. Even planned stops, like cleaning or scheduled maintenance, reduce your available production time. If you want to improve availability, you need to reduce both unplanned and planned stops.
FineReport by FanRuan can help you track every minute of downtime. You can use its real-time dashboards to see when and why your equipment stops. This makes it easier to spot patterns and fix problems quickly.

Performance
Performance measures how fast your equipment runs compared to its ideal speed. You calculate performance by dividing the actual output by the theoretical maximum output. If your equipment runs slower than its best speed, your performance drops.
Formula:
Performance = (Actual Output / Theoretical Maximum Output) × 100
You lose performance when your equipment runs below its top speed. This can happen because of minor stops, slow cycles, or operational inefficiencies. For example, if your machine should produce 100 units per hour but only makes 80, your performance is 80%. You need to watch for speed losses and find ways to keep your equipment running at its best.
With FineReport, you can collect oee data automatically from your machines. The system compares actual production rates to target rates and highlights any slowdowns. You can use this information to adjust processes and boost your performance.

Quality
Quality shows the percentage of good products your equipment produces. You calculate quality by dividing the number of good units by the total number of units produced. Only products that meet your standards count as good units.
Formula:
Quality = (Good Units Produced / Total Units Produced) × 100
You lose quality when you produce defective products or need to rework items. Common sources of quality loss include process variation, material defects, and human error. For example, if you make 1,000 units but only 950 pass inspection, your quality is 95%. High quality means less waste and more value from your production line in Malaysia.
FineReport helps you monitor quality in real time. You can set up digital checklists and automated alerts for defects. This lets you catch problems early and keep your quality high.
Tip:
When you use FineReport by FanRuan, you can automate oee data collection and calculation. The platform connects to your equipment, gathers real-time data, and displays your oee percentage on easy-to-read dashboards. This saves you time and helps you make better decisions to improve availability, performance, and quality.
Calculating OEE
Step-by-Step Guide
You can use a simple oee calculation to measure how well your equipment in Malaysia performs. Follow these steps for the preferred oee calculation in your manufacturing process in Malaysia:
Determine Planned Production Time
Start by calculating your total shift length and subtracting any planned breaks.Example: 480 minutes shift − 60 minutes breaks = 420 minutes planned production time.
Calculate Run Time
Subtract all stop time (planned and unplanned) from your planned production time.Example: 420 minutes − 47 minutes stop time = 373 minutes run time.
Count Good Units
Subtract the number of rejected units from the total produced.Example: 19,271 total − 423 rejects = 18,848 good units.
Calculate Availability
Divide run time by planned production time.Availability = 373 / 420 = 88.81%
Calculate Performance
Multiply ideal cycle time by total count, then divide by run time (in seconds).Performance = (1.0 sec × 19,271) / (373 × 60) = 86.11%
Calculate Quality
Divide good units by total units produced.Quality = 18,848 / 19,271 = 97.80%
Calculate OEE
Multiply availability, performance, and quality.OEE = 88.81% × 86.11% × 97.80% = 74.79%
This preferred oee calculation gives you a clear oee percentage for your equipment.
Example Calculation
Let’s look at a practical oee calculation example. Here is a table showing weekly oee results for a production line:
| Week | Availability (%) | Performance (%) | Quality (%) | OEE (%) |
|---|---|---|---|---|
| 1 | 92 | 85 | 98 | 74.6 |
| 2 | 88 | 80 | 95 | 59.2 |
| 3 | 93 | 87 | 99 | 79.2 |
| 4 | 90 | 82 | 97 | 72.3 |
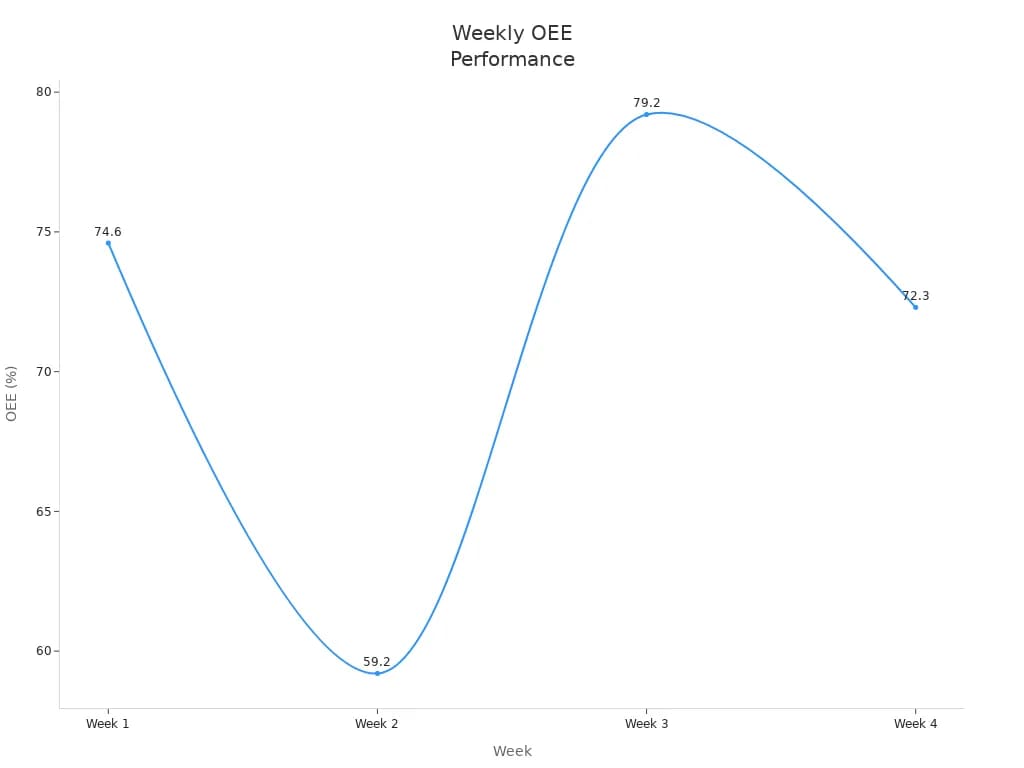
You can track oee over time to spot trends and target improvements. FineReport dashboards help you visualize oee metrics in real time. Here’s how you benefit:
- FineReport pulls oee data from multiple sources and displays it on interactive dashboards.
- You see oee percentage, availability, performance, and quality at a glance.
- Dashboards highlight patterns, making it easy to identify issues and act quickly.
With FineReport, you make data-driven decisions and improve your preferred oee calculation process.

OEE Benchmarks in Manufacturing
Industry Standards
You need to understand how your OEE score compares to others in the manufacturing industry in Malaysia. OEE benchmarks help you set realistic goals and measure progress. Most manufacturers start with OEE scores between 40% and 60%. This range is common for facilities that are just beginning to track OEE or have not yet focused on improvement. As you work to reduce downtime, improve quality, and speed up your production, you can expect your OEE score to rise.
OEE benchmarks can vary by industry and by the type of manufacturing process you use in Malaysia. Discrete manufacturing, which produces individual items like cars or electronics, often has lower OEE scores because of complex setups and frequent changeovers. Process manufacturing, such as food or chemicals, may achieve higher OEE scores since the production flow is more continuous. You should always compare your OEE to similar operations and consider your unique challenges.
Here is a table to help you see how OEE scores are typically classified:
| OEE Category | Score Range | Description |
|---|---|---|
| Elite | 85% - 90% | World-class performance, very high efficiency and quality. |
| Good | 60% - 85% | Achievable with focused improvements, balanced optimization. |
| Average | 40% - 60% | Common starting point, significant room for improvement. |
Note: Industry-specific factors, such as product complexity and production methods, affect what OEE score you can realistically achieve.
What Is a Good OEE Score?
You might wonder what OEE score you should aim for in your manufacturing process in Malaysia. A high OEE score, such as 85%, is considered world-class. This level means your equipment runs with minimal downtime, at top speed, and produces almost no defects. Most manufacturers find their initial OEE scores closer to 60%. This is a solid starting point and shows you have opportunities to boost manufacturing efficiency.
You should not expect to reach 100%. That score means perfect production, which is nearly impossible in real-world conditions in Malaysia. Instead, set incremental goals based on your current performance. For example:
- 100%: Perfect production, no downtime or defects—rarely achieved.
- 85%: World-class, realistic for top-performing manufacturers.
- 60%: Good, but you can still improve.
- 40%: Typical for first-time OEE tracking, lots of potential for growth.
Malaysia's manufacturing leaders use OEE data to guide decisions and drive operational efficiency. They rely on real-time monitoring and digital dashboards to spot issues quickly and keep production on track. You can follow their example by using OEE as a tool for continuous improvement, not just as a number to chase.
Improving OEE with FanRuan
Boosting Availability
You can boost availability by focusing on proactive strategies that keep your equipment running and reduce downtime. Here are some proven methods:
- Schedule proactive maintenance and use predictive tools to prevent unexpected breakdowns.
- Monitor equipment in real time to track uptime and downtime, responding quickly to any issues.
- Train your workforce to operate and maintain equipment efficiently.
- Use digital platforms for workflow documentation, maintenance scheduling, and issue reporting.
- Analyze data regularly to find inefficiencies and improve processes.
Digital transformation and automation play a big role in improving oee in Malaysia manufacturing. When you automate processes, you reduce manual labor and human error. Smart manufacturing technologies, like real-time data analysis and predictive maintenance, help you minimize downtime and keep your equipment available in Malaysia.
FanRuan’s FineReport gives you powerful tools for real-time monitoring and loss analysis. You can track system load, memory, and CPU utilization. The platform sends alerts by SMS or email when thresholds are exceeded, so you can act fast. FineReport also provides detailed logs and automatic system restarts to handle downtime. Its cluster solution ensures high availability by switching to backup nodes if one fails, so your operations stay uninterrupted. With real-time inventory dashboards, you can monitor stock levels and avoid shortages, further improving availability in Malaysia.

Tip: Real-time OEE tracking with FineReport helps you detect issues early, plan predictive maintenance, and reduce downtime. This approach increases equipment availability and supports continuous improvement.
Enhancing Performance
You can enhance performance by making your manufacturing processes more efficient and responsive. Try these actionable steps:
- Hold regular meetings with procurement and supply chain teams to review key performance indicators and spot areas for improvement.
- Implement a quality management system with standard operating procedures and controls.
- Invest in employee training, including cross-training and mentorship programs.
- Upgrade to energy-efficient equipment to boost output and reduce costs.
- Use data analytics to track performance, predict maintenance needs, and find cost-saving opportunities.
- Apply lean manufacturing principles to identify value, map the value stream, and eliminate bottlenecks.
- Set clear goals for each shift and use digital tools to monitor progress.
FineReport supports you by providing interactive dashboards and customizable reports. You can integrate real-time data from multiple sources, ensuring you always have accurate information. Automated reporting saves time and lets your team focus on higher-value tasks. The platform’s mobile compatibility and collaboration tools make it easy to access and share performance data, even on the go. These features help you make data-driven decisions and improve productivity in Malaysia.

Note: Real-time OEE monitoring with FineReport allows you to spot slow cycles, small stops, and other performance losses as they happen. You can address these issues quickly and keep your equipment running at its best.
Increasing Quality
You can increase quality by building a culture of continuous improvement and using advanced quality control methods in Malaysia. Here are some best practices:
- Implement Total Quality Management to encourage ongoing improvement and employee involvement.
- Adopt lean manufacturing to reduce waste and optimize resources.
- Manage supplier quality through onboarding, performance evaluation, and collaboration.
- Conduct regular audits and inspections to catch quality issues early.
- Use statistical process control to monitor production and support corrective actions.
- Apply corrective and preventive actions based on root cause analysis.
- Train employees on quality standards and procedures.
- Use advanced quality control tools, such as automation and AI, to enhance defect detection.
FineReport helps you monitor quality in real time. You can set up automated alerts for defects and track quality metrics across your production lines. The platform supports traceability by labeling products with detailed production information, making it easier to isolate errors. You can also create systems for reporting defects and addressing them quickly.
Callout: Many manufacturing clients have used FineReport to improve oee by reducing defects and increasing first-pass yield. Real-time dashboards and automated alerts help teams catch problems early and maintain high quality standards in Malaysia.
| OEE Factor | Loss Type | Description | Typical Causes |
|---|---|---|---|
| Availability | Planned Stops | Scheduled downtime (maintenance, breaks) | Setup/changeovers, operator breaks |
| Availability | Unplanned Stops | Unexpected downtime | Equipment failure, material shortages |
| Performance | Slow Cycles | Equipment runs slower than ideal | Worn parts, poor materials |
| Performance | Small Stops | Short unplanned stops | Jams, quick cleaning |
| Quality | Startup Defects | Defects during startup or setup | Warmup, initial instability |
| Quality | Production Defects | Defects during stable production | Misconfiguration, human error |
You can use this table to identify where you lose oee and target your improvement efforts.
By using FanRuan’s FineReport, you gain real-time visibility into every aspect of your manufacturing process in Malaysia. You can monitor availability, performance, and quality, analyze losses, and make informed decisions. Many manufacturers have improved oee in manufacturing by adopting FineReport for predictive maintenance, automated quality checks, and continuous process optimization. These strategies help you improve productivity, enhance product quality, and stay competitive in today’s market in Malaysia.
You can achieve long-term success in manufacturing when you understand and optimize overall equipment effectiveness in Malaysia. Applying the OEE formula and industry benchmarks helps you:
- Increase throughput with the same resources, supporting revenue growth.
- Gain operational visibility for better decision-making and continuous improvement.
- Reduce waste and optimize resources, which accelerates value delivery.
- Lower costs and improve product quality, strengthening your competitive position.
- Support sustainability by minimizing energy use and waste.
- Build a culture of accountability and ongoing improvement.
- Sustained improvement leads to cost savings and better resource use.
- You can extend equipment life and defer large investments.
- Predictive maintenance becomes easier, helping you avoid unexpected downtime.
- Higher efficiency lets you deliver products faster and with better quality.
FineReport from FanRuan gives you the tools for real-time tracking and actionable insights. Start assessing your processes today and take steps to enhance your results.
Click the banner below to try FineReport for free and empower your enterprise to transform data into productivity!

Continue Reading About OEE
How to Create a Manufacturing Dashboard (Step-by-Step Guide)


FAQ

The Author
Lewis
Senior Data Analyst at FanRuan
Related Articles

What Is a Data Management Framework? 7 Core Components Every Beginner Should Know
A $1 is the structure an organization uses to manage data consistently, safely, and usefully across the business. If you are new to the topic, the simplest way to think about it is this: a framework is the operating mode
Howard Chu
Jun 03, 2026

Data Governance Financial Services: A Practical Beginner’s Guide to Frameworks, Roles, and Policies
Financial institutions run on data. Customer records, transactions, risk models, product data, collateral details, claims, positions, and regulatory submissions all depend on information being accurate, consistent, secur
Howard Chu
Jun 03, 2026
AI Data Catalog: What It Is, How It Works, and Why It’s Not Just a Chatbot Overlay
An $1 helps enterprises find, understand, and trust data faster by combining metadata management, governance, lineage, and AI driven discovery in one governed system. For IT managers, data leaders, and analytics teams, t
Saber Chen
May 28, 2026