

Data insights represent actionable information derived from analyzing raw data. They help you uncover patterns, trends, and relationships that might otherwise remain hidden. By leveraging these insights, you can make decisions rooted in evidence rather than assumptions. For example, 56% of organizations report improved decision-making when they use data insights effectively.
Aligning decisions with strategic goals becomes easier when you rely on data. You can define objectives, measure progress with key metrics, and develop a focused data strategy. However, challenges like poor data quality, outdated technology, and data silos can hinder this process. Addressing these barriers ensures that your insights drive meaningful outcomes.
What Are Data Insights?
Defining Data Insights
Data insights refer to actionable information derived from analyzing raw data. They help you uncover patterns, trends, and relationships that guide better decision-making. Unlike raw data, which consists of unprocessed facts and figures, insights provide context and meaning. For example, analyzing customer purchase history can reveal buying patterns, helping you predict future behavior. Common methods to define and identify insights include surveys, focus groups, and big data analytics. These approaches allow you to transform raw data into meaningful insights that drive action.
Key Characteristics of Data Insights
Effective data insights share several key characteristics. First, they are actionable, meaning they provide clear guidance for decision-making. Second, they are relevant, addressing specific questions or challenges. Third, they are timely, ensuring you can act on them when needed. Additionally, insights are accurate, based on reliable data sources and thorough analysis. For instance, using machine learning and AI can enhance accuracy by identifying patterns in large datasets. Lastly, they are easy to understand, often presented through visualizations like charts or graphs.
How Data Insights Differ from Raw Data
Raw data and actionable insights serve different purposes. Raw data consists of unprocessed facts and figures, such as sales numbers or website clicks. It lacks context and meaning on its own. In contrast, insights are derived from analyzing and interpreting raw data. They explain observed patterns and identify opportunities for action. For example, while raw data might show a spike in website traffic, insights reveal the cause, such as a successful marketing campaign. Insights enable you to make informed decisions, while raw data serves as the foundation for analysis.
The Importance of Data Insights in Decision-Making
Enhancing Decision Accuracy
Data insights improve the accuracy of your decisions by providing actionable information based on facts rather than assumptions. When you rely on data-driven decision-making, you can identify patterns and trends that guide your actions. For instance:
- Companies using data insights are 23 times more likely to acquire customers.
- They are 6 times more likely to retain customers.
- They are 19 times more likely to achieve profitability.
Additionally, organizations leveraging data analytics report a 5-6% higher productivity rate compared to those that do not. These statistics highlight how data insights empower you to make precise and informed choices, ultimately driving better outcomes.
Reducing Bias in Decision-Making
Bias can distort your decisions, but data insights help minimize these errors. By analyzing data objectively, you can avoid common pitfalls such as:
- AI infallibility bias, where you might overly trust AI-generated results.
- Optimist bias, which leads to overly positive interpretations while ignoring risks.
- Preprocessing bias, where decisions made during data preparation affect fairness.
Using data insights ensures that your decisions are grounded in evidence, reducing the influence of subjective opinions or hidden agendas. This approach fosters fairness and transparency, especially when dealing with complex scenarios.
Driving Strategic and Competitive Advantages
Data insights give you a competitive edge by helping you understand customer behavior and market trends. For example, analyzing purchasing patterns allows you to predict future needs. Real-time data analysis enhances customer satisfaction by anticipating their desires. Additionally, monitoring transactional data helps detect fraud, reducing financial risks. Below is the Real-Time Analysis of FineBI.

By integrating business intelligence tools, you can align your strategies with market demands and stay ahead of competitors. Data insights not only improve your operational efficiency but also position your organization as a leader in the industry.
Types of Data Analytics That Generate Insights

Descriptive Analytics
Descriptive analytics helps you understand what happened in the past by summarizing historical data. It provides a clear picture of trends, patterns, and outcomes. For example, you can analyze sales data to identify which products performed best last quarter. This type of analysis often uses real-time data and statistics to give you a snapshot of your business performance. Tools like dashboards and reports make it easier to visualize this information.
Descriptive analytics forms the foundation for deeper analysis. It answers questions like, "What were our monthly sales?" or "How many customers visited our website last week?" By focusing on past events, it allows you to track progress and measure success over time.
Diagnostic Analytics
While descriptive analytics tells you what happened, diagnostic analytics explains why it happened. This type of analysis dives deeper into the data to uncover root causes. For instance:
- Descriptive analytics might show a drop in website traffic.
- Diagnostic analytics would explore why the traffic decreased, such as identifying a technical issue or ineffective marketing campaign.
Diagnostic analytics often involves advanced techniques like data mining and correlation analysis. It helps you identify relationships between variables and pinpoint the factors driving specific outcomes. By understanding the "why," you can address problems and make informed adjustments to your strategies.
Predictive Analytics
Predictive analytics takes things a step further by forecasting future outcomes based on historical data. It uses techniques like machine learning and statistical modeling to generate actionable insights. For example:
- Seebo reduced downtime by over 83% and achieved a 72% cost savings using predictive analytics.
- Amazon optimized inventory management by anticipating customer demand.
- Airbnb attributed its 43,000% growth rate over five years to predictive analytics and machine learning.
This type of analysis empowers you to make proactive decisions. You can predict customer behavior, optimize operations, and stay ahead of market trends. Predictive analytics transforms raw data into valuable insights that drive growth and efficiency.
Prescriptive Analytics
Prescriptive analytics takes data analysis to the next level by not only predicting future outcomes but also recommending actions to achieve desired results. It uses advanced techniques like machine learning, optimization algorithms, and simulation models to provide actionable guidance. This type of analytics empowers you to make decisions that maximize efficiency and minimize risks.
One of the key benefits of prescriptive analytics is its ability to create repeatable and scalable processes. By running simulations and what-if analyses, you can test different scenarios and identify the best course of action. For example, businesses can optimize pricing strategies, improve marketing campaigns, and enhance sales performance. This approach ensures that every decision aligns with your return on investment (ROI) goals.
Prescriptive analytics also helps you manage risks effectively. It analyzes data to detect potential fraud, reduce uncertainties, and optimize investments. For instance, in the banking sector, it identifies risks like anti-money laundering and enhances customer relationship management. Similarly, in healthcare, it improves patient outcomes by evaluating treatment options and monitoring costs.
Industries like airlines and marketing also benefit significantly. Airlines use prescriptive analytics to adjust ticket prices dynamically based on demand and market conditions. Marketers leverage it to target specific demographics and optimize campaign effectiveness. These applications demonstrate how prescriptive analytics drives agility and strategic planning across various sectors.
By integrating prescriptive analytics into your decision-making process, you can achieve long-term success. It enables you to simulate market shifts, make near-time decisions, and collaborate across teams. This approach not only enhances operational efficiency but also positions your organization for sustained growth.
Methods for Gathering and Analyzing Data Insights
Traditional Methods
Surveys and Questionnaires
Surveys and questionnaires are among the most common ways of gathering data insights. These tools allow you to ask direct questions to collect quantitative information about consumer preferences, behaviors, and opinions. For example, you can use online surveys to understand customer satisfaction or product feedback. This method is straightforward and cost-effective, making it ideal for businesses of all sizes.
Focus Groups
Focus groups provide qualitative insights by engaging small groups in discussions about products or services. These sessions help you explore customer perceptions, motivations, and expectations in depth. For instance, a focus group might reveal why customers prefer one product feature over another. This method offers valuable context and helps you understand the "why" behind customer choices.
| Method | Description |
|---|---|
| Surveys and Questionnaires | Directly asking questions to gather quantitative data on consumer preferences, behaviors, and opinions. |
| Focus Groups | Small group discussions providing qualitative insights on products or services, offering depth and context. |
| Historical Data Analysis | Examining past sales and performance metrics to identify trends and patterns for informed decision-making. |
Modern Methods
Big Data Analytics
Big data analytics allows you to process and analyze massive datasets to uncover patterns, trends, and correlations. This method provides deeper insights and enables real-time decision-making. For example, analyzing social media data can help you track customer sentiment and market trends. Big data analytics is faster and more scalable than traditional methods, making it essential for modern businesses.
Machine Learning and AI
Machine learning and AI enhance the accuracy of data insights by automating the analysis process. These technologies identify hidden patterns in large datasets and predict future outcomes. Over time, the algorithms improve their accuracy without manual intervention. For instance:
- Machine learning and AI automate the generation of insights and predictions.
- These technologies analyze large datasets to uncover hidden patterns.
- The algorithms improve their accuracy over time.
Tools and Technologies for Data Analytics
Several tools and technologies simplify the process of gathering data insights. Popular options include:
- Microsoft Power BI: A platform for creating reports and dashboards.
- Tableau: A well-known tool for data visualization and analysis.
- SAP BusinessObjects: Applications for data discovery and reporting.
- Sisense: A platform for visualizing business data with interactive dashboards.
- TIBCO Spotfire: Offers AI-powered insights and natural language search.
- Qlik: A self-service analytics platform for cloud and on-premises use.
- SAS Business Intelligence: Applications for self-service analytics.
- Thoughtspot: Allows exploration of data through reports and AI insights.
These tools enable you to analyze data efficiently, visualize insights, and make informed decisions. As analytics trends evolve, tools like these will continue to support adaptive and real-time decision-making.
Best Practices for Leveraging Data Insights
Setting Clear Objectives for Analysis
To make the most of your data, you need clear objectives for your analysis. Without a defined purpose, your efforts may lack direction and fail to deliver actionable insights. Follow these steps to set effective objectives:
- Understand the goals of your analysis.
- Identify the questions you aim to answer.
- Assess the data you have available.
- Determine the insights you want to uncover.
- Define the scope of your analysis.
For example, if you want to improve customer retention, focus on analyzing customer behavior and identifying patterns that lead to churn. By setting clear objectives, you ensure your analysis aligns with your strategic goals and delivers meaningful results.
Ensuring Data Quality and Relevance
High-quality data is essential for generating reliable insights. Poor data quality can lead to inaccurate conclusions and misguided decisions. To ensure your data remains accurate and relevant, consider these practices:
- Establish clear data governance policies.
- Validate data at entry points to prevent errors.
- Regularly cleanse and remove duplicate data.
- Appoint a data steward to oversee data quality.
- Conduct regular reviews to identify and address issues.
- Use a robust data quality management solution.
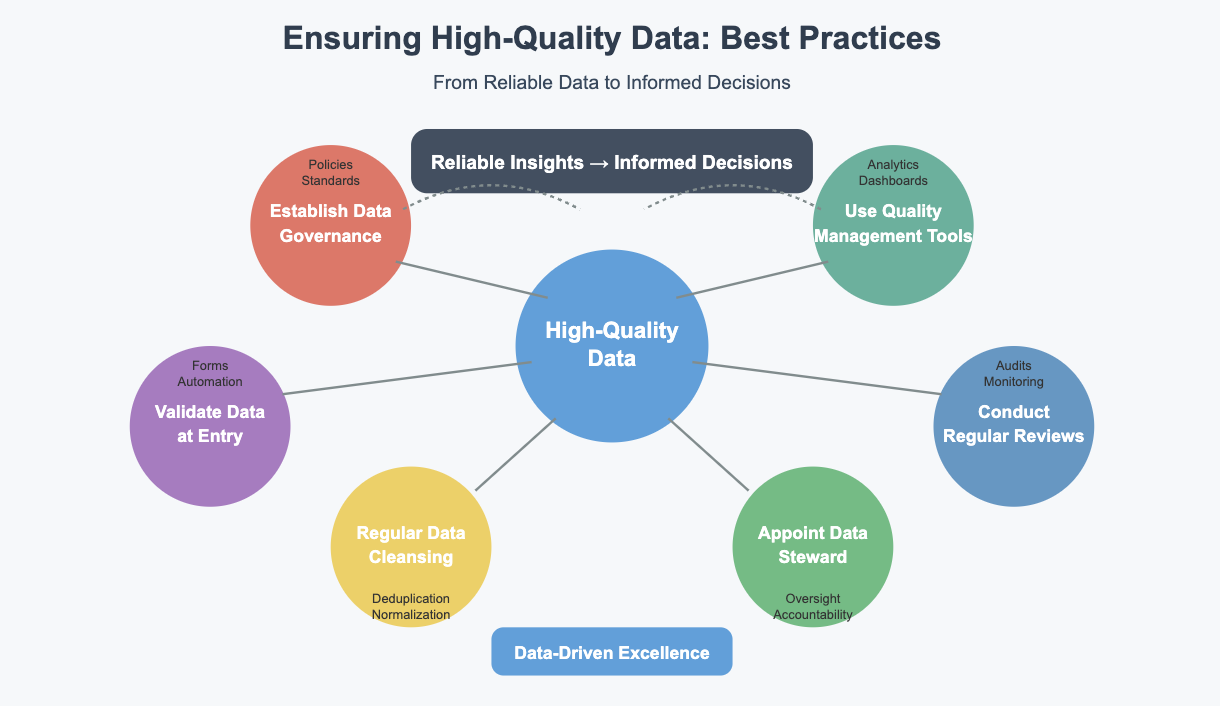
For instance, implementing data validation processes can prevent errors during data collection. Regular reviews help you maintain data relevance, ensuring your insights remain actionable and trustworthy.
Visualizing Insights for Better Understanding
Data visualization transforms complex information into easy-to-understand visuals. This approach simplifies interpretation and enhances decision-making. Key benefits of visualizing insights include:
- Simplifying complex data for better understanding.
- Revealing patterns, correlations, and trends.
- Highlighting key insights for faster decisions.
- Engaging stakeholders with memorable visuals.
- Improving data accessibility and literacy.
Interactive dashboards, for example, allow you to monitor operations in real time and identify areas for improvement. Visualization tools also help you communicate insights effectively, making it easier to align teams and drive action.
Encouraging Cross-Team Collaboration
Cross-team collaboration plays a vital role in maximizing the value of data insights. When teams from different departments work together, they bring diverse expertise to the table. This collaboration ensures that the data you analyze is accurate, consistent, and actionable. For example:
- Teams can align on common goals, reducing inconsistencies in data interpretation.
- Shared accountability among departments improves data quality and builds trust.
- Diverse perspectives enhance the relevance of insights, leading to better decision-making.
Improved communication is another benefit of cross-functional collaboration. When teams share insights, they can identify opportunities to improve customer service and operational efficiency. For instance, marketing and sales teams can collaborate to analyze customer behavior, creating strategies that drive engagement. This alignment fosters a high-performance environment where innovation thrives.
To encourage collaboration, you can implement regular cross-departmental meetings. These sessions allow teams to share insights and discuss challenges. Additionally, providing training on data analytics tools ensures that all team members can contribute effectively. By fostering a culture of collaboration, you enable your organization to unlock the full potential of its data.
Continuously Monitoring and Updating Insights
Monitoring and updating your insights ensures they remain relevant and actionable. Data evolves over time, and outdated insights can lead to poor decisions. To maintain accuracy, follow these best practices:
- Conduct regular assessments to understand the types of data you have.
- Validate your data to ensure it meets quality standards.
- Monitor backups to confirm they are efficient and reliable.
- Detect unusual changes in file integrity to identify potential issues.
- Train employees on data security to prevent errors and breaches.
Regular updates also help you adapt to changing market conditions. For example, tracking customer preferences allows you to adjust your strategies in real time. Providing refresher courses on data analytics tools ensures your team stays proficient in interpreting insights. Establishing a feedback loop helps you refine your processes and address challenges effectively.
By continuously monitoring and updating your insights, you can make informed decisions that align with your goals. This proactive approach keeps your organization agile and competitive in a data-driven world.
Real-World Applications of Data Insights

Business: Enhancing Customer Experience
Data insights play a crucial role in improving customer experience by helping businesses understand their audience better. For example:
- A retail company uses machine learning to analyze customer purchase histories and online behaviors. This allows them to forecast purchasing patterns and tailor marketing messages, boosting sales and satisfaction.
- Netflix analyzes viewing patterns to provide personalized recommendations. This approach not only enhances user retention but also guides content development to align with audience preferences.
- An e-commerce site conducts A/B testing on homepage designs to determine which version improves user engagement. This leads to a more seamless and enjoyable shopping experience.
By leveraging these insights, you can anticipate customer needs, personalize interactions, and create a more engaging experience. These strategies help build loyalty and drive long-term success.
Healthcare: Improving Patient Outcomes
In healthcare, data insights enable providers to deliver better care and improve patient outcomes. Predictive analytics identifies health disparities, such as the higher likelihood of high blood pressure among Black Americans. This allows for targeted interventions to manage diseases more effectively.
Advanced tools like TransPRECISE analyze patient data to guide personalized medical decisions. For instance, a study in the Journal of Clinical Oncology Clinical Cancer Informatics demonstrated how this tool improved treatment effectiveness for over 7,700 patients. Additionally, data analytics supports public health initiatives by addressing widespread issues like mental health. These insights equip practitioners with the tools needed to tackle complex challenges and enhance care quality.
Marketing: Optimizing Campaign Performance
Data insights empower marketers to refine campaigns and achieve better results. For example:
- The East Nashville Campaign targeted price-sensitive demographics with specific ads, leading to a 200% increase in click-through rates and a 30% rise in on-page conversions.
- Hiresquare optimized its web copy using PPC data, improving SEO and understanding keyword effectiveness.
- pCloud streamlined its conversion funnel, reducing user steps and achieving a 135% increase in conversion rates.
By analyzing campaign performance, you can identify what works and adjust strategies accordingly. This ensures your marketing efforts resonate with your audience and deliver maximum impact.
Data insights are essential for making informed decisions that drive success. By investing in data analytics tools and fostering a data-driven culture, you can unlock up to a 20% increase in productivity and accelerate decision-making. Start small by identifying specific business problems and implementing advanced technologies like machine learning. Foster collaboration by embedding data translators within teams and providing training programs. These steps not only enhance your ability to adapt to insights but also position your organization to outperform competitors and innovate effectively.
FanRuan
https://www.fanruan.com/en/blogFanRuan provides powerful BI solutions across industries with FineReport for flexible reporting, FineBI for self-service analysis, and FineDataLink for data integration. Our all-in-one platform empowers organizations to transform raw data into actionable insights that drive business growth.
FAQ
Data insights help you make informed decisions by identifying patterns and trends. They reduce guesswork, improve accuracy, and minimize bias. Additionally, they enable you to align strategies with goals, optimize operations, and gain a competitive edge in your industry.
Small businesses can begin by collecting data from customer interactions, sales, or website analytics. Use tools like Google Analytics or Microsoft Power BI to analyze this data. Focus on specific goals, such as improving customer retention or increasing sales, to make the process manageable.
Follow these steps to maintain data quality:
No, data insights benefit businesses of all sizes. Small businesses can use affordable tools and focus on specific metrics to gain actionable insights. For example, analyzing customer feedback can help you improve products or services, regardless of your organization's size.


