Here are the 10 best BI tools for businesses in 2025:
You need reliable business intelligence software to stay ahead. The global BI market is now worth $33.3 billion, with self-service and mobile BI tools growing rapidly. These business intelligence tools deliver measurable results for business growth. Companies with data-driven CEOs are 77% more likely to succeed. See how BI tools can impact your business in the table below:
| Metric / Statistic | Value / Description |
|---|---|
| Success likelihood for companies with data-driven CEOs | 77% higher |
| Retailers increasing BI spending | 63% |
| Recruitment efficiency improvement at Geico | 15% |
| Average BI software spending per employee (2025) | $7.80 |
Choose the best business intelligence software by considering your business size, industry, and data needs. Many free options and free business intelligence tools are available, so you can start exploring BI for free before making a decision.
You face more data than ever before. Making sense of it can transform your business. Business intelligence tools help you turn raw data into actionable business insights. These tools let you analyze trends, spot opportunities, and avoid costly mistakes. When you use BI tools, you make data-driven decisions that improve accuracy and speed.
Companies that rely on data-driven decision-making see measurable results. For example, Netflix uses data to recommend content, leading to 80% of viewed shows coming from its recommendation engine. Amazon leverages data for personalized marketing and supply chain optimization, boosting sales and efficiency. Starbucks, Airbnb, and Shopify also use data to improve customer experiences and business outcomes.
Here is how leading companies benefit from business intelligence tools:
| Company | Data-Driven Impact |
|---|---|
| Netflix | 80% of viewed content comes from its recommendation engine, increasing engagement and retention |
| Amazon | Uses data for personalization and supply chain optimization, driving sales and efficiency |
| Stitch Fix | Personalizes fashion recommendations, improving customer satisfaction |
| Zillow | Predicts real estate market trends, helping users make better decisions |
You can see that data-driven decisions lead to better forecasting, improved operational efficiency, and stronger customer relationships. Real-time data processing allows you to respond quickly to market changes and reduce errors.
Business intelligence tools drive business growth by making your data accessible and useful. You gain a competitive edge when you use these tools to identify trends, measure performance, and manage risks. Cloud-based BI tools make it easier to scale and adapt as your business grows.
| Benefit Category | Statistic / Result |
|---|---|
| Forecasting Accuracy | Historical data analysis improves resource allocation |
| Operational Efficiency | Data analysis reduces costs and boosts productivity |
| Customer Insights | Personalization increases marketing success |
| Risk Management | Data enables proactive risk mitigation |
| Competitive Advantage | Data-driven strategies foster innovation |
You can use business intelligence tools to cut operational costs by 20%, increase profitability by 15%, and acquire new customers more easily. Real-time analytics help you spot fraud and optimize your supply chain. In every industry, from healthcare to retail, BI tools unlock the full value of your data and support business growth.

![]()
Microsoft Power BI stands out as one of the most widely adopted bi tools in 2025. You can connect to hundreds of data sources, create interactive reports, and access dashboards from any device. Power BI integrates seamlessly with Microsoft 365, making it easy for you to use Excel data and collaborate with your team. The platform supports real-time analytics, allowing you to monitor key metrics and receive instant alerts. Advanced AI features, such as Copilot, enable natural language queries and predictive analytics, helping you move from historical data to future planning.
Key Features:
Pros:
Cons:
Ideal Use Cases:
You benefit most from Power BI if you already use Microsoft products, need real-time insights, or want to empower both technical and non-technical users with accessible business intelligence tools.
Power BI dashboards provide dynamic, interactive, and real-time refreshing tiles that keep your insights current.
![]()
Tableau remains a leader in data visualization and analytics. You can use its drag-and-drop interface to build interactive dashboards and explore data visually. Tableau supports a wide range of data connectors, making it easy to blend data from multiple sources. The platform excels at advanced analytics and offers strong mobile support, so you can access dashboards on the go.
Key Features:
Pros:
Cons:
Ideal Use Cases:
Tableau works best for organizations that need rich data visualization, interactive reports, and advanced analytics across diverse data sources.
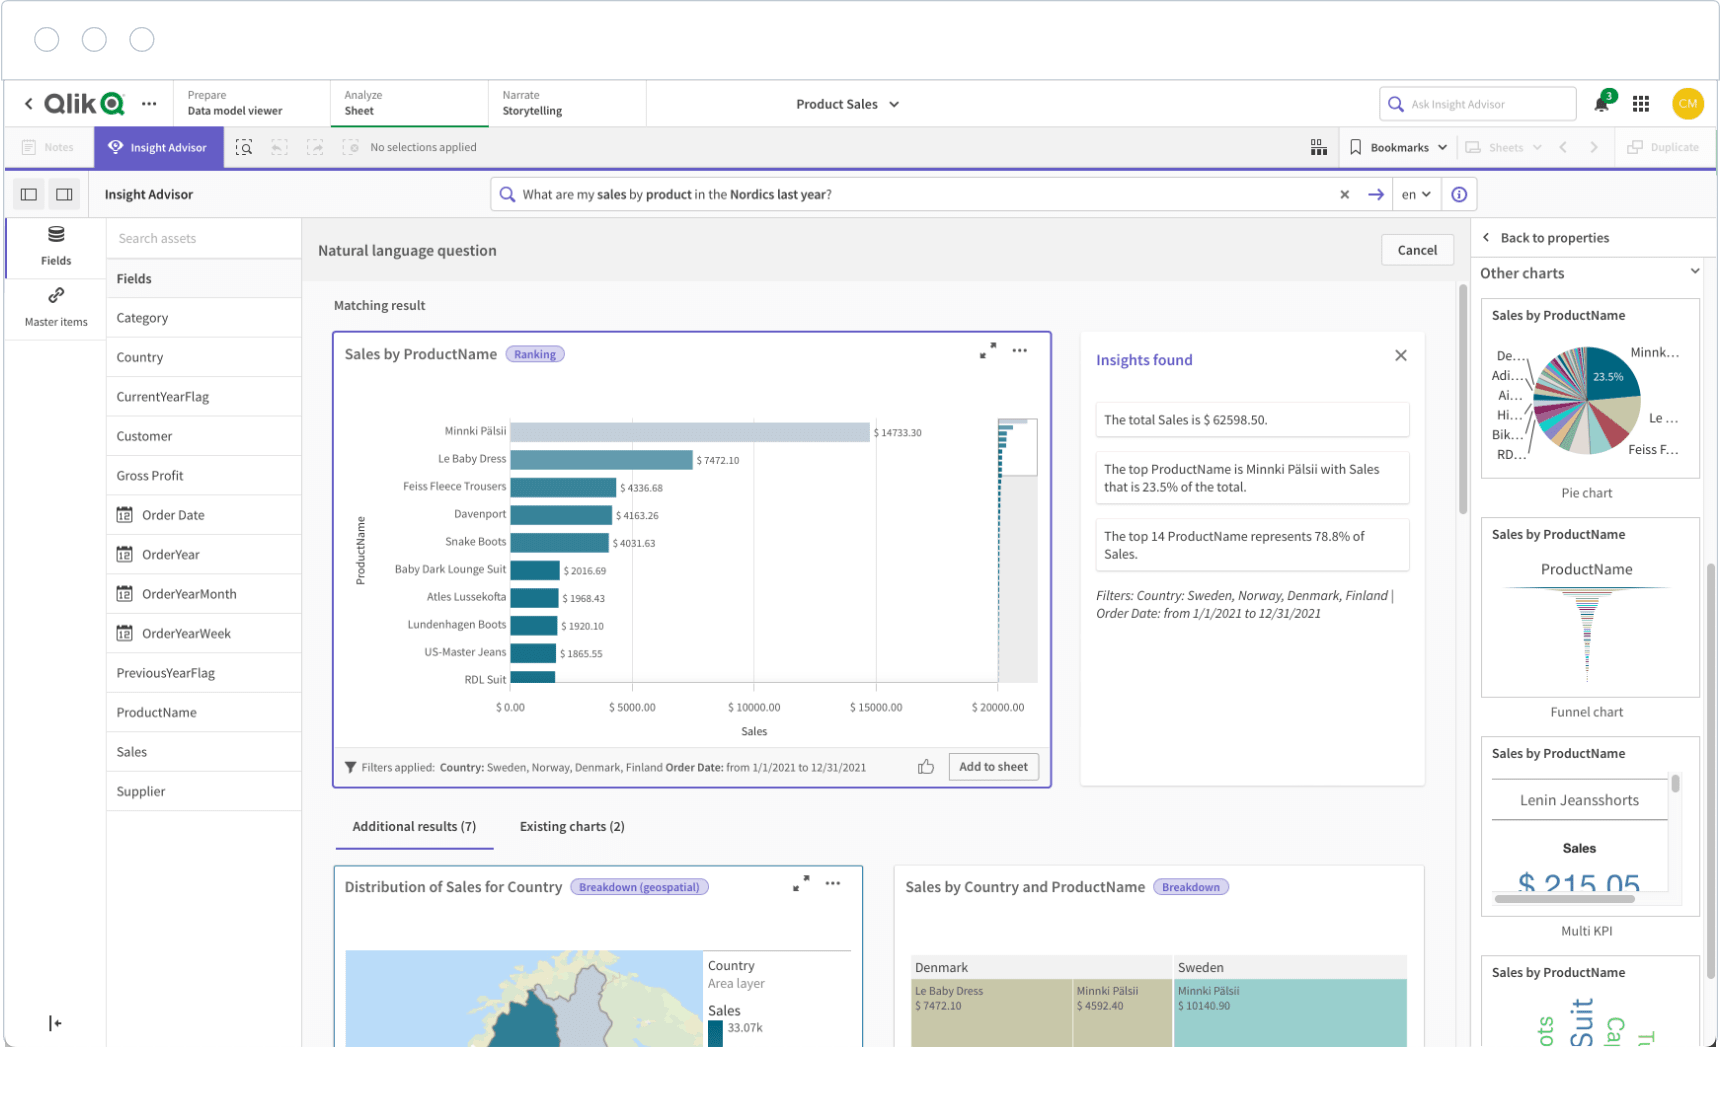
Qlik Sense offers a unique associative engine that lets you explore data from every angle. You can uncover hidden trends and relationships using its AI-driven analytics. Qlik Sense supports real-time analytics and provides a responsive mobile experience. The platform receives high marks for dashboard features, data connectors, and user satisfaction.
| Metric Category | 2025 Rating | Description |
|---|---|---|
| Business Value Created | 82-83 | High value for stakeholders |
| Usability and Intuitiveness | 80-81 | Easy to use and learn |
| Dashboard Features | 84 | Alerts, KPIs, interactive dashboards |
| Data Exploration & Visualization | 83 | Visual data manipulation |
| Positive User Sentiment | 91% | High satisfaction and loyalty |
Key Features:
Pros:
Cons:
Ideal Use Cases:
Qlik Sense suits businesses that need deep data exploration, real-time analytics, and high-quality dashboards for decision-making.
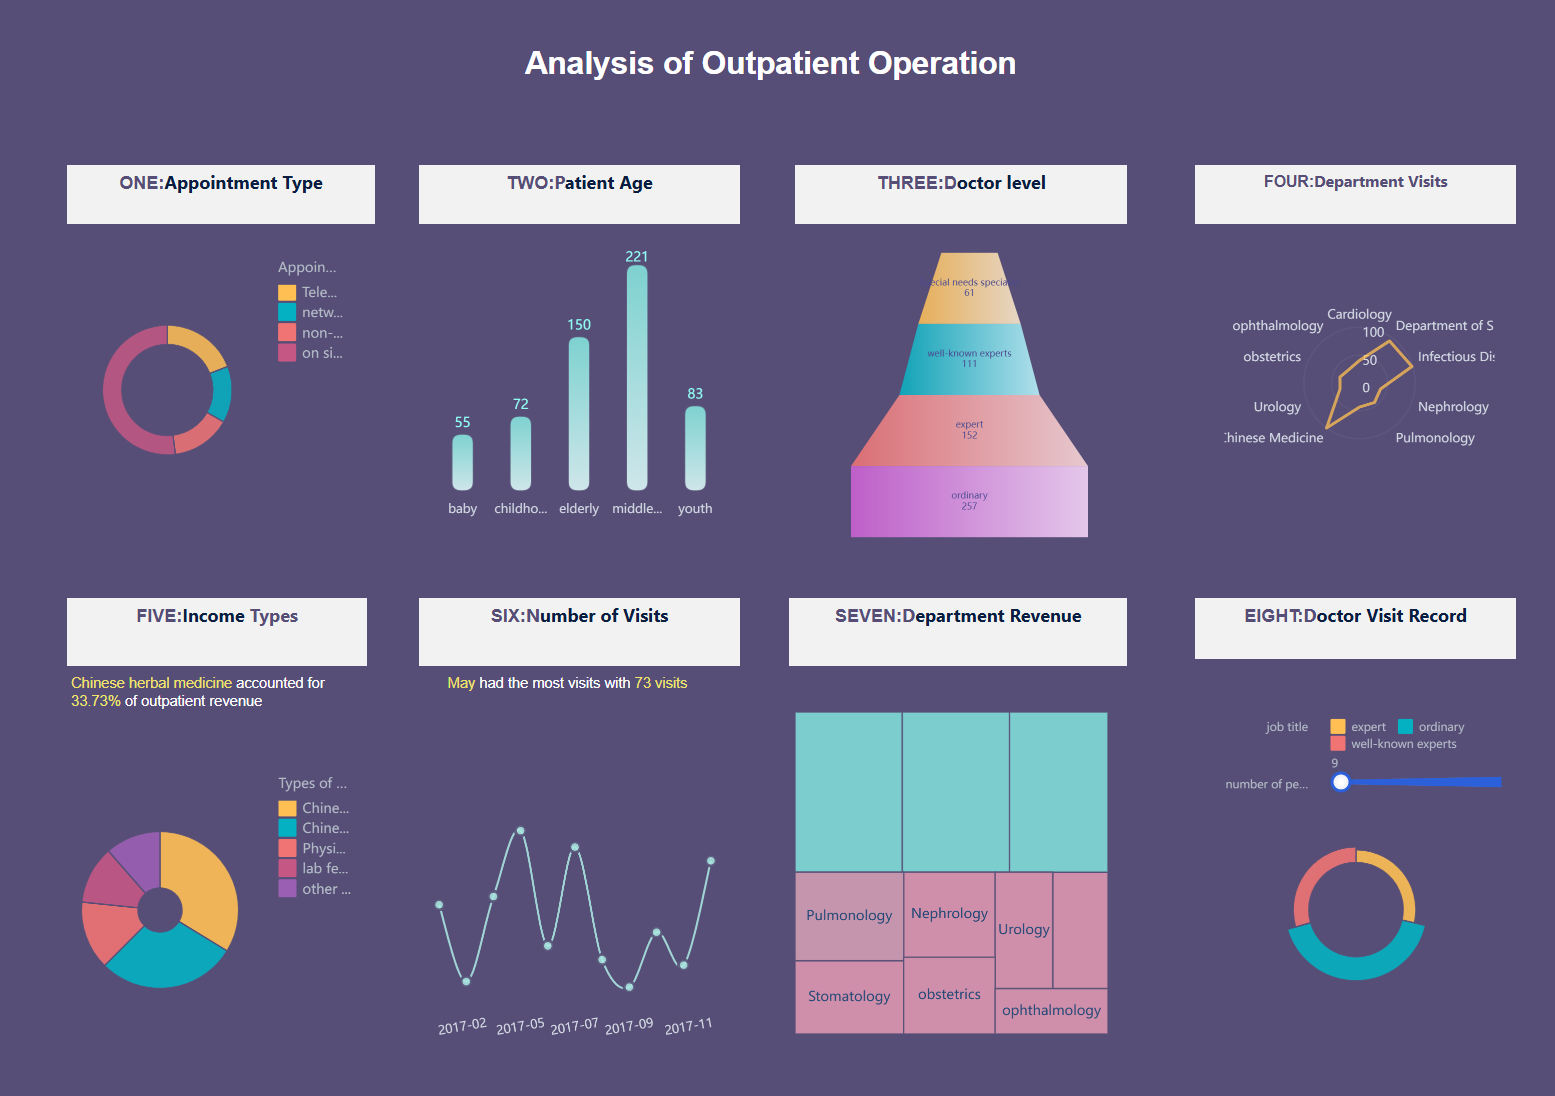
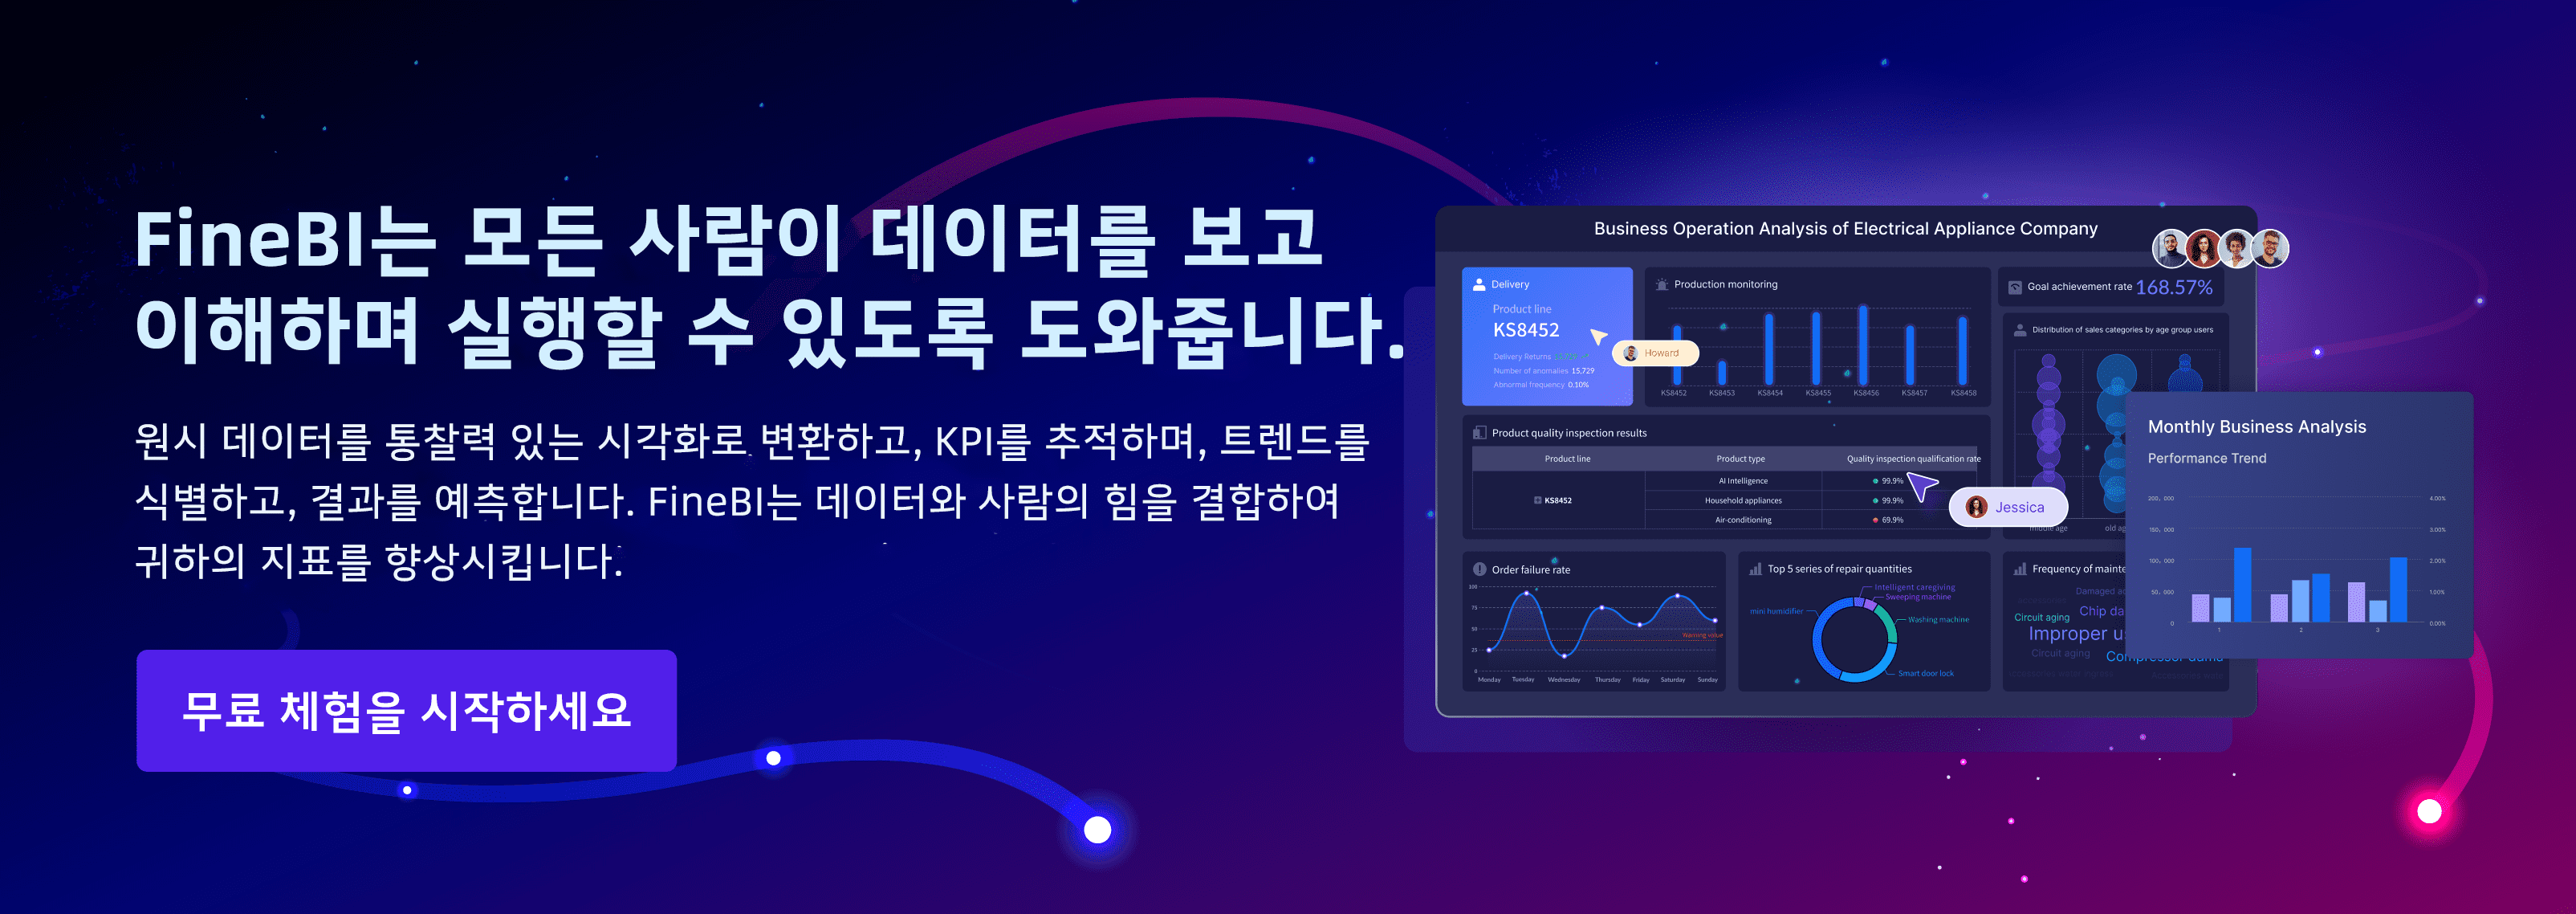
FineBI by FanRuan delivers a modern self-service analytics experience. You can connect to over 60 data sources, including big data platforms, relational databases, and cloud-based systems. FineBI empowers you to build dashboards and interactive reports with a simple drag-and-drop interface. The platform excels at real-time analytics, providing instant access to the latest data for fast decision-making.

FineBI stands out for its enterprise-grade governance. You control data access with role-based permissions, ensuring security and compliance. The platform integrates with FineDataLink, enabling advanced data integration and ETL workflows. AI-driven insights and augmented analytics help you uncover trends and predict outcomes. FineBI supports collaborative analytics, allowing teams to share dashboards and work together efficiently.

Key Features:
Pros:
Ideal Use Cases:
FineBI fits organizations seeking a scalable, user-friendly bi tool for self-service analytics, real-time dashboards, and secure data management. It works well in industries like manufacturing, finance, retail, and healthcare.
FineBI transforms raw data into actionable insights, helping you make informed decisions and drive business growth.
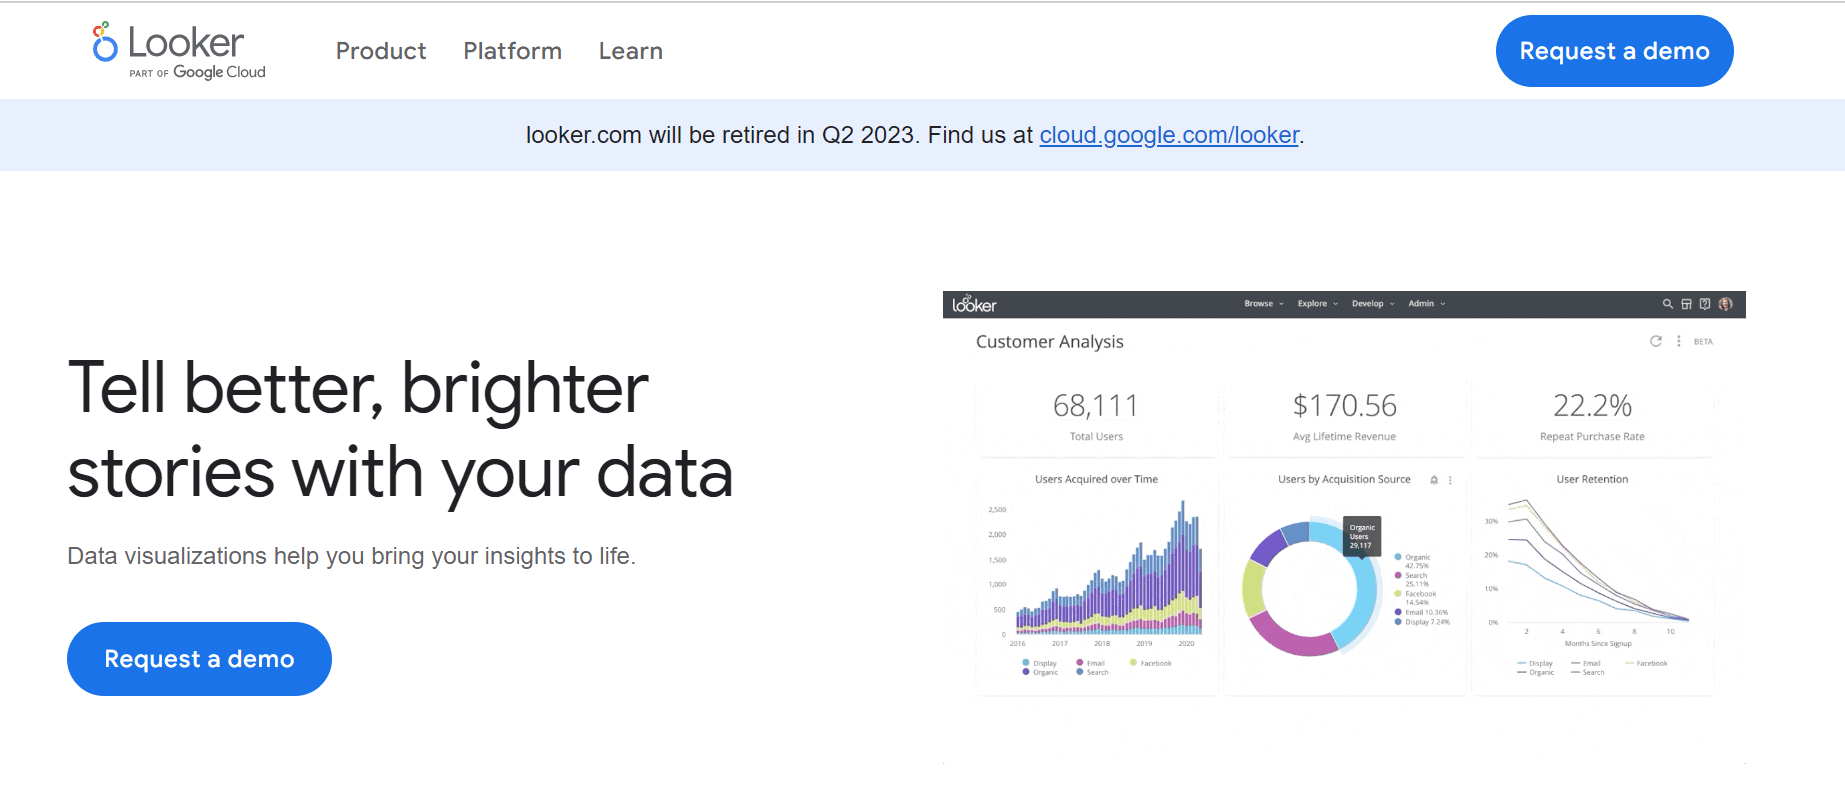
Looker, now part of Google Cloud, offers a cloud-based platform for modern analytics. You can centralize data governance using LookML, ensuring consistent metrics across your business. Looker integrates with major data warehouses, enabling real-time queries and eliminating data duplication. The platform supports collaborative analytics with dashboard sharing, report scheduling, and alerts.
Key Features:
Pros:
Cons:
Ideal Use Cases:
Looker is ideal for businesses needing centralized data governance, scalable analytics, and real-time dashboards across departments.
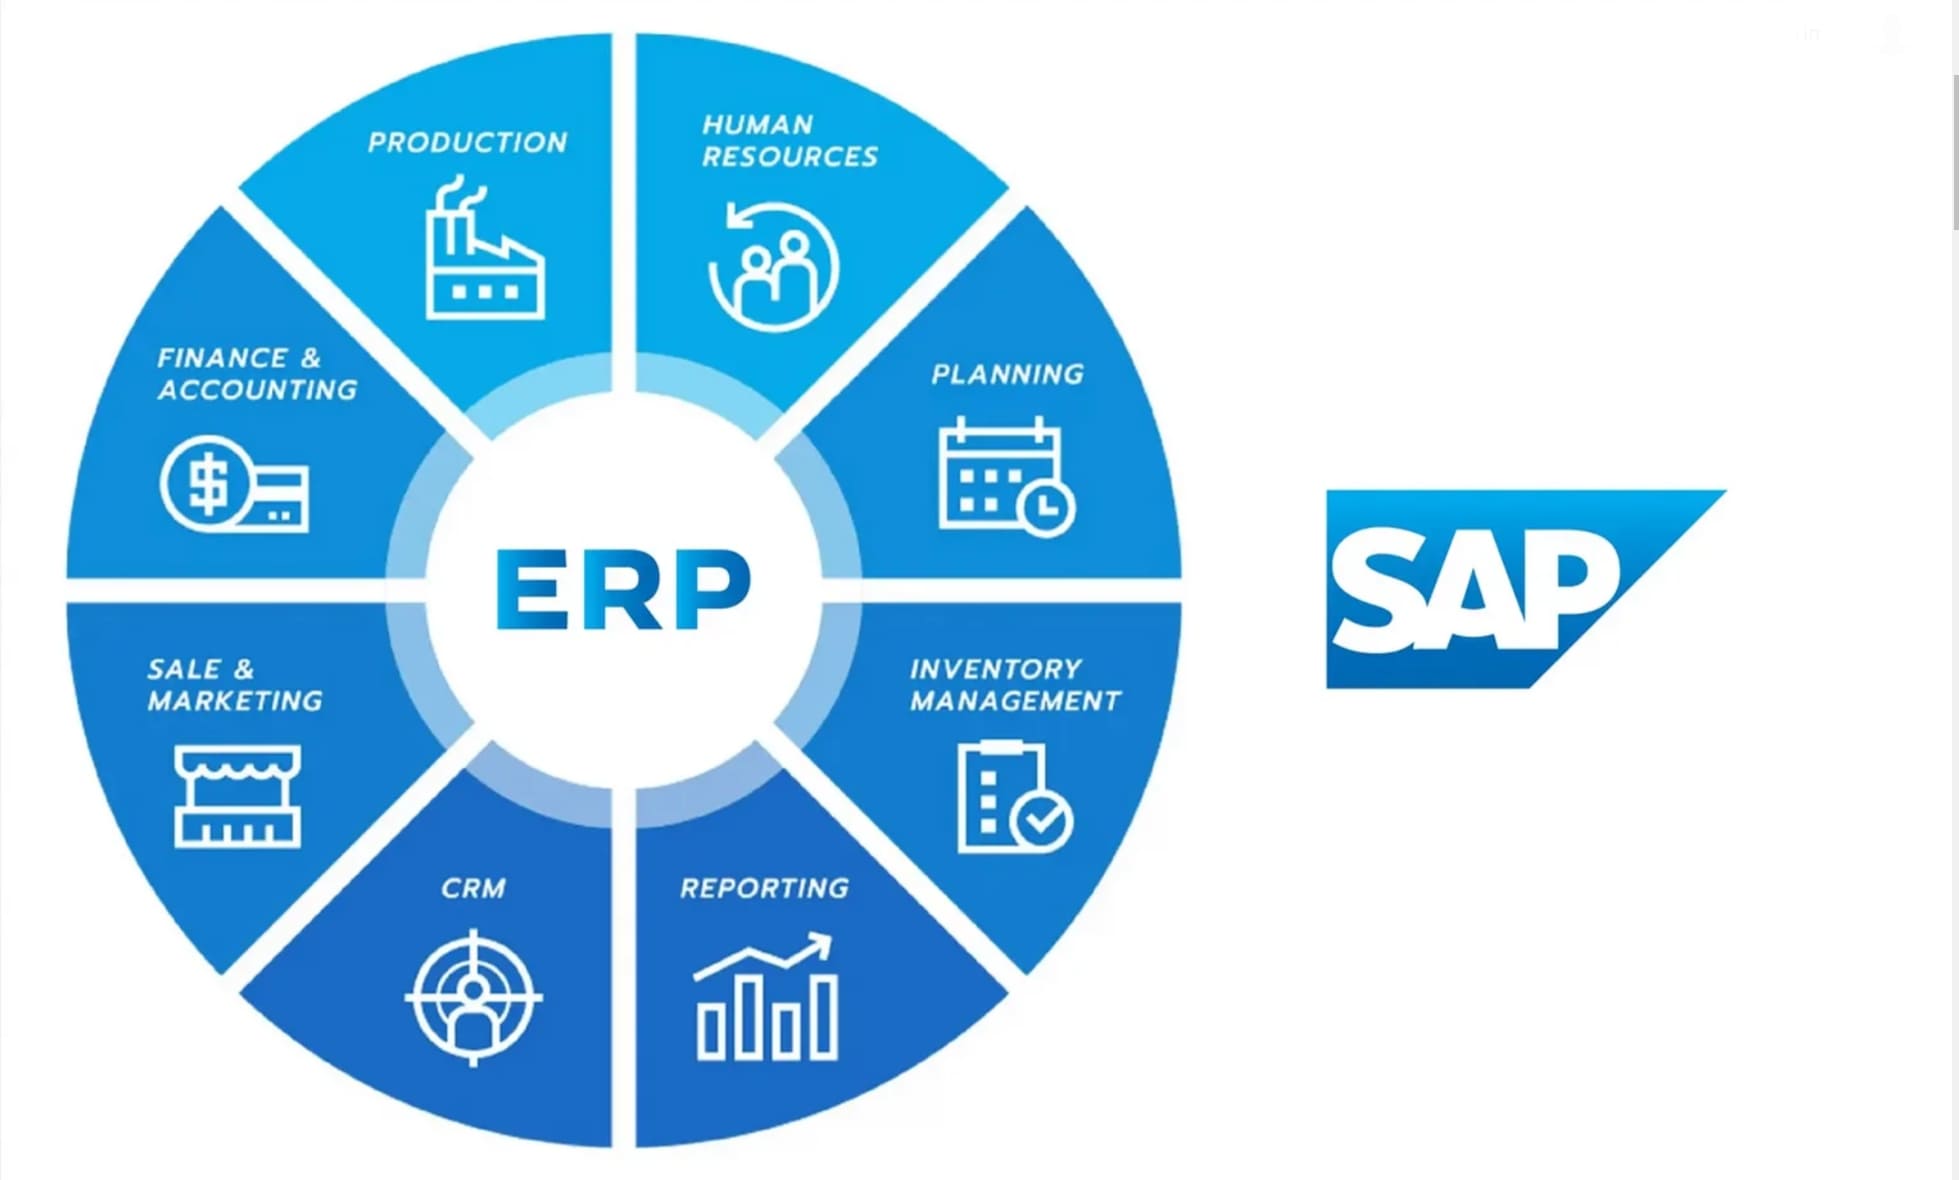
SAP BusinessObjects remains a staple for enterprise business intelligence software. You can rely on its unified platform for analytics, governance, and data management. The platform supports interactive dashboards, offline capabilities, and self-service analytics. SAP BusinessObjects offers multiple deployment options, including on-premise, managed cloud, and SaaS.
Key Features:
Pros:
Cons:
Ideal Use Cases:
SAP BusinessObjects suits large enterprises that need robust governance, advanced reporting, and flexible deployment for their analytics needs.
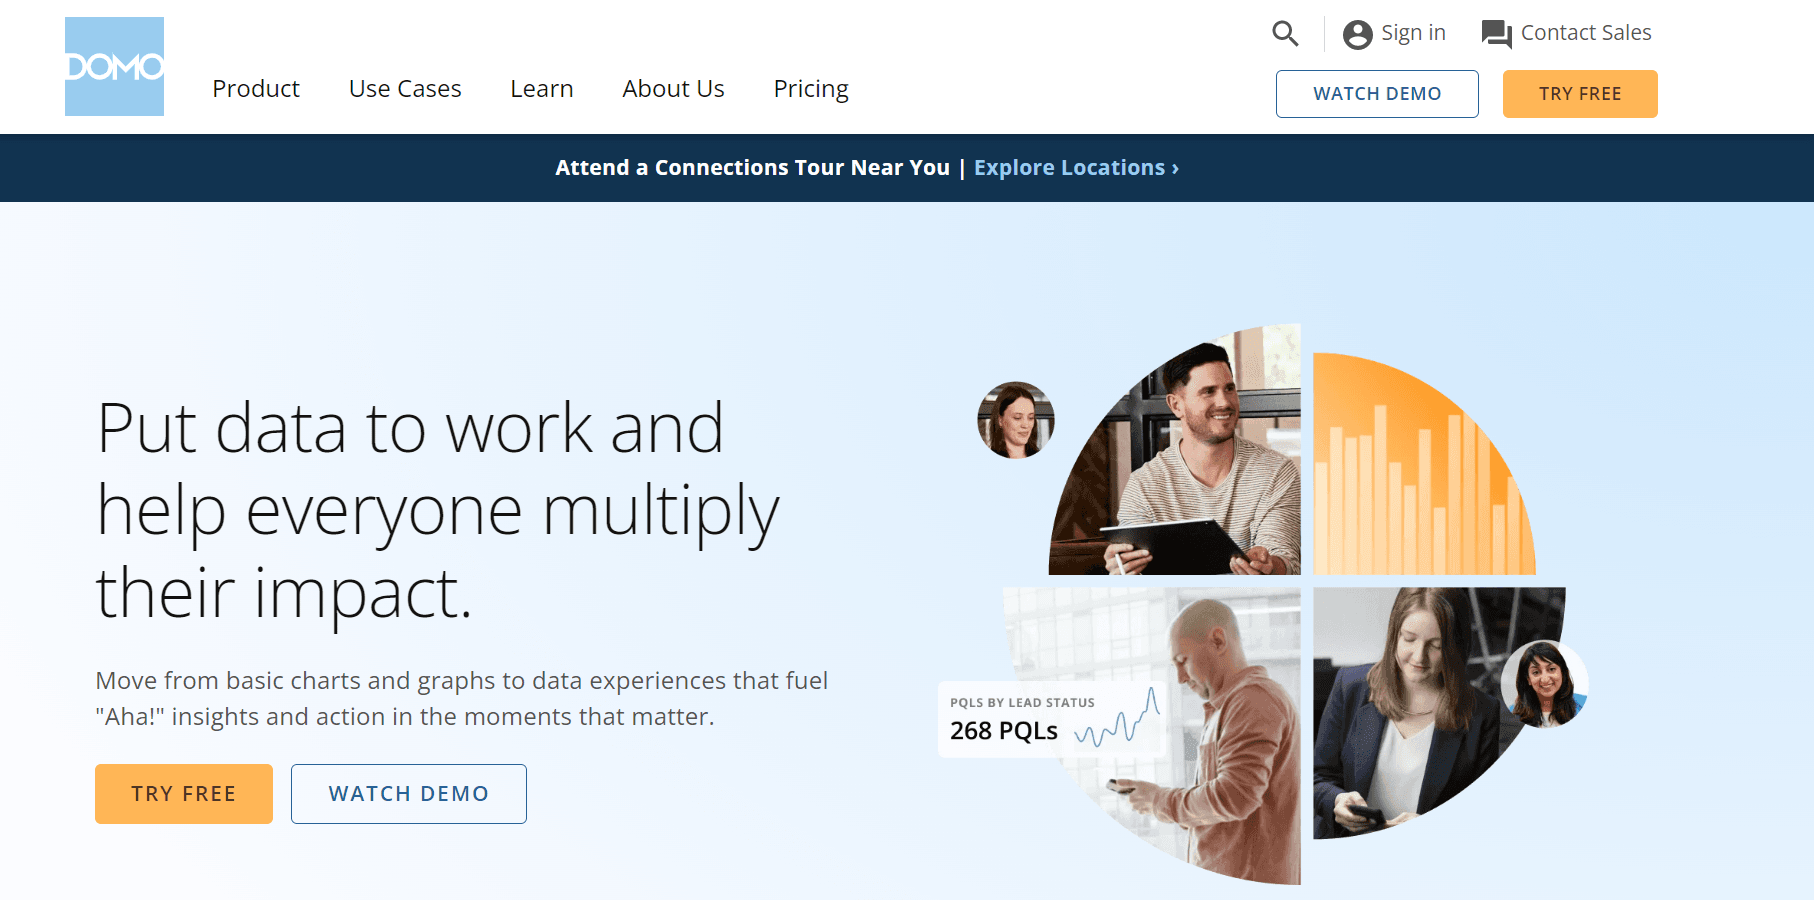
Domo targets executive-level reporting with a mobile-first approach. You can access real-time analytics and dashboards from any device. The platform offers over 1,000 pre-built data connectors and 150 interactive charts. Domo’s automated dataflow engine saves you hundreds of manual hours, making it a strong choice for organizations focused on efficiency.
Key Features:
Pros:
Cons:
Ideal Use Cases:
Domo works best for organizations needing executive dashboards, mobile access, and automated analytics to improve business performance.
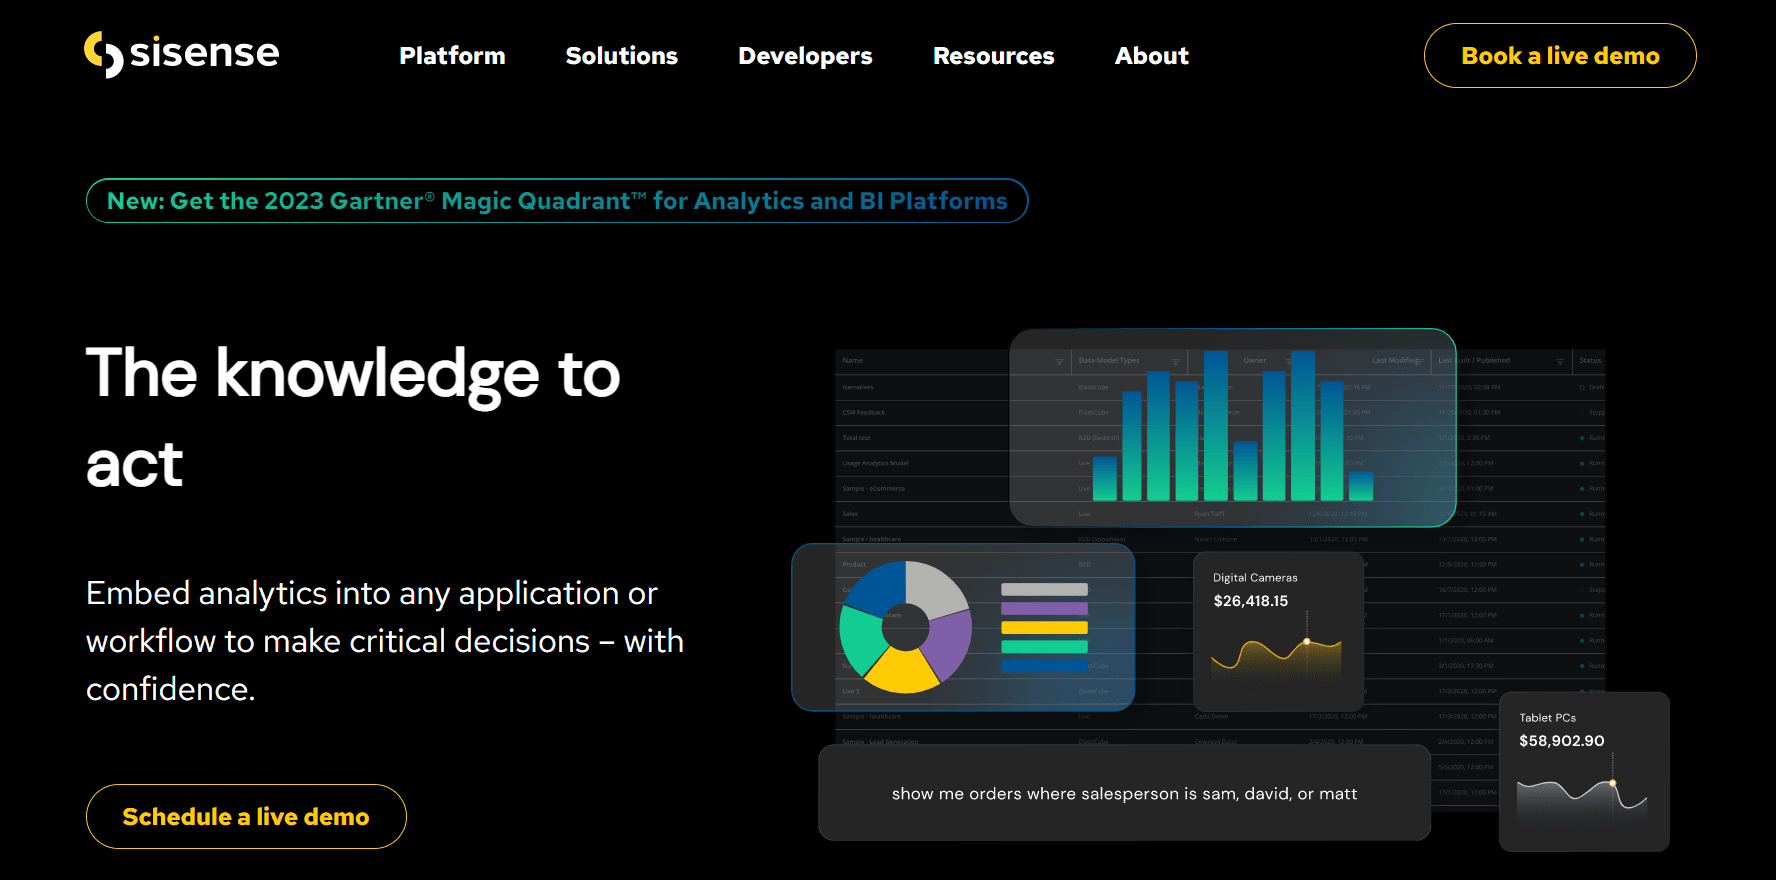
Sisense is known for its strong real-time analytics and big data capabilities. You can use its in-memory engine to analyze large datasets quickly. Sisense supports a wide range of data sources and offers a scalable platform for building dashboards and interactive reports. The platform provides a robust mobile experience, making it suitable for on-the-go analytics.
Key Features:
Pros:
Cons:
Ideal Use Cases:
Sisense is ideal for businesses that need to analyze big data, build real-time dashboards, and deliver analytics to both internal and external users.

Zoho Analytics offers a user-friendly, cloud-based platform for data analysis and dashboards. You can integrate data from over 500 sources and use AI-powered analytics for predictive insights. The platform provides over 50 visualization types, customizable dashboards, and secure collaboration tools. Zoho Analytics is cost-effective, with a free tier for small businesses.
| Aspect | Details |
|---|---|
| Visualization Types | 50+ charts, maps, dashboards |
| AI-Powered Insights | Natural language queries, predictive analytics |
| Data Integration | 500+ data sources |
| Collaboration Tools | Secure sharing, fine-grained access control |
| Mobile Accessibility | Optimized apps for any device |
| Cost-Effectiveness | Free tier, affordable pricing |
Key Features:
Pros:
Cons:
Ideal Use Cases:
Zoho Analytics fits small to medium businesses, e-commerce, healthcare, and finance teams needing affordable, scalable analytics and dashboards.

ThoughtSpot brings search-driven analytics to the forefront. You can use natural language queries to explore data and build dashboards instantly. The platform leverages AI to deliver real-time insights and predictive analytics. ThoughtSpot’s cloud-based platform supports scalable, secure analytics for organizations of any size.
Key Features:
Pros:
Cons:
Ideal Use Cases:
ThoughtSpot is best for organizations that want instant, search-driven analytics, real-time dashboards, and AI-powered insights for business growth.
With these top bi tools, you can transform your data into actionable insights, drive business growth, and stay ahead in a competitive market.
When you compare bi tools, you want to focus on the features that matter most for your business. The best business intelligence software in 2025 automates data collection, cleaning, and analysis. You can use AI-driven analytics to detect trends and forecast outcomes. Interactive dashboards and strong data visualization capabilities help you turn complex data into clear insights. Most leading platforms, such as Power BI, Tableau, Qlik Sense, and FineBI, offer real-time dashboards, drag-and-drop interfaces, and user-friendly workflows.

Modern bi tools improve data quality, increase transparency, and help you make better decisions faster. You can optimize resources, boost efficiency, and grow your business margins.
Here is a feature comparison of top bi tools and their use cases:
| Software | Key Features | Use Cases |
|---|---|---|
| IBM Cognos | AI-driven analytics, advanced visualization, cloud-based deployment, predictive analytics | Large enterprises needing comprehensive BI with advanced analytics |
| Spotfire | Advanced data discovery, real-time collaboration, predictive analytics, seamless integration | Organizations requiring advanced analytics and real-time collaboration |
| Domo | Centralized dashboard, collaboration tools, AI-driven alerts, mobile-friendly interface | Businesses integrating BI into collaborative workflows |
| Sisense | In-chip technology, single-stack architecture, AI-driven recommendations, customizable widgets | Organizations handling large, diverse datasets needing efficient processing |
You need bi tools that connect with all your data sources. Integration is critical for unified analytics. Most business intelligence software now supports connections to cloud databases, on-premises systems, API, and file uploads. FineBI, for example, lets you integrate over 60 sources, making it easy to unify your business data. This integration ensures your dashboards always reflect the latest information.

By 2027, 75% of companies will use big data analytics. Most organizations already use multiple bi tools to maximize insights from different data sources.
You want user-friendly bi tools that make data analysis simple for everyone. Look for platforms with intuitive interfaces, clear workflows, and strong support. Many leading solutions provide mobile access, so you can view dashboards and reports anywhere. Customer service matters, too. Fast, helpful support reduces downtime and keeps your business running smoothly.
A recent analysis shows that general features, cost, customer service, integrations, and mobile support are the top evaluation criteria for bi tools. Here is a quick overview:
| Evaluation Criteria | Weight | Description |
|---|---|---|
| General Features | 40% | Core functionalities, relevance, and ease of use determine overall utility and efficiency. |
| Cost | 15% | Pricing models and value for money, important for budget fit and scalability. |
| Customer Service | 15% | Responsiveness and quality of support reduce downtime and user frustration. |
| Integrations | 15% | Ability to connect with third-party tools for unified workflows and productivity. |
| Mobile Support | 15% | Functionality on mobile devices ensures accessibility and usability on the go. |
Tip: Choose bi tools that offer strong visualization and reporting, easy integration, and responsive support. This will help your team get the most value from your data.
You should start by identifying your organization’s unique requirements before selecting bi tools. Define your goals, such as improving sales analytics, streamlining reporting, or enabling data-driven decision-making. Involve stakeholders from different departments to ensure the tool fits everyone’s needs. Many organizations conduct pilot projects to test features and gather feedback. Research shows that aligning tool capabilities with your operational goals leads to better outcomes. For example, companies like IBM and Samsung increased sales productivity by 25% after choosing analytics platforms tailored to their needs.
| Statistical Analyses | Description |
|---|---|
| Data Validation | Checks accuracy and removes anomalies. |
| Descriptive Statistics | Summarizes data for better understanding. |
| Regression & Forecasting | Predicts outcomes and future trends. |
| Predictive Modeling | Uses ai and machine learning for forecasting. |
Tip: Involve end users early and provide training to maximize adoption and value.
Evaluate both the upfront and ongoing costs of bi tools. Consider whether you need a free solution or a licensed platform. Free business intelligence tools can help you get started without risk. However, as your data grows, you may need advanced features or higher capacity. Scalability matters. Tools like Anaplan and NetSuite offer robust analytics and dashboards but come with higher costs. In contrast, some free options provide real-time data sync and collaboration but may have limits for larger businesses.
| Tool | Budget Constraints | Scalability Features |
|---|---|---|
| Anaplan | High cost, steep learning curve | Handles large data volumes, supports business growth |
| Cube | Quick, user-friendly, limited scale | Integrates with spreadsheets, best for smaller businesses |
| NetSuite | Expensive, complex setup | Multi-entity, global operations, workflow automation |
Consider starting with a free version and upgrading as your analytics needs expand.
Seamless integration with your existing data systems is critical. Nearly 89% of companies face integration backlogs, which can slow down analytics projects. Choose bi tools that connect easily to your CRM, ERP, and cloud platforms. Integration Platform as a Service (iPaaS) solutions enable real-time data synchronization and automation, reducing manual work. Tools like Sisense and Zoho Analytics focus on integration, helping you unify data from multiple sources. This approach supports ai-powered analytics and ensures your dashboards always reflect the latest information.
Select bi tools that offer intuitive interfaces and easy navigation. User-friendly design helps non-technical users create dashboards and run analytics without heavy training. Look for platforms with drag-and-drop features, interactive visualizations, and ai-driven search. Free options often provide simple onboarding, letting you explore analytics before committing. Support and training resources also play a key role in successful adoption.
Start with free trials to test usability and ensure the tool fits your team’s workflow.
You face many challenges when trying to turn data into business value. FineBI helps you overcome these obstacles by giving you a self-service analytics platform that anyone in your company can use. With its drag-and-drop interface, you can create reports and dashboards without needing advanced technical skills. FineBI supports large data sets and connects to major databases like MySQL, Oracle NetSuite, SQL Server, and PostgreSQL. This compatibility ensures you can work with your existing data environment.
FineBI empowers you to explore data, build interactive dashboards, and gain real-time insights. You can customize reports to fit your business needs and share them across teams. Many organizations, such as Founder Securities, have used FineBI to enable thousands of employees to analyze data independently. This shift has improved operational efficiency and decision-making. Macao Water also credits FineBI with helping them move from experience-based management to data-driven strategies, reducing costs and improving service quality.
FineBI increases your data analysis efficiency by at least 50% compared to traditional methods. You receive real-time feedback and clear business insights, which support faster decisions.
You need a unified platform to bring together data from different sources. FineDataLink solves this problem by centralizing your data and breaking down silos. You can synchronize, transform, and manage data across systems with ease. FineDataLink supports real-time business monitoring, so you can detect risks and prevent fraud quickly.
With FineDataLink, you gain access to self-service analytics, modeling, and customer behavior analysis. The platform allows you to access data from multiple devices, including PCs, mobile phones, and large screens. Proactive alert mechanisms keep you informed, so you never miss important changes. FineDataLink helps you maintain high data quality and supports agile analytics for your business.
You can see how FanRuan’s suite addresses common business intelligence challenges. It provides the tools you need for data integration, risk management, and agile analytics across industries like finance, manufacturing, and retail.
Selecting the right business intelligence software shapes your company’s future. Many BI projects fail because of poor choices, so you need to evaluate your needs and look for partners with proven expertise. Only a third of data leaders feel satisfied with their analytics, which shows the value of a careful approach. Try free demos and free trials to see which platform fits best. Many vendors offer free resources, so you can explore features risk-free. FineBI by FanRuan provides a free trial, helping you make an informed decision. The right BI tool will drive better decisions and business growth.
Click the banner below to experience FineBI for free and empower your enterprise to convert data into productivity!

작성자
Seongbin
관련 기사

2026년 AI 툴 추천 12선: 업무 효율 높이는 기능·가격·활용 시나리오 비교
AI 도구는 이제 단순한 $1 보조 수단이 아니라, 문서 작성부터 회의 정리, 검색, 디자인, 자동화, 개발 협업까지 업무 방식 자체를 바꾸는 핵심 인프라가 되고 있습니다. 하지만 시장에 도구가 너무 많아지면서 “무조건 유명한 툴”보다 “우리 업무에 맞는 툴”을 고르는 일이 더 중요해졌습니다. 이 글에서는 2026년 기준으로 실무에 바로 적용하기 좋은 $1 12가지를 기능, 가격, 활용 시나
Seongbin
2026년 6월 03일
AI 솔루션 ROI 계산법 7단계: 경영진을 설득하는 비용 대비 효과 산정 가이드
기업이 $1 도입을 검토할 때 가장 자주 부딪히는 질문은 단순합니다. “그래서, 돈이 얼마나 들고 얼마나 남는가?” 현업 담당자는 기술 가능성을 보고, IT 부서는 구현 난이도를 보고, 경영진은 결국 투자 대비 효과 를 봅니다. 아무리 모델 성능이 뛰어나도 사업 성과로 연결되지 않으면 예산 승인을 받기 어렵습니다. 반대로 기대효과를 숫자로 명확히 설명하면 도입 논의는 훨씬 빨라집니다. 특히
Seongbin
2026년 5월 28일

AI 플랫폼 선택법: 기능보다 먼저 봐야 할 7가지 체크포인트
$1을 검토할 때 많은 기업이 가장 먼저 보는 것은 데모 화면, 생성형 기능, 자동화 범위 같은 “보이는 기능”입니다. 하지만 실제 도입 성패는 기능 목록보다 더 앞단에서 갈립니다. 우리 회사의 문제를 얼마나 정확히 정의했는지 , 데이터와 보안 요건을 감당할 수 있는지 , PoC 이후 운영까지 이어질 구조인지 가 훨씬 중요합니다. 특히 최근에는 대화형 업무 지원, $1, 보고 자동화, 생성형
Seongbin
2026년 5월 28일


