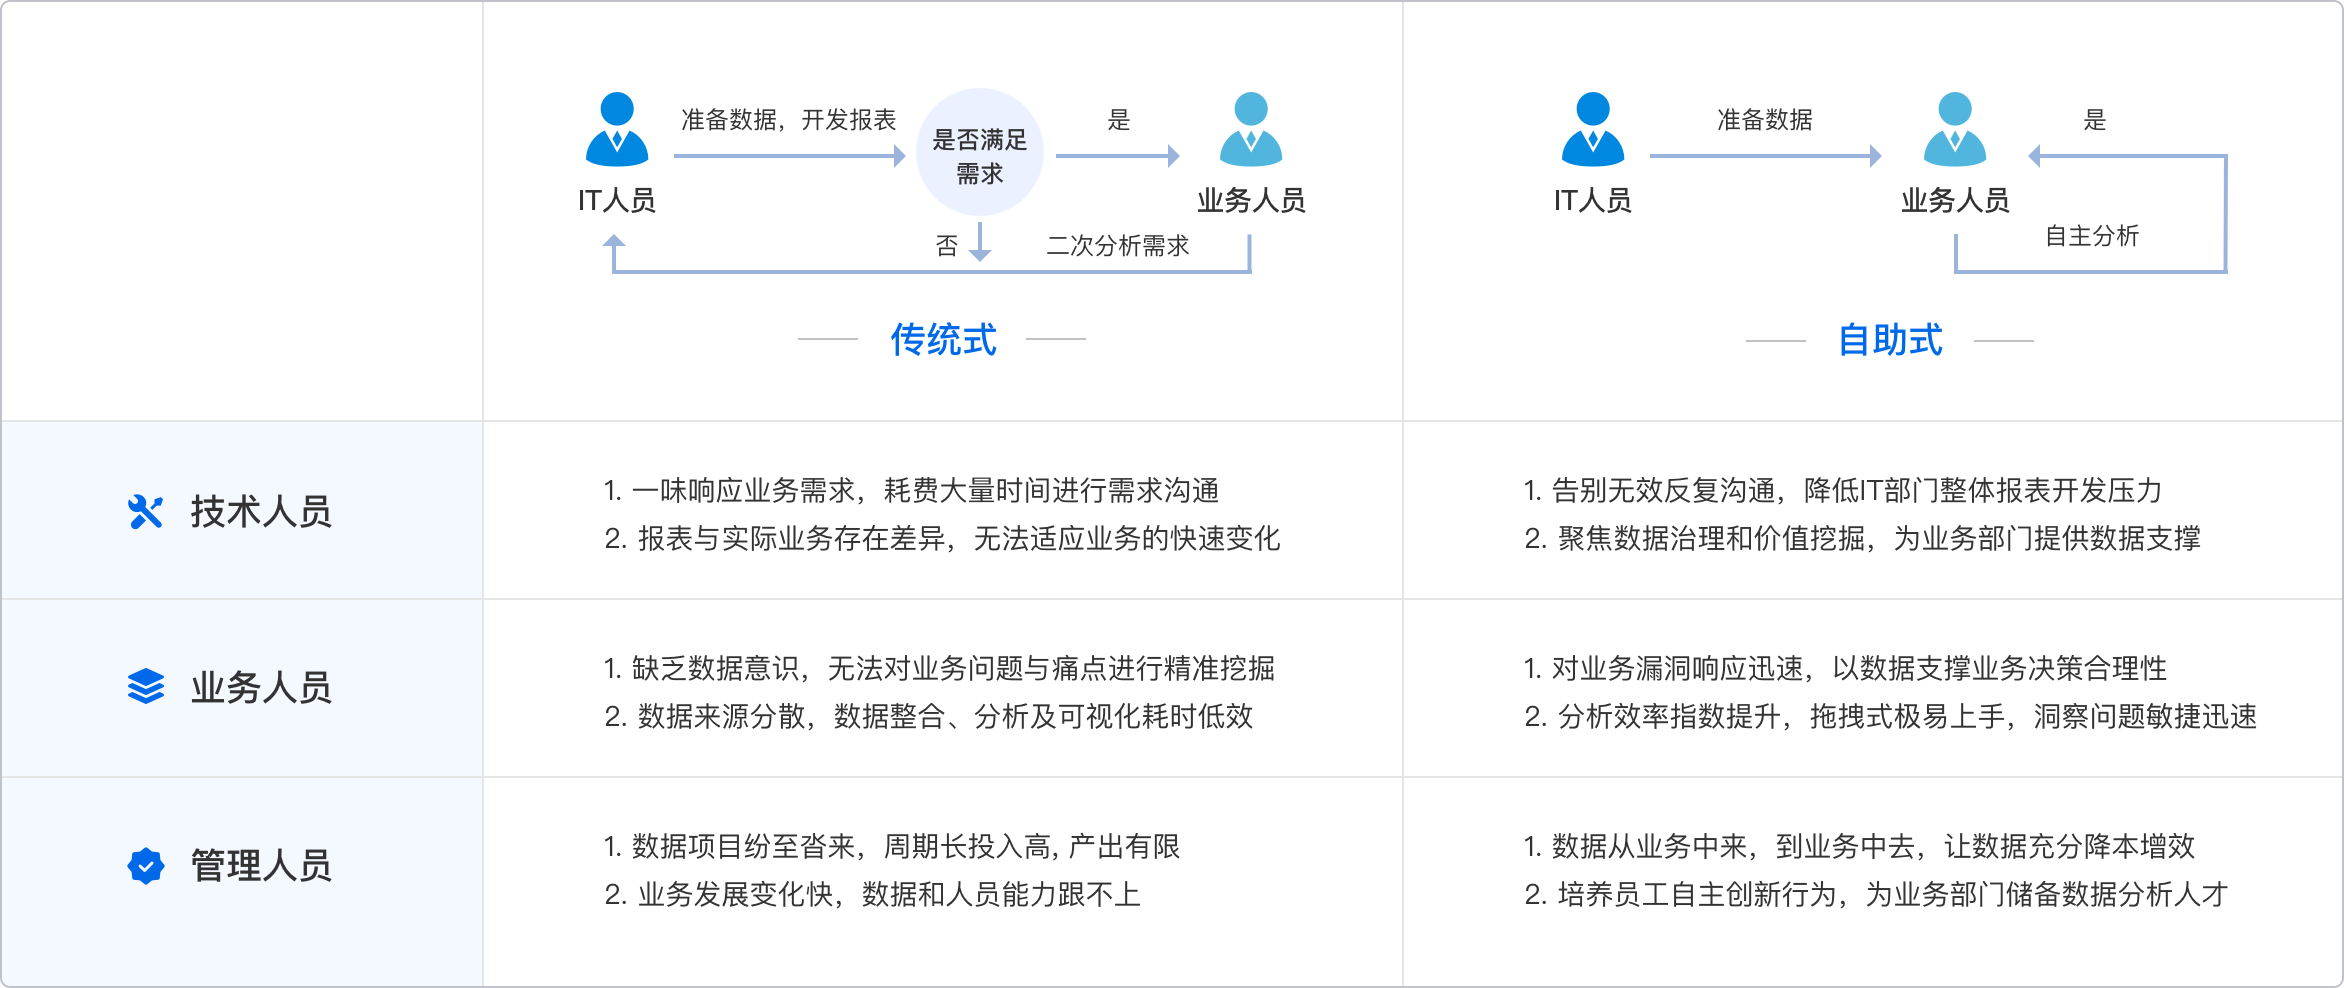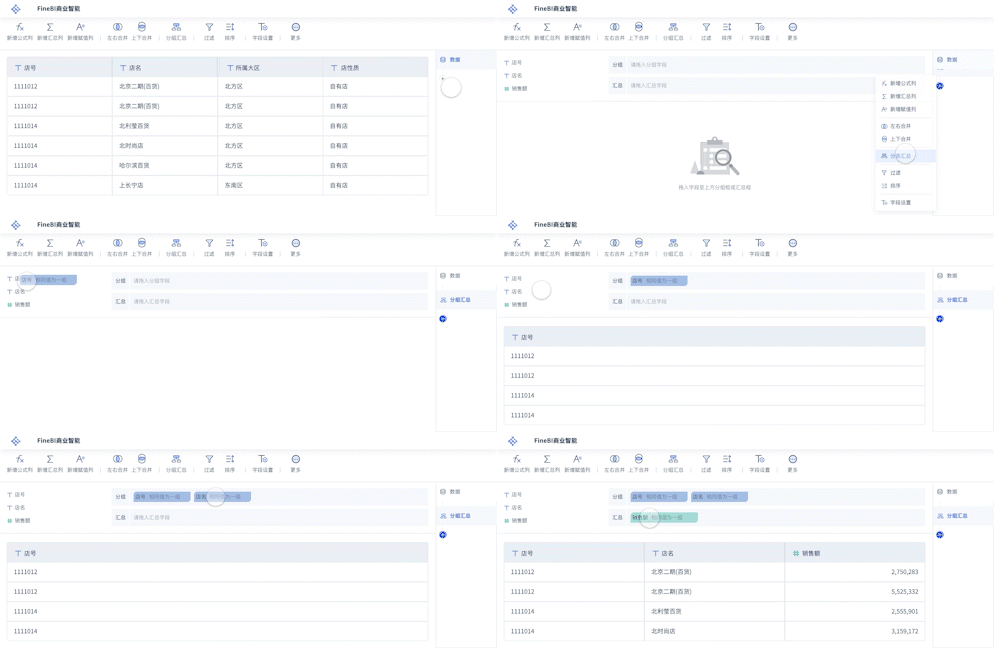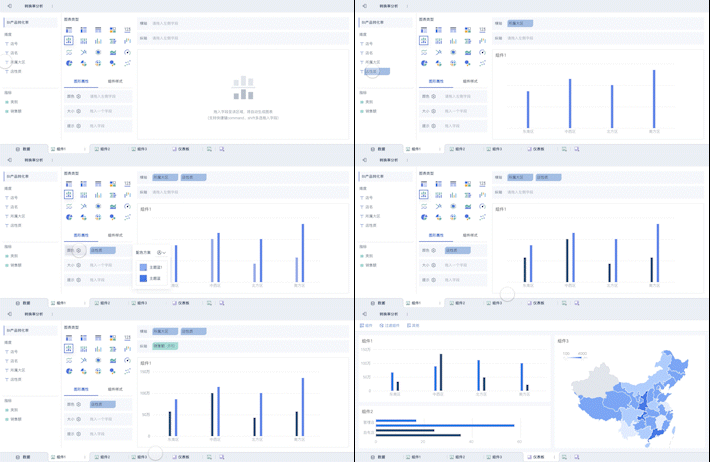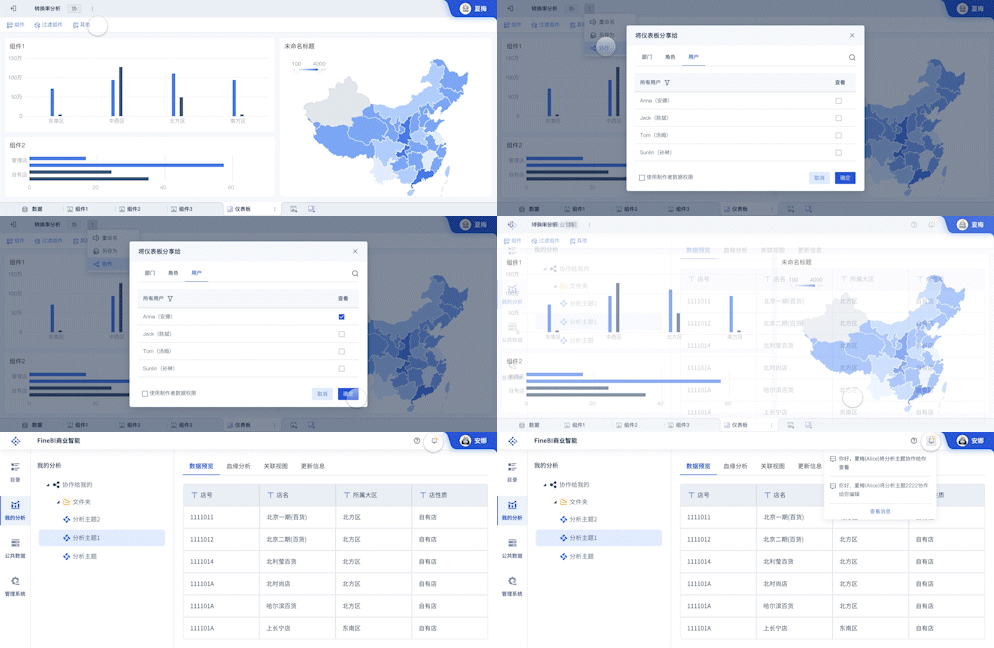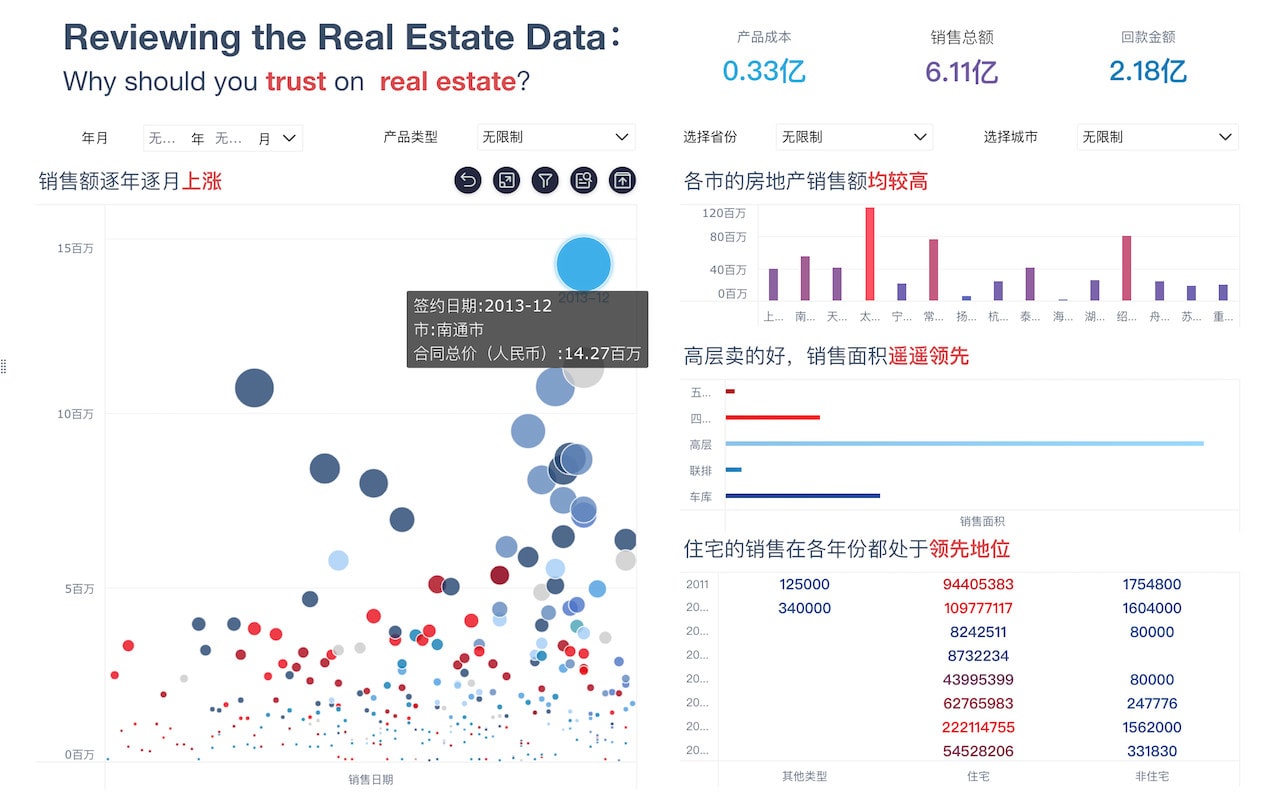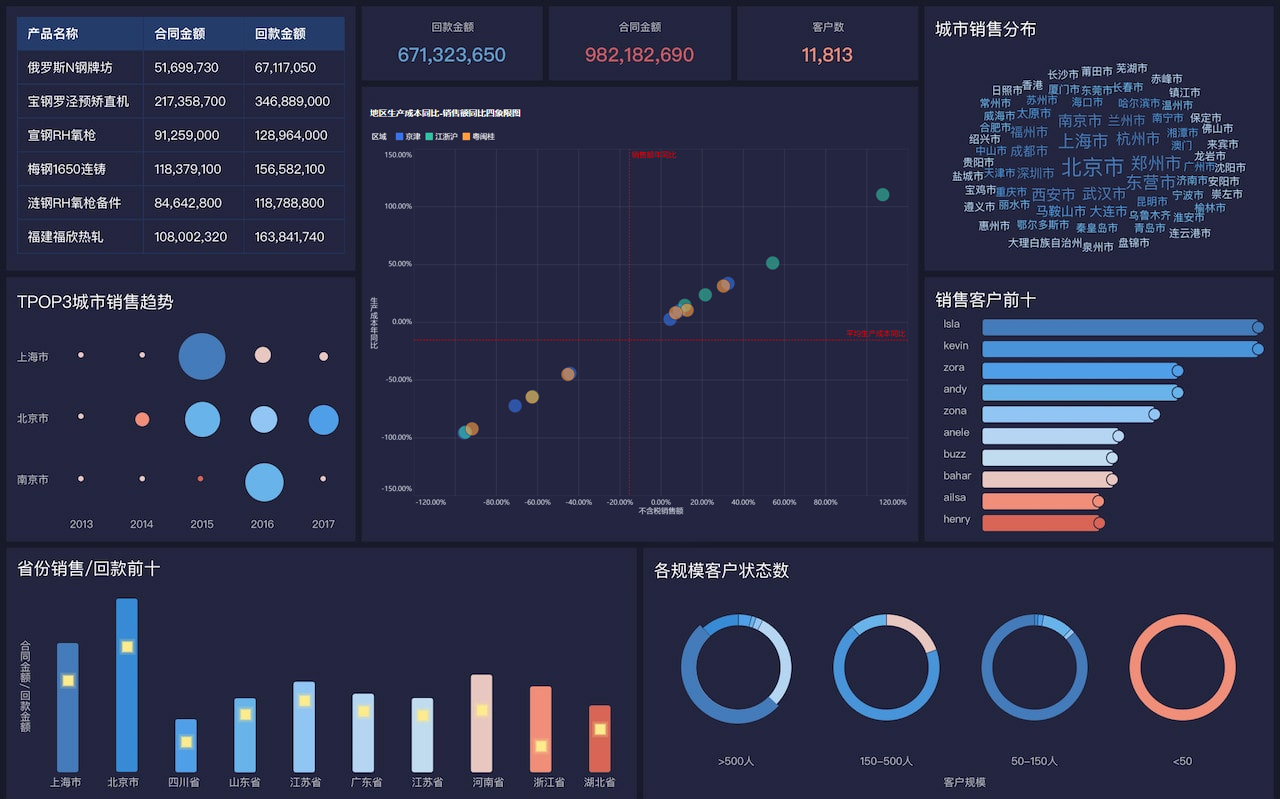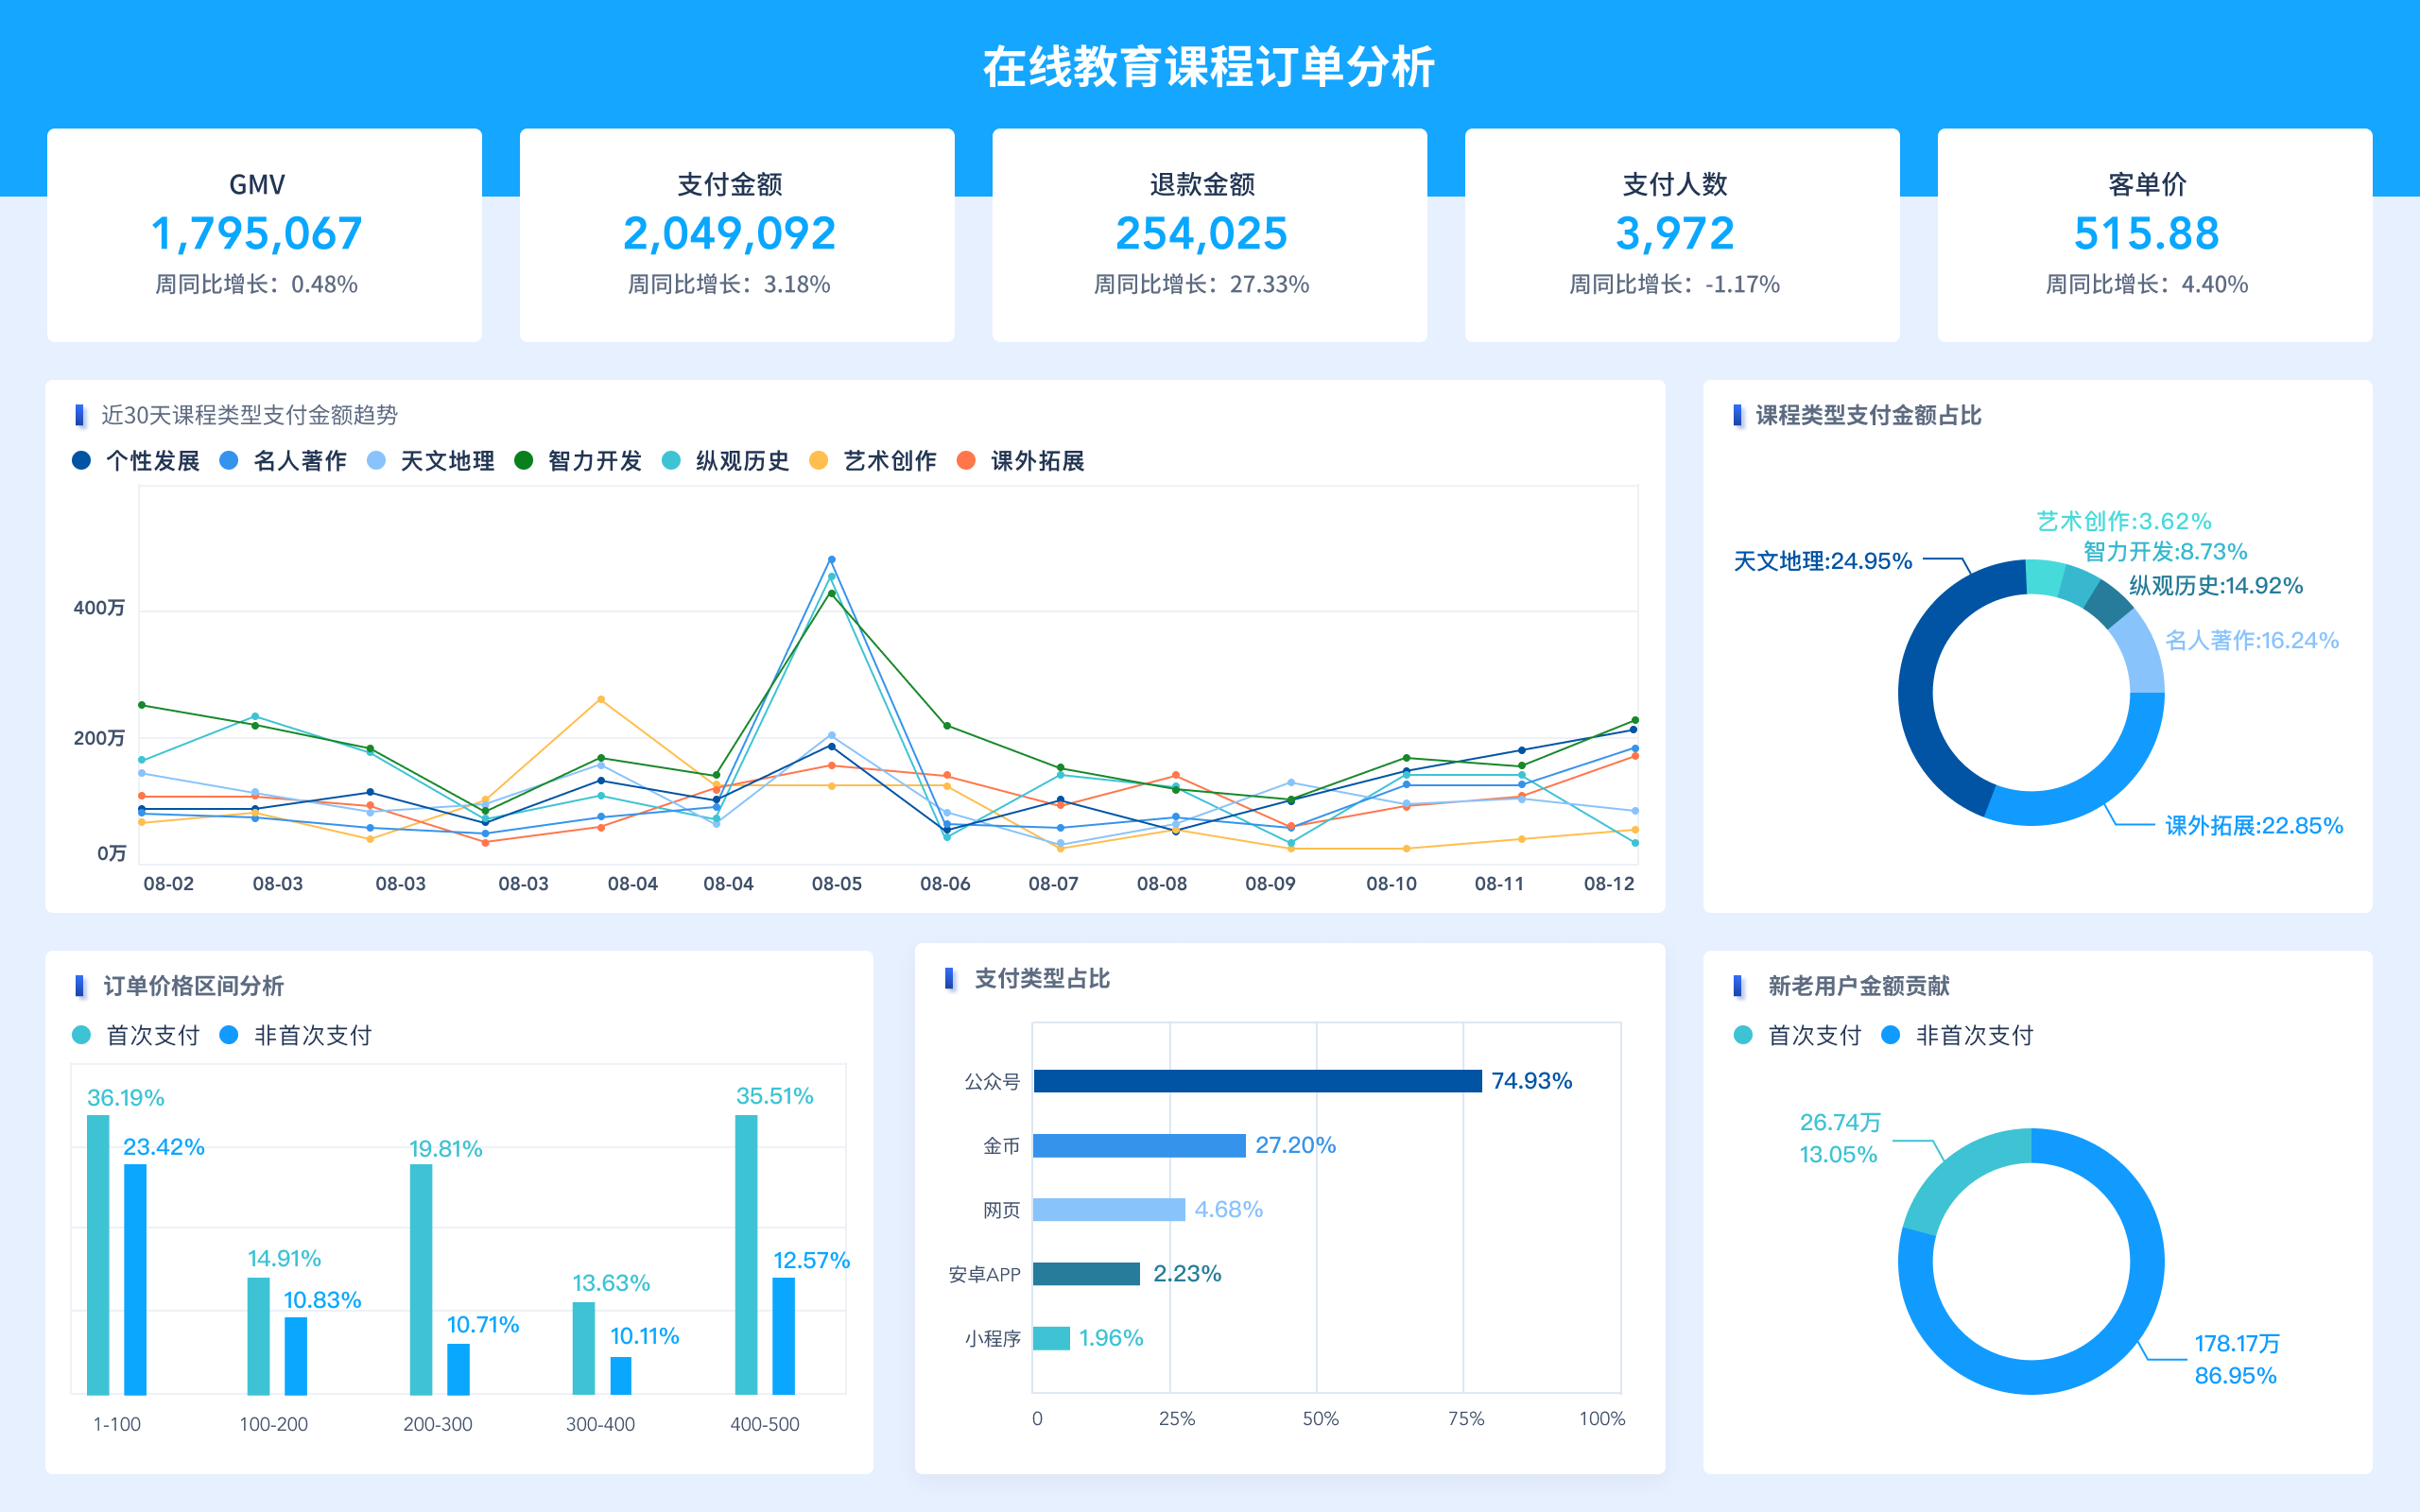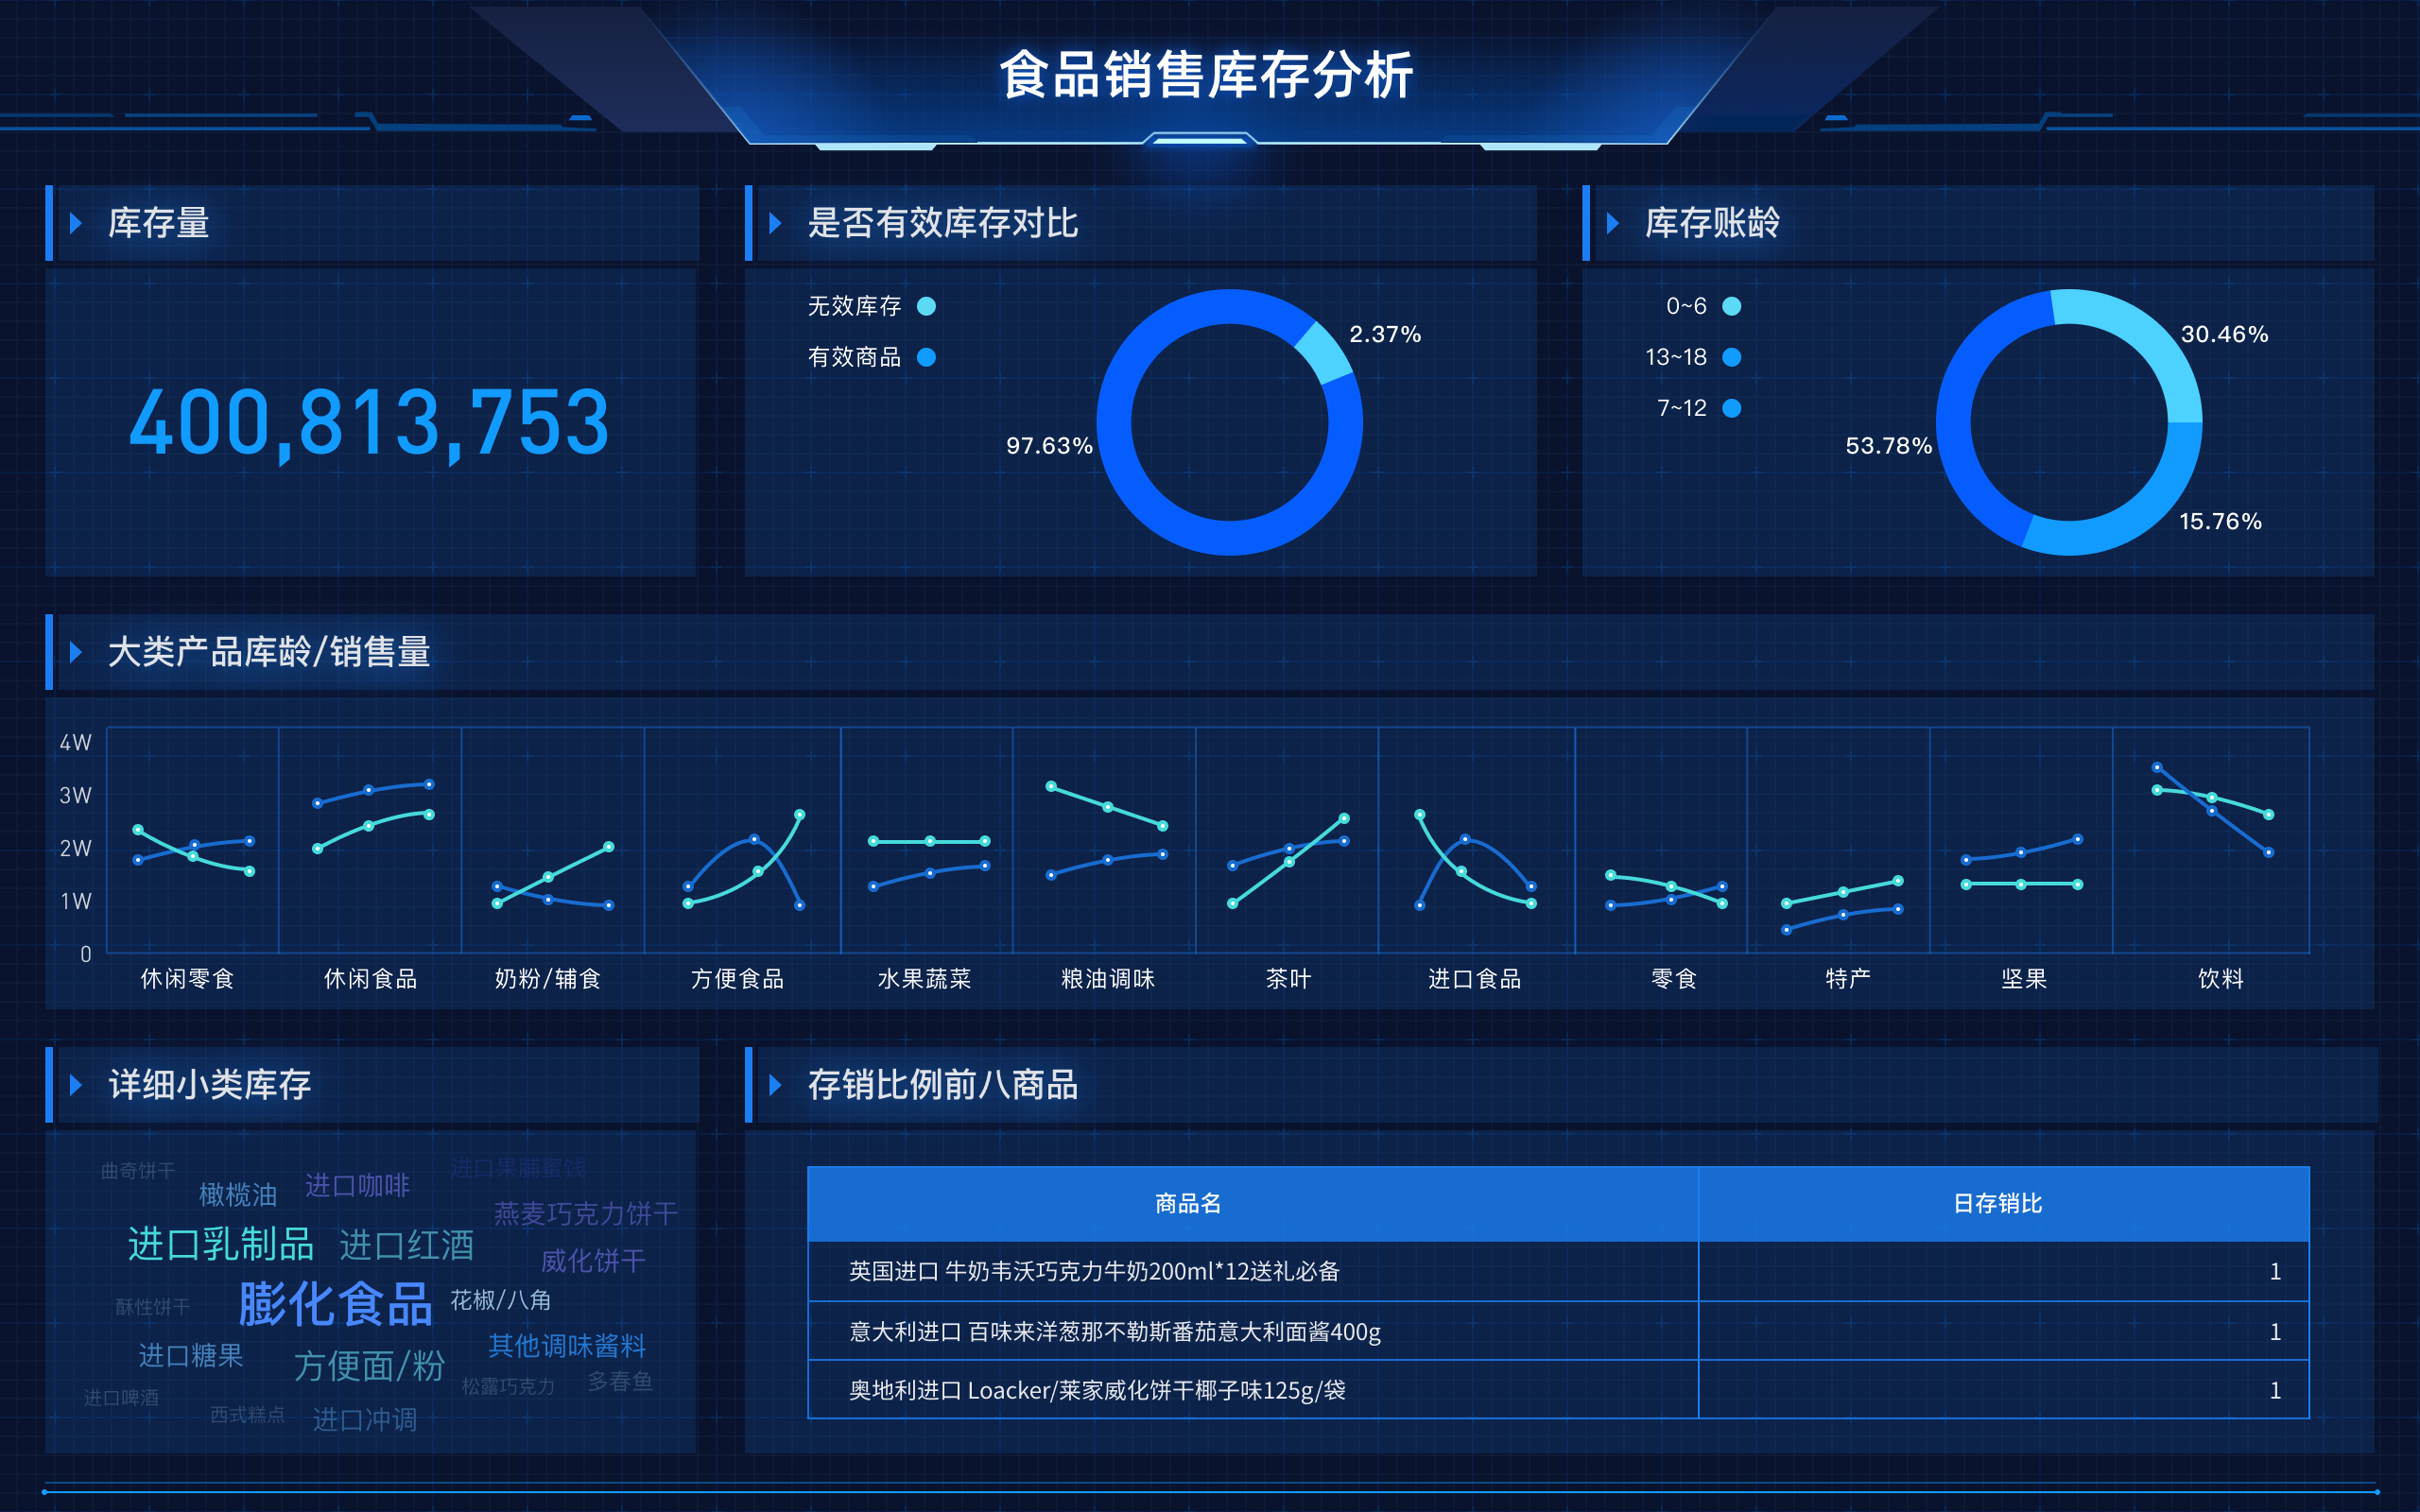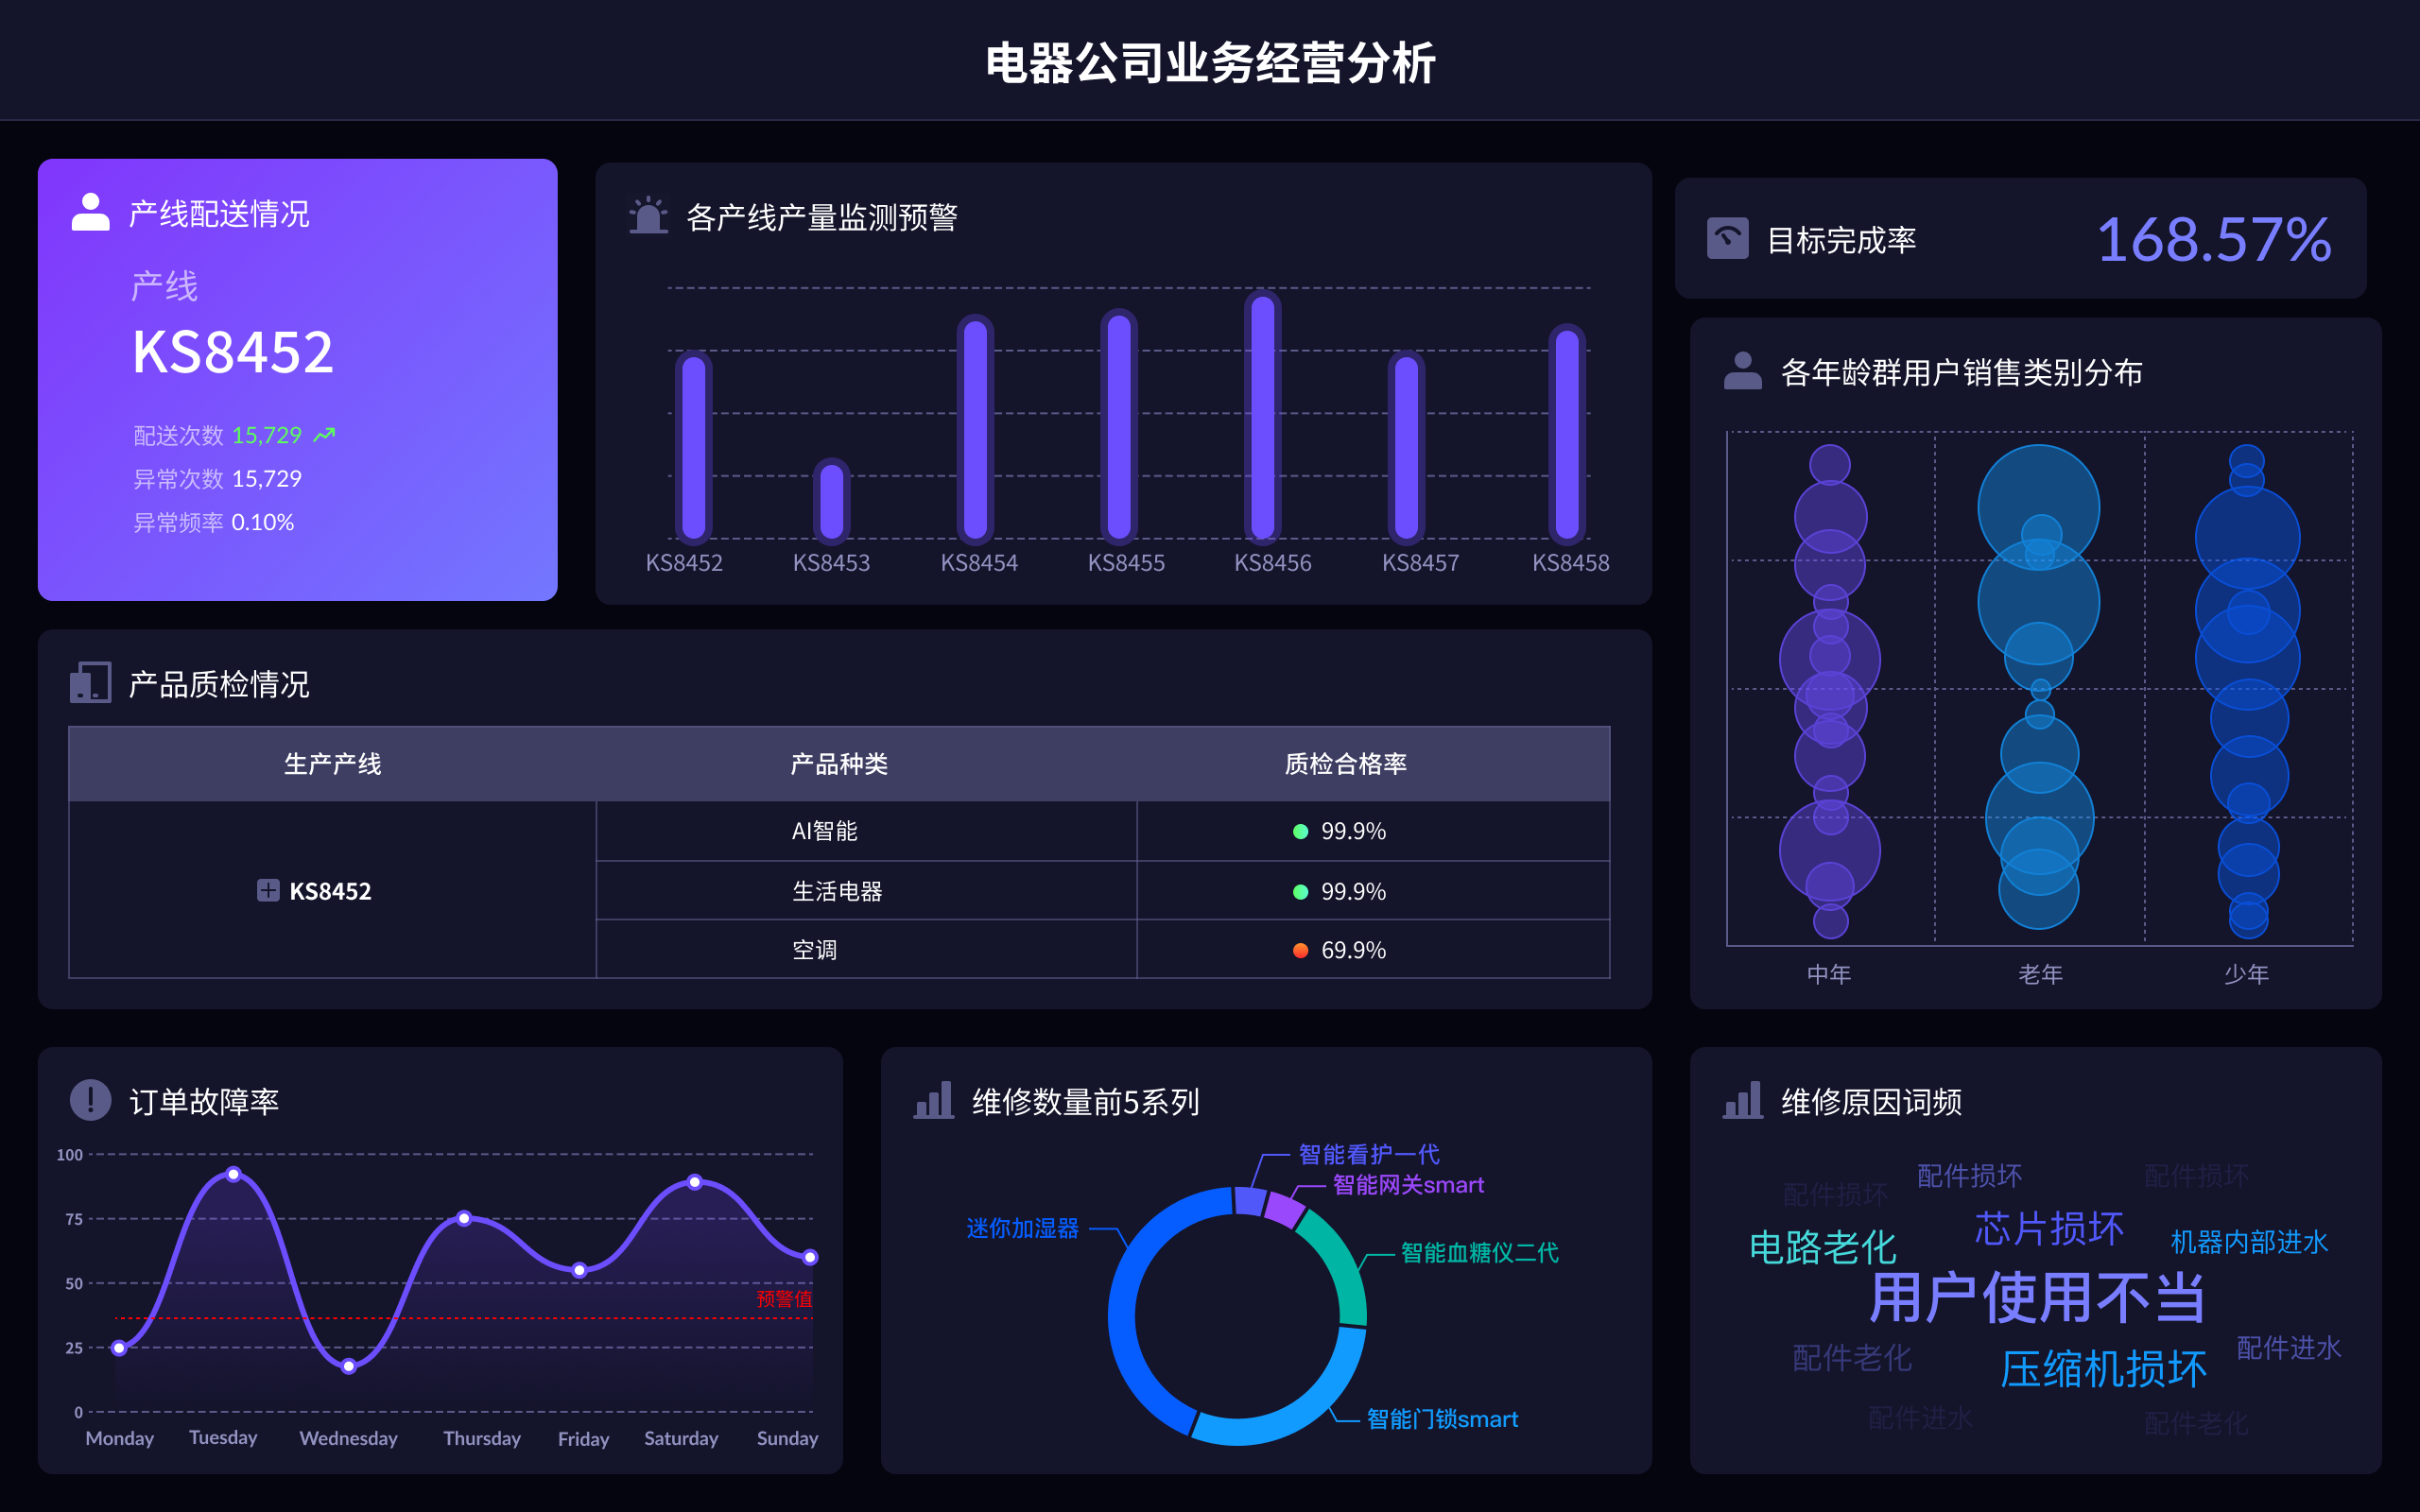
强大的报表工具有:FineReport、FineVis、Tableau、Power BI、QlikView。FineReport是一个专业的报表工具,专注于企业级报表设计和数据分析;FineVis则是一款面向数据可视化的工具,能帮助用户快速创建和分享交互式的可视化报表。FineReport在企业级报表设计和数据分析方面表现尤为突出。其独特的设计功能和高度的灵活性使其成为许多大中型企业的数据分析首选。FineReport支持多种数据源,可以轻松集成到企业现有的IT系统中,且其丰富的图表类型和强大的数据处理能力让用户可以根据需求自由定制报表。此外,FineVis专注于数据可视化,能够以直观的方式展示复杂的数据关系,帮助用户快速洞察数据背后的价值。
一、FINE REPORT
FineReport是帆软旗下的一款专业报表工具,专注于企业级报表设计和数据分析。其核心特点包括:强大的报表设计功能、多数据源支持、高度灵活性、企业级数据安全性。FineReport支持多种数据源,包括关系数据库、NoSQL数据库、Excel文件等,用户可以轻松集成到企业现有的IT系统中。FineReport提供了丰富的图表类型,如柱状图、折线图、饼图等,用户可以根据需求自由定制报表。FineReport还支持多种数据处理功能,如数据过滤、分组、排序等,帮助用户高效处理大数据量。FineReport的设计器界面友好,用户无需编写代码即可完成复杂报表设计,极大提高了工作效率。
二、FINEVIS
FineVis是帆软旗下专注于数据可视化的工具,能够帮助用户快速创建和分享交互式的可视化报表。FineVis的核心特点包括:直观的数据展示、强大的数据交互功能、便捷的数据分享。FineVis支持多种图表类型,如散点图、热力图、地图等,用户可以根据数据特点选择最合适的图表类型进行展示。FineVis提供了丰富的交互功能,如筛选、钻取、联动等,使用户可以通过简单的操作深入探索数据。FineVis还支持多种数据导入方式,如Excel、CSV、数据库等,用户可以方便地将数据导入FineVis进行可视化分析。FineVis的分享功能也非常强大,用户可以通过链接、嵌入代码等方式将可视化报表分享给他人,方便团队协作。
三、TABLEAU
Tableau是一款广泛使用的数据可视化工具,能够帮助用户快速创建交互式的可视化报表。Tableau的核心特点包括:强大的数据连接能力、丰富的可视化功能、友好的用户界面。Tableau支持多种数据源,包括数据库、云服务、Excel文件等,用户可以轻松将数据导入Tableau进行分析。Tableau提供了丰富的图表类型和可视化功能,用户可以根据需求自由选择和组合。Tableau的用户界面友好,拖拽式操作使用户无需编写代码即可完成复杂的可视化分析。Tableau还支持多种数据处理功能,如数据清洗、转换、聚合等,帮助用户高效处理大数据量。
四、POWER BI
Power BI是微软推出的数据分析和可视化工具,专注于帮助用户创建和分享交互式的报表和仪表盘。Power BI的核心特点包括:广泛的数据源支持、强大的数据处理能力、便捷的分享功能。Power BI支持多种数据源,包括数据库、云服务、Excel文件等,用户可以轻松将数据导入Power BI进行分析。Power BI提供了丰富的图表类型和可视化功能,用户可以根据需求自由选择和组合。Power BI的用户界面友好,拖拽式操作使用户无需编写代码即可完成复杂的可视化分析。Power BI还支持多种数据处理功能,如数据清洗、转换、聚合等,帮助用户高效处理大数据量。Power BI的分享功能非常强大,用户可以通过链接、嵌入代码等方式将报表和仪表盘分享给他人,方便团队协作。
五、QLIKVIEW
QlikView是一款强大的商业智能和数据可视化工具,专注于帮助用户进行数据分析和报表创建。QlikView的核心特点包括:独特的关联引擎、强大的数据处理能力、丰富的可视化功能。QlikView的关联引擎能够自动发现数据之间的关系,帮助用户快速找到数据中的关键点。QlikView支持多种数据源,包括数据库、云服务、Excel文件等,用户可以轻松将数据导入QlikView进行分析。QlikView提供了丰富的图表类型和可视化功能,用户可以根据需求自由选择和组合。QlikView的用户界面友好,拖拽式操作使用户无需编写代码即可完成复杂的可视化分析。QlikView还支持多种数据处理功能,如数据清洗、转换、聚合等,帮助用户高效处理大数据量。
FineReport官网: https://s.fanruan.com/ryhzq FineVis官网: https://s.fanruan.com/7z296
相关问答FAQs:
1. What are some powerful reporting tools for data analysis in English?
There are several powerful reporting tools available for data analysis in English. Some popular options include Microsoft Power BI, Tableau, Google Data Studio, and QlikView. These tools offer a wide range of features such as data visualization, interactive dashboards, and advanced analytics capabilities. Users can easily create custom reports, charts, and graphs to analyze data and gain valuable insights.
Microsoft Power BI is a popular reporting tool that allows users to connect to various data sources, create interactive visualizations, and share insights with others. With Power BI, users can easily create reports and dashboards that are both visually appealing and informative. The tool also offers advanced analytics capabilities such as predictive modeling and machine learning.
Tableau is another powerful reporting tool that is widely used for data analysis. It offers a user-friendly interface that allows users to create interactive dashboards and reports without the need for coding. Tableau also provides a wide range of visualization options, including charts, graphs, and maps, to help users explore and understand their data.
Google Data Studio is a free reporting tool that allows users to create custom reports and dashboards using data from various sources such as Google Analytics, Google Ads, and Google Sheets. With Data Studio, users can easily drag and drop components to create visually appealing reports that can be shared with others. The tool also offers collaboration features, making it easy for teams to work together on reports.
QlikView is a powerful reporting tool that offers advanced data visualization and analytics capabilities. Users can create interactive dashboards, reports, and data visualizations to explore and analyze their data. QlikView also provides powerful data modeling features that allow users to extract insights from complex data sets.
Overall, these reporting tools offer powerful features and capabilities for data analysis in English, making it easier for users to visualize and analyze their data effectively.
本文内容通过AI工具匹配关键字智能整合而成,仅供参考,帆软不对内容的真实、准确或完整作任何形式的承诺。具体产品功能请以帆软官方帮助文档为准,或联系您的对接销售进行咨询。如有其他问题,您可以通过联系blog@fanruan.com进行反馈,帆软收到您的反馈后将及时答复和处理。


