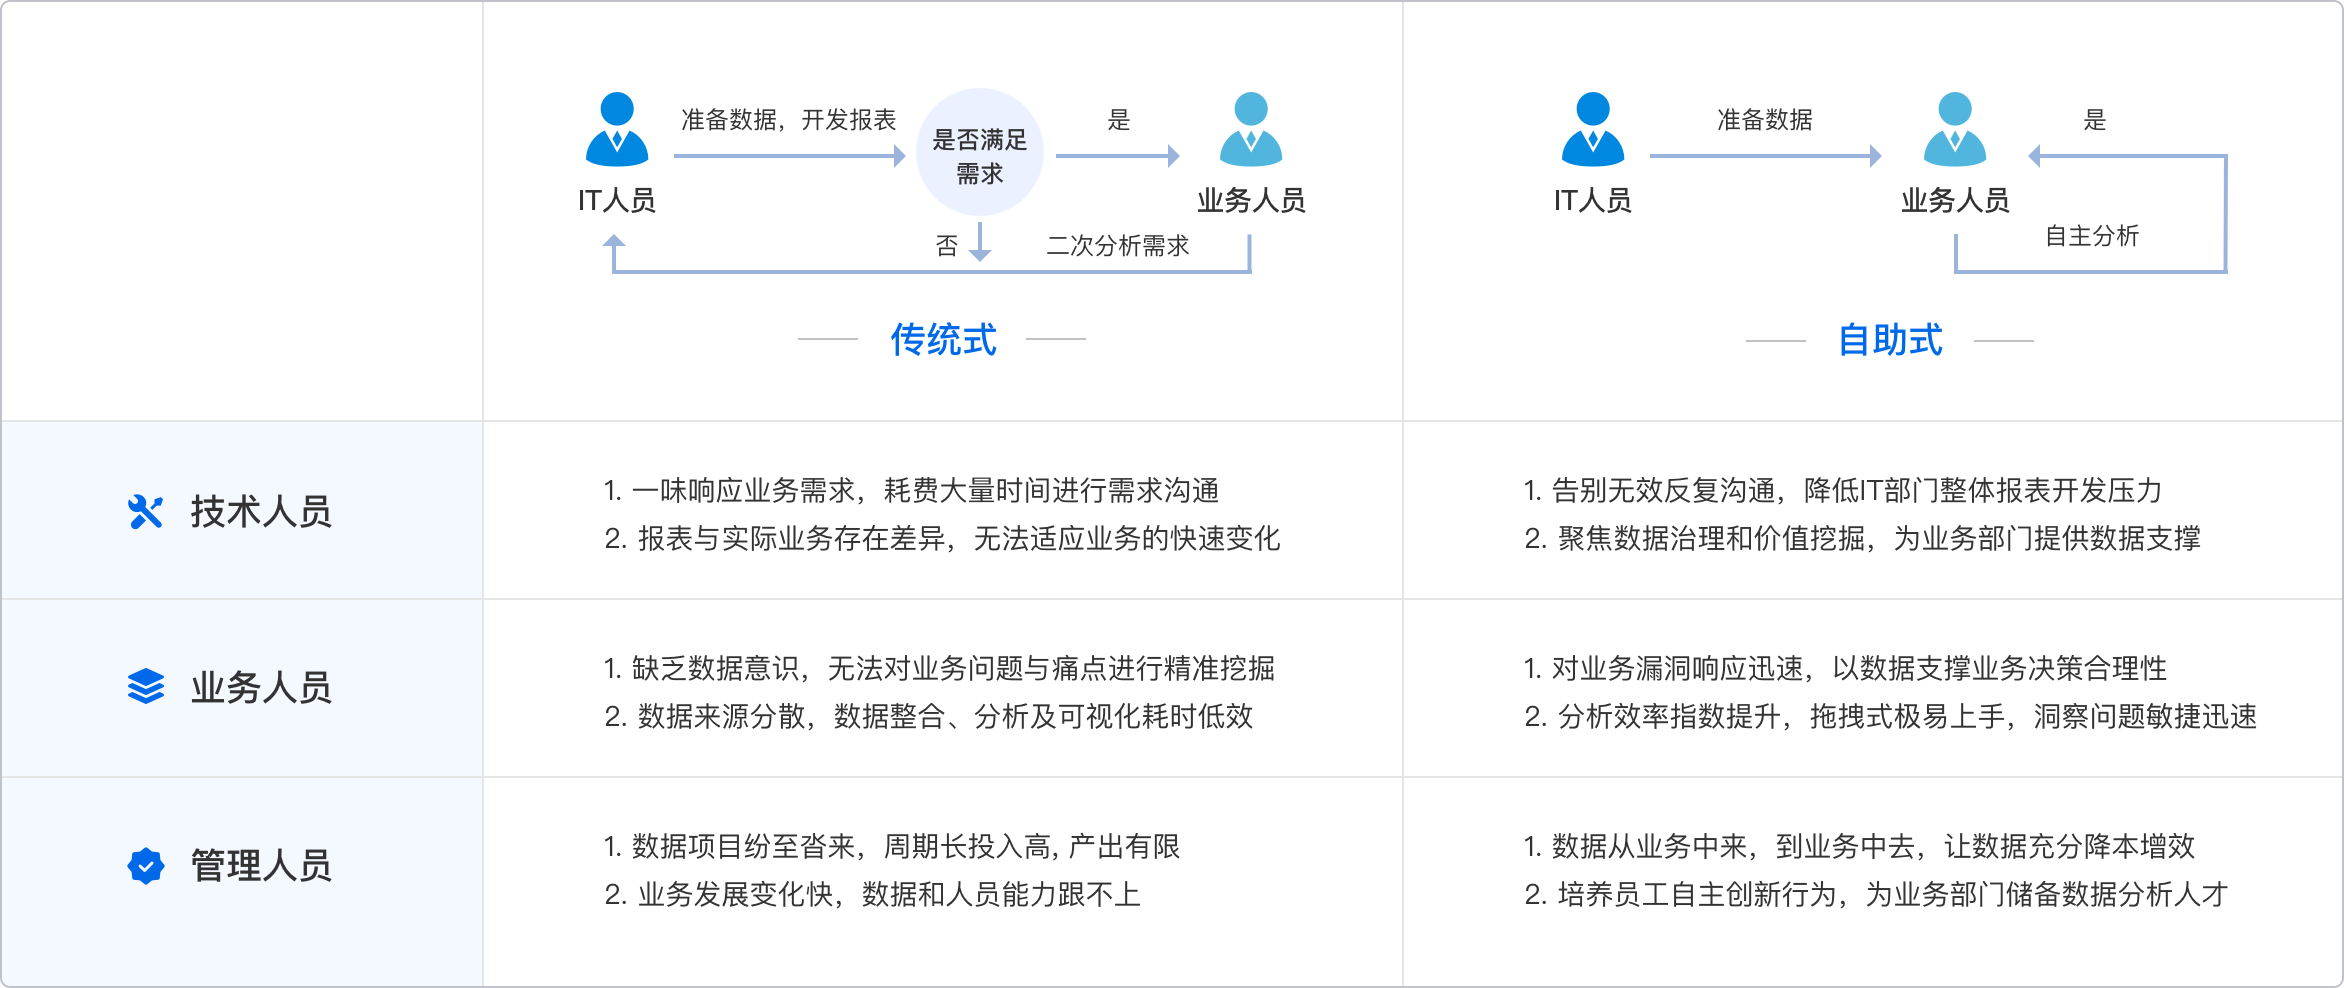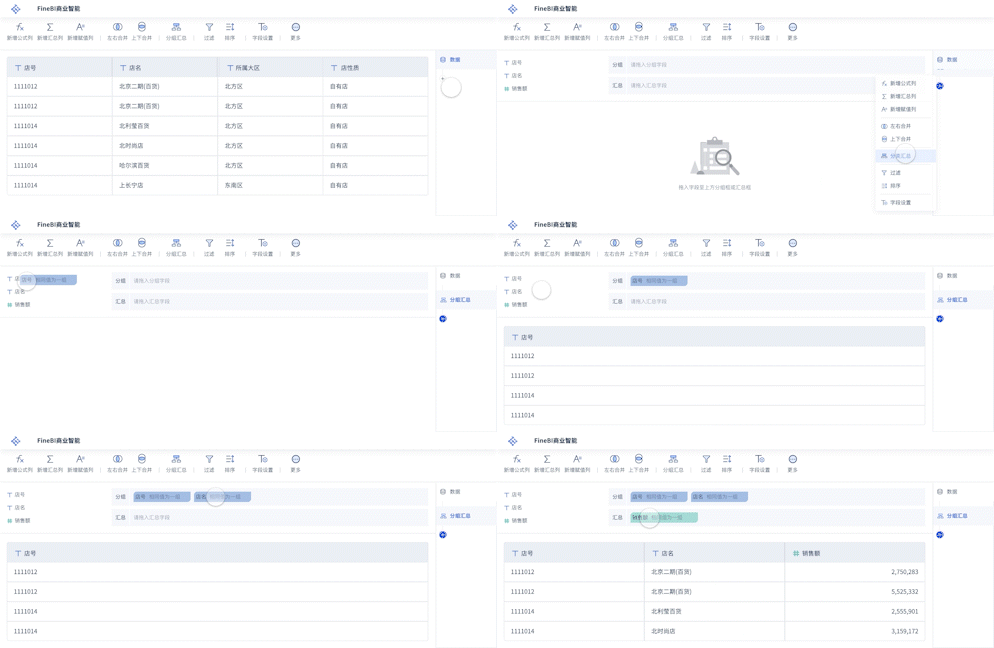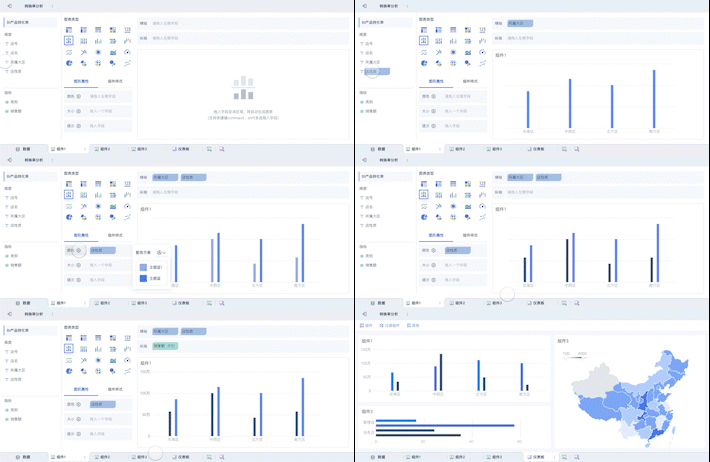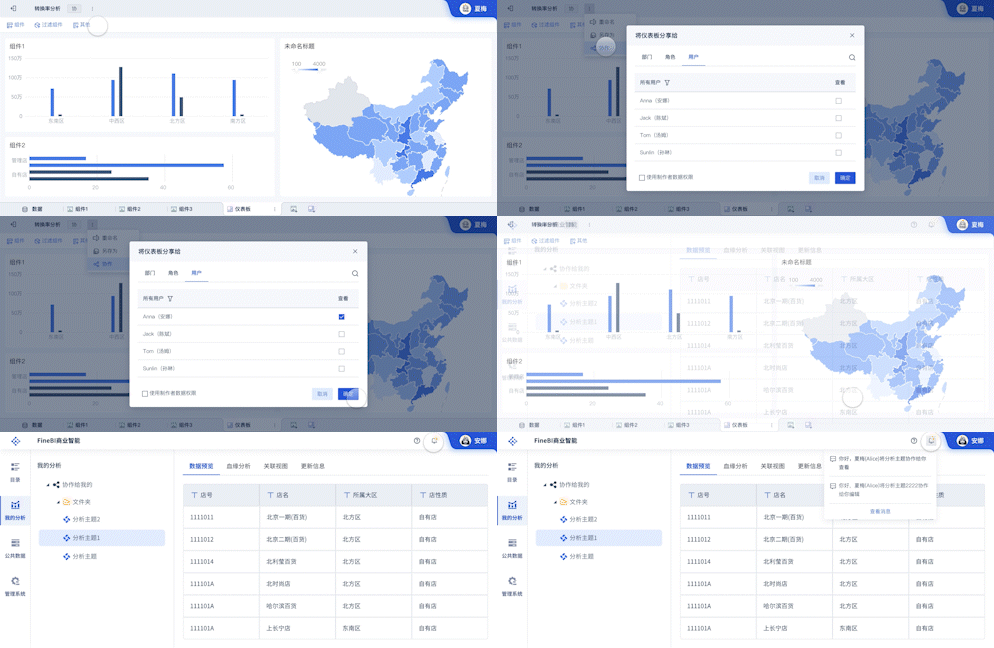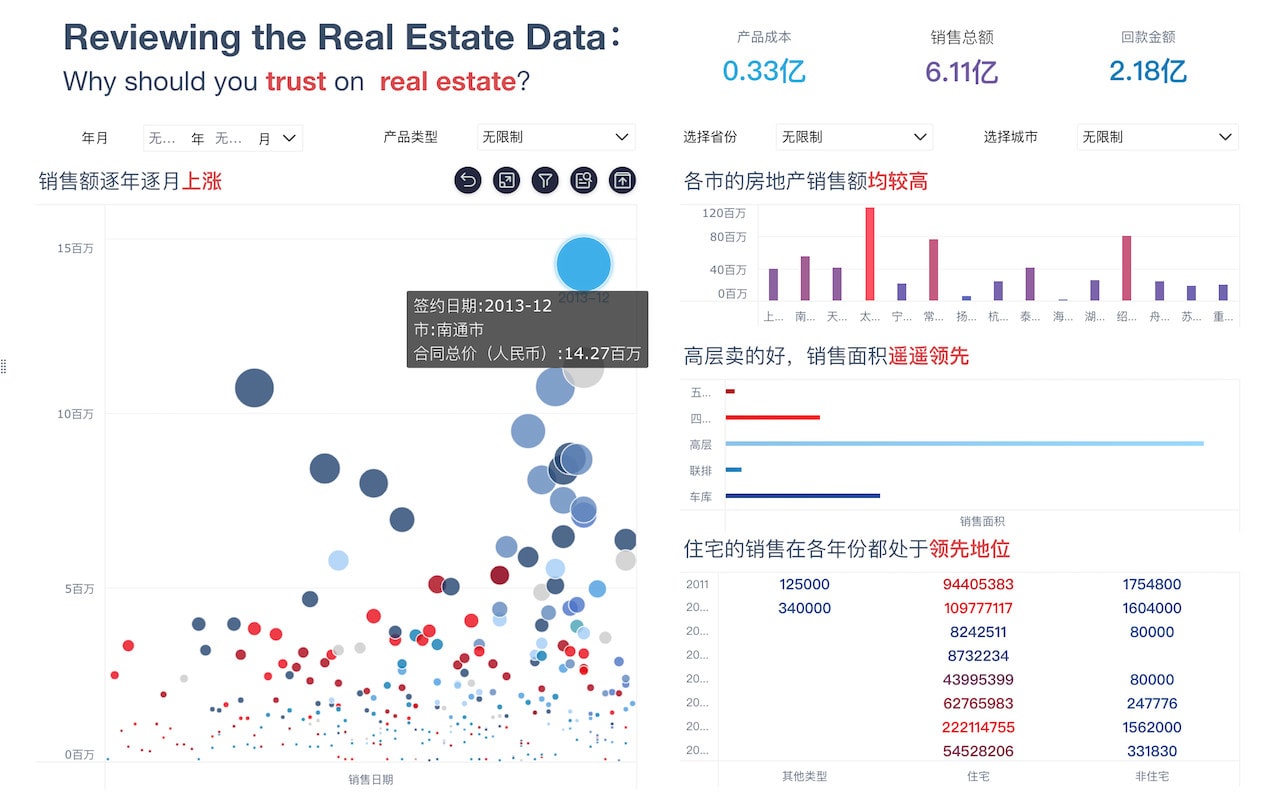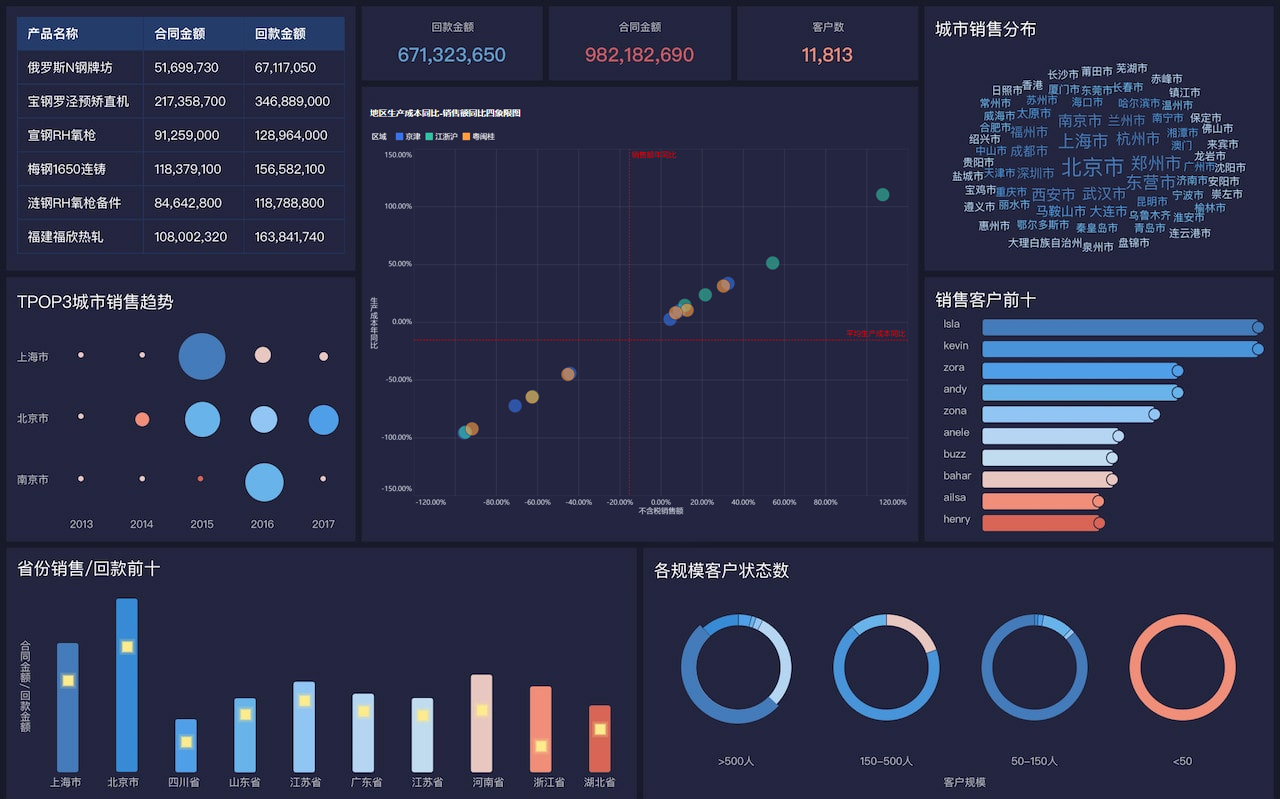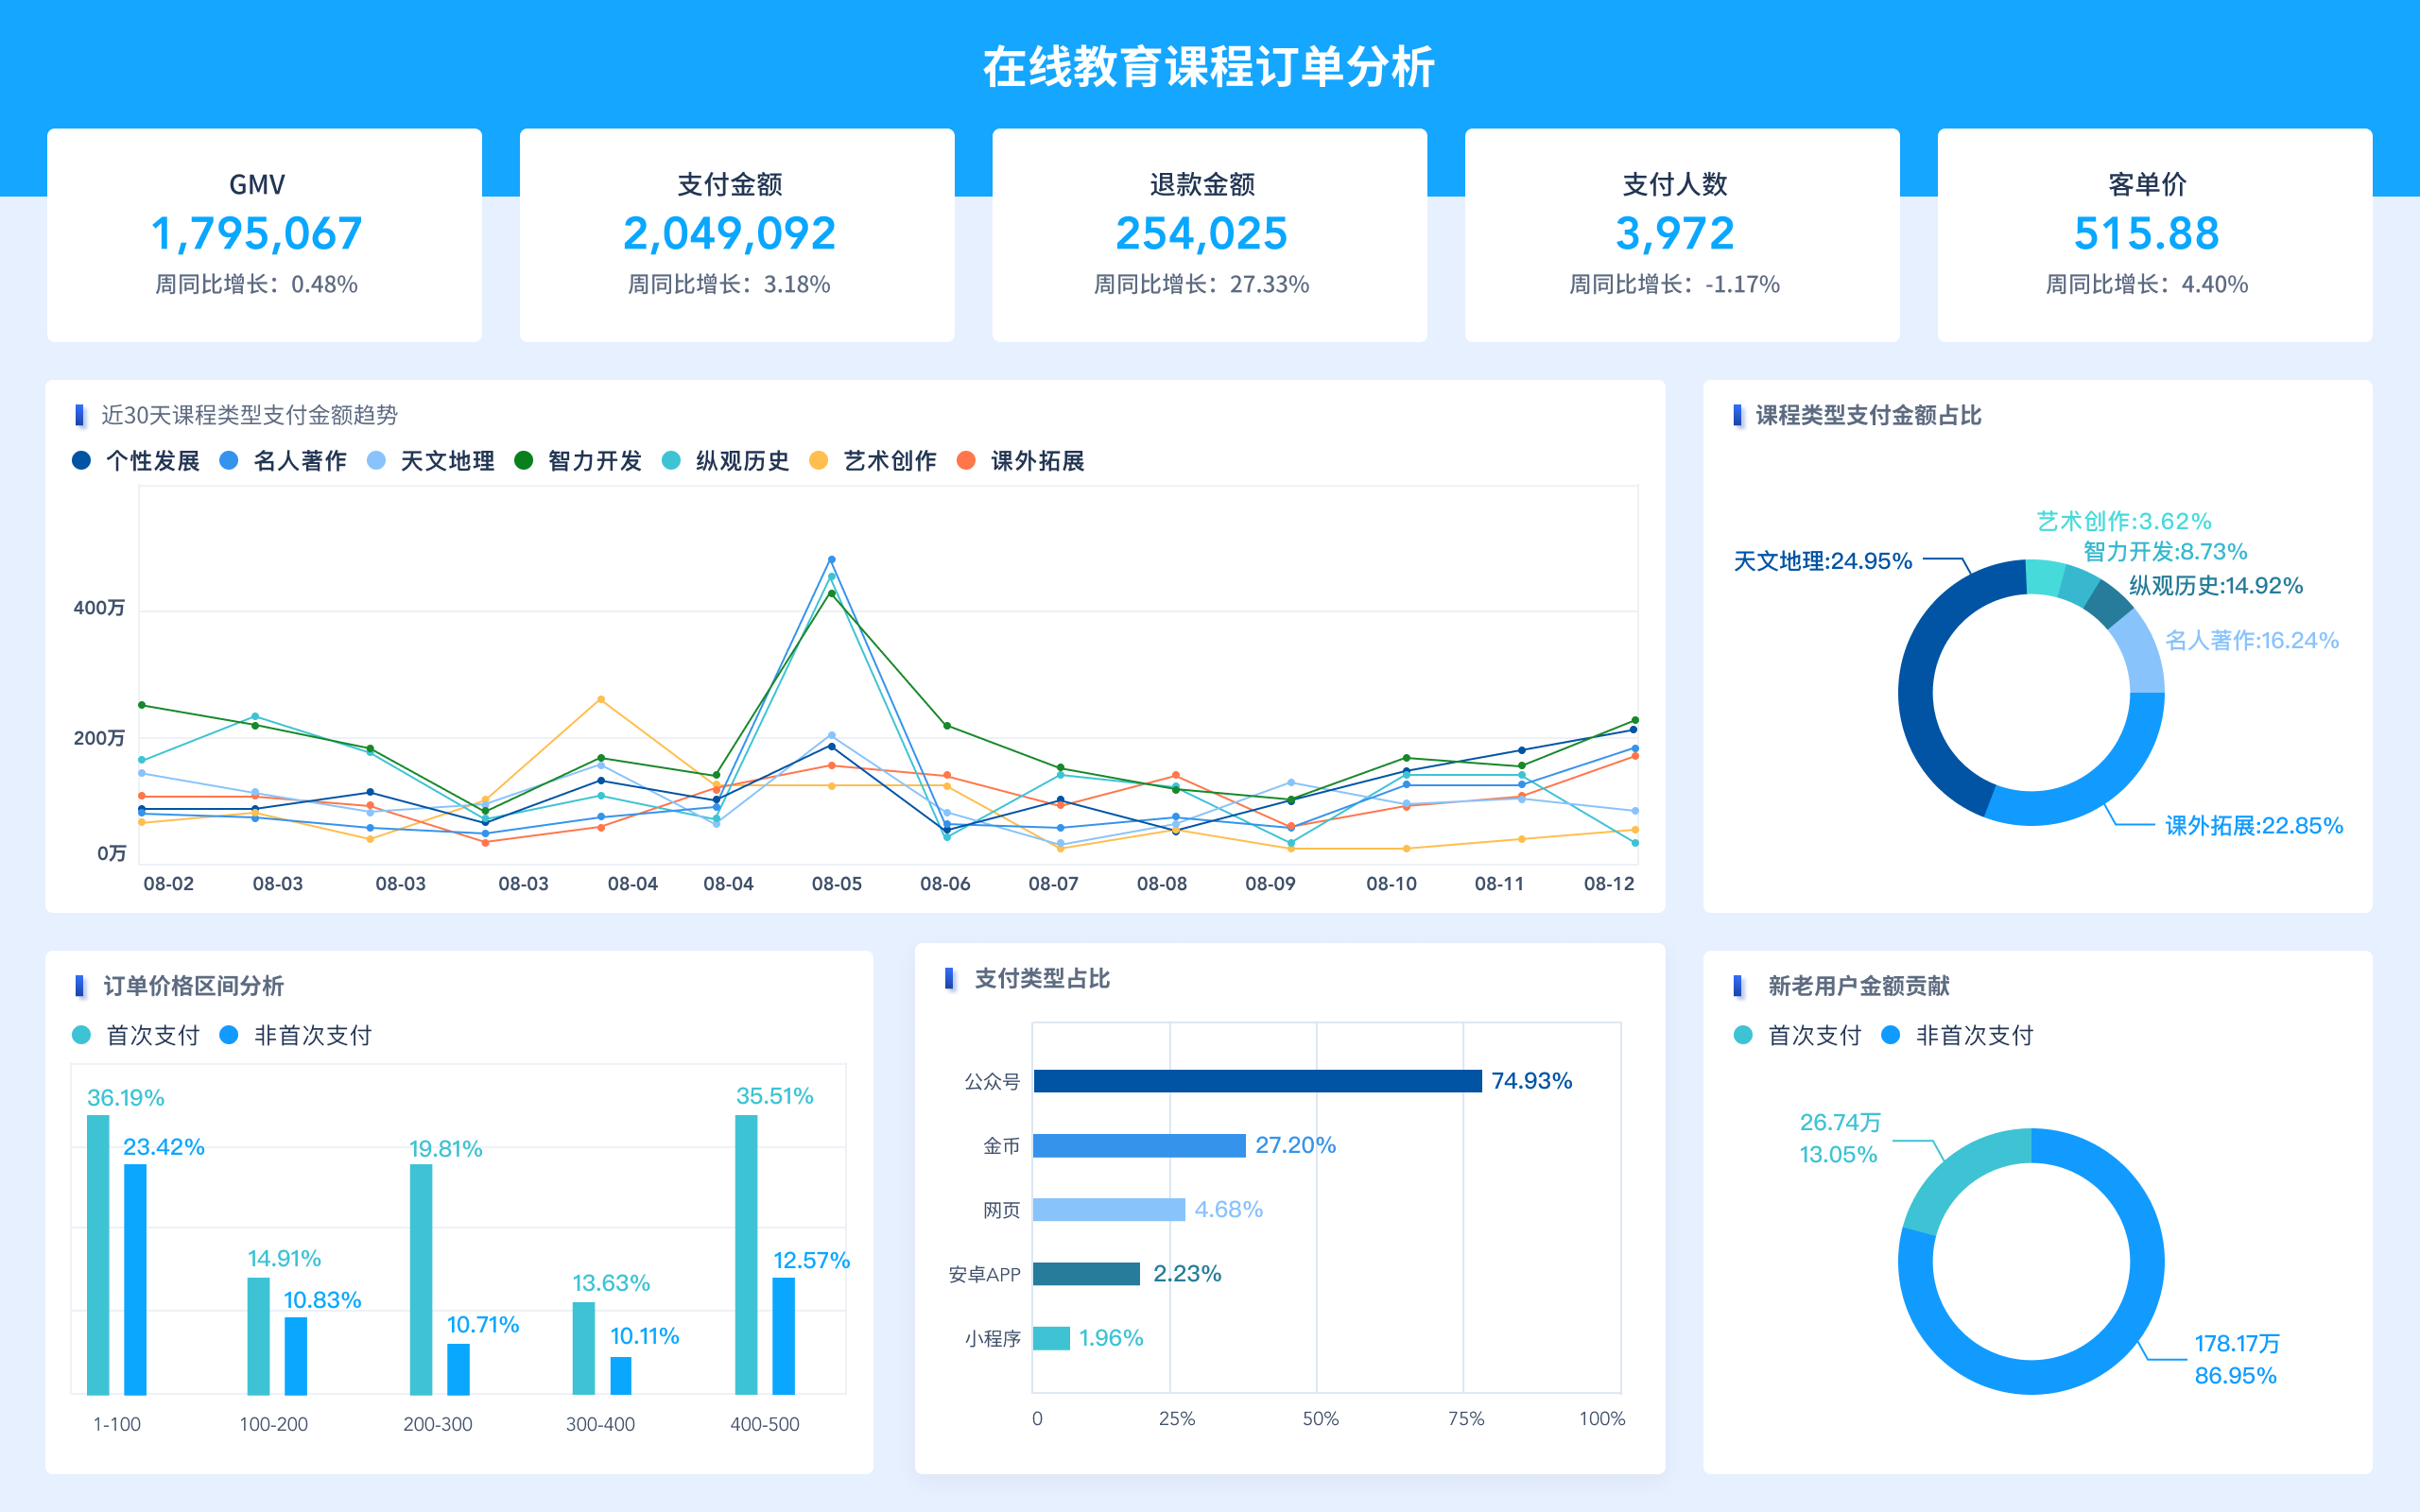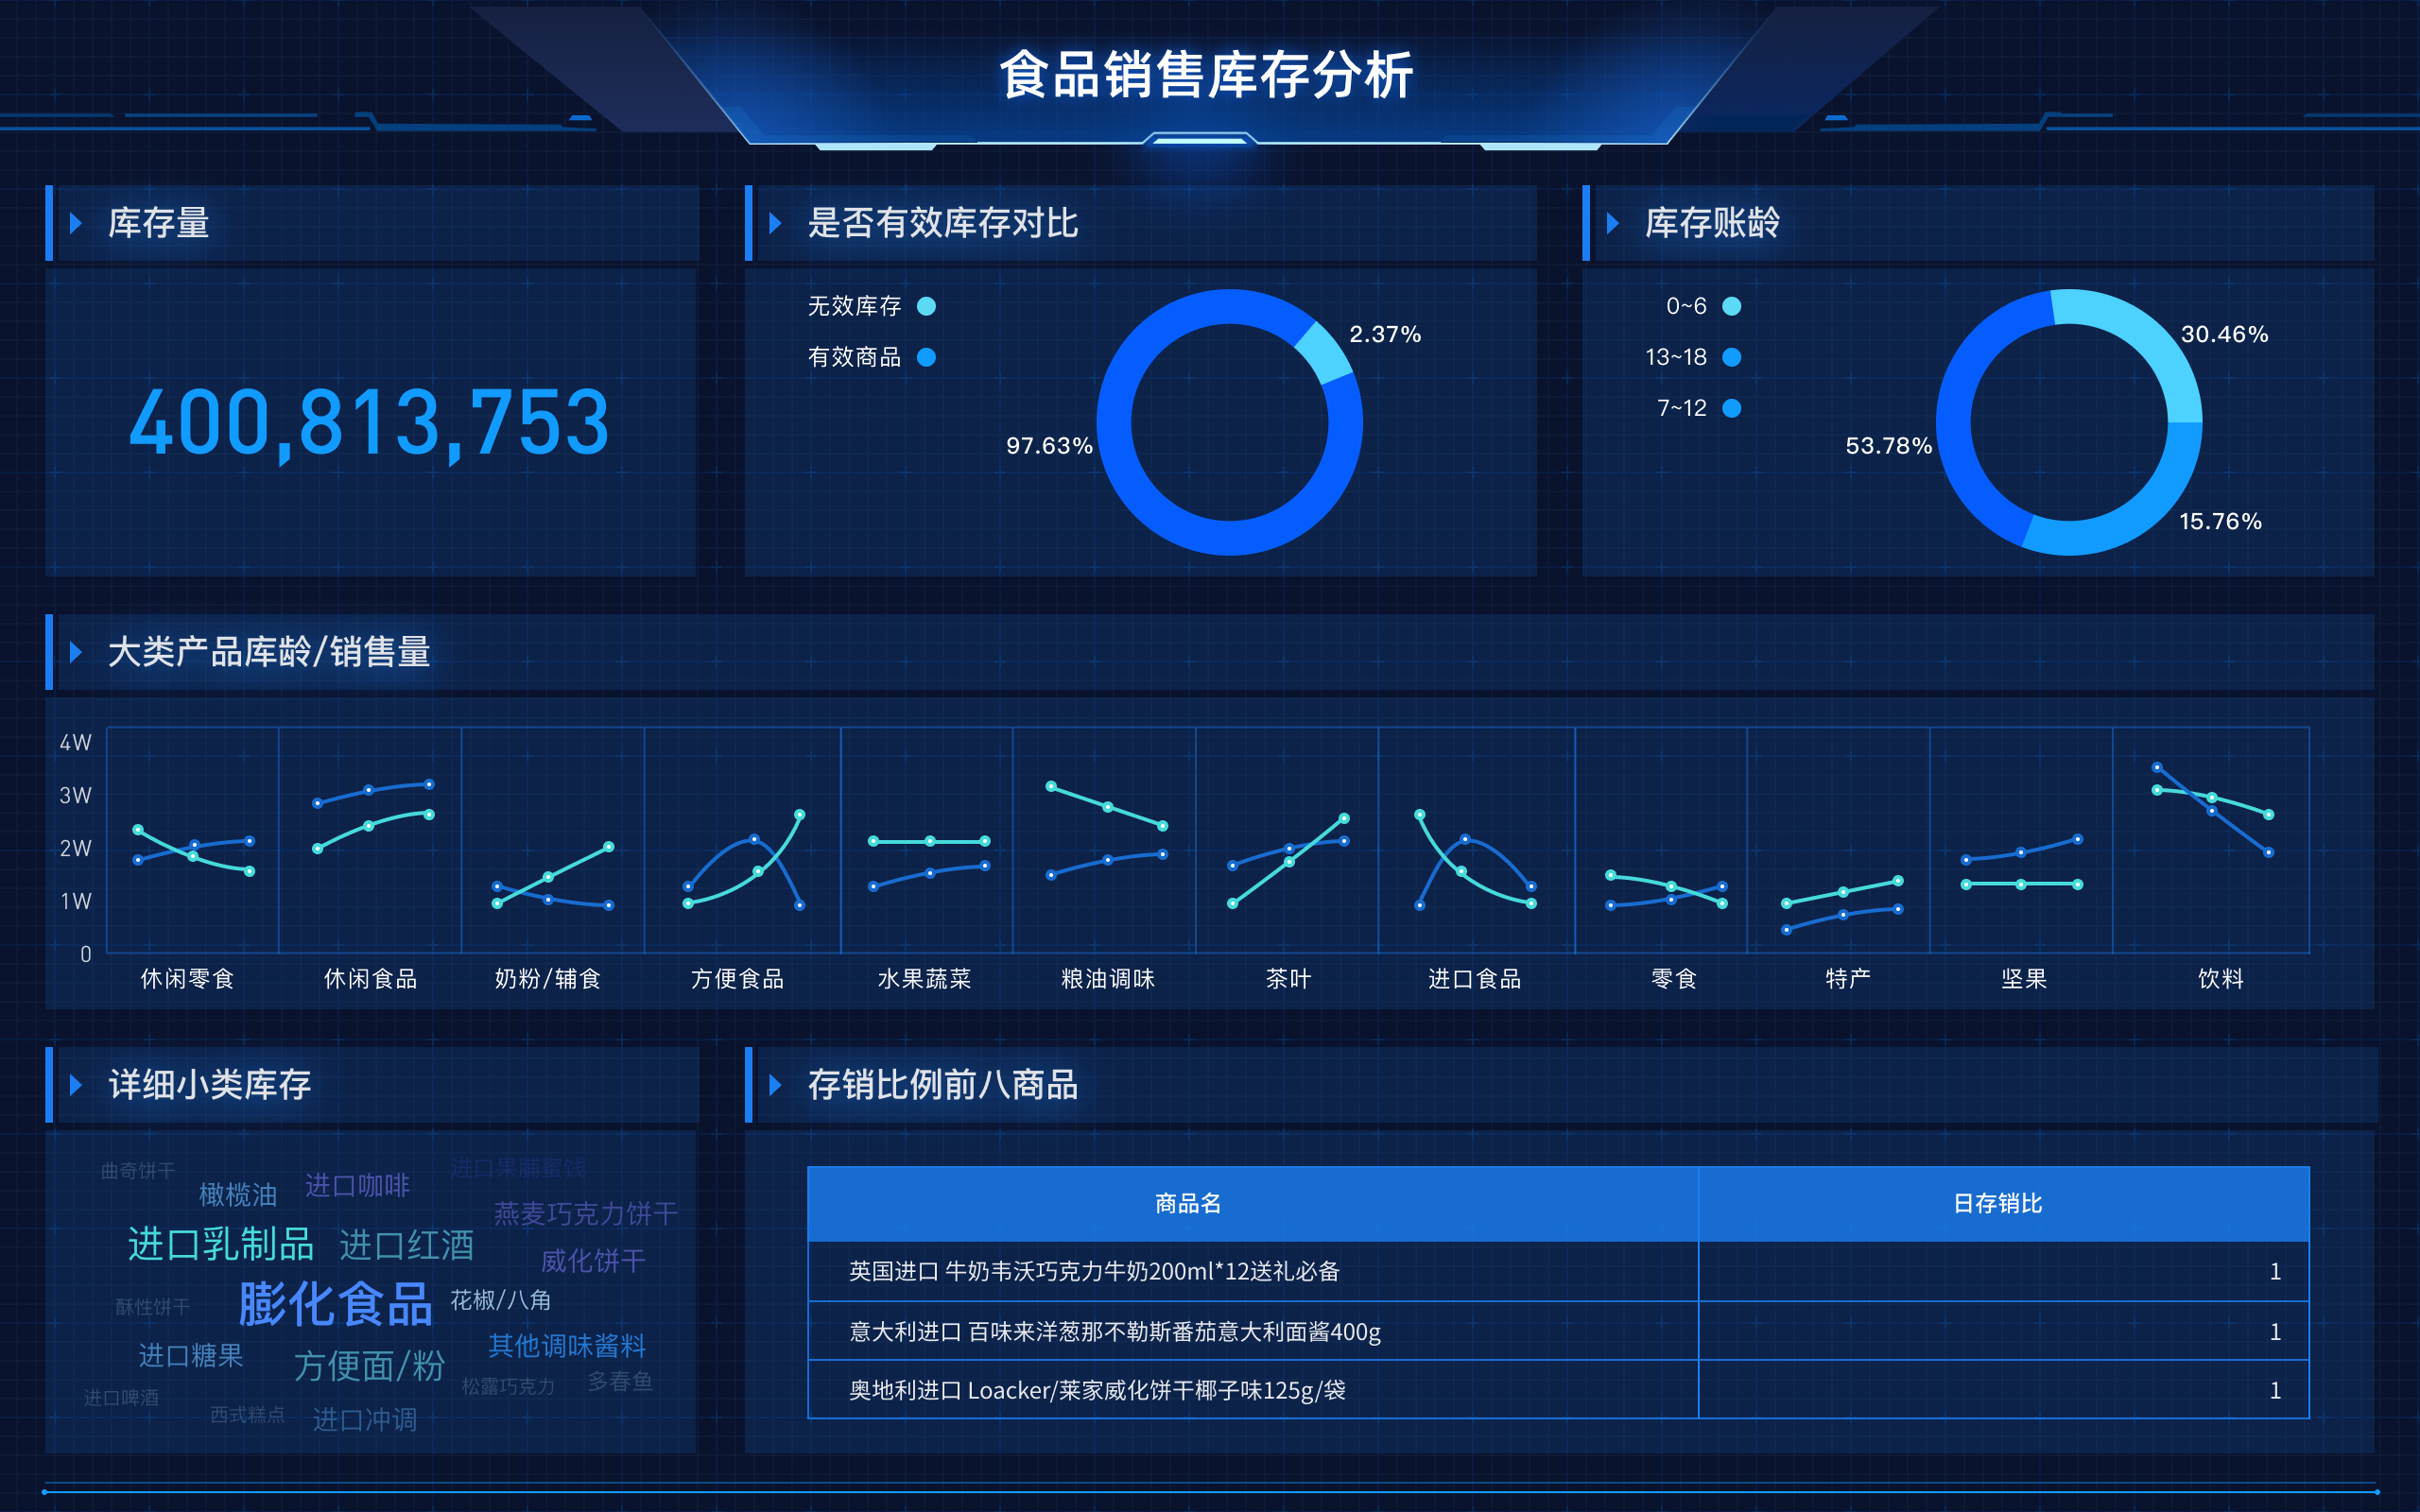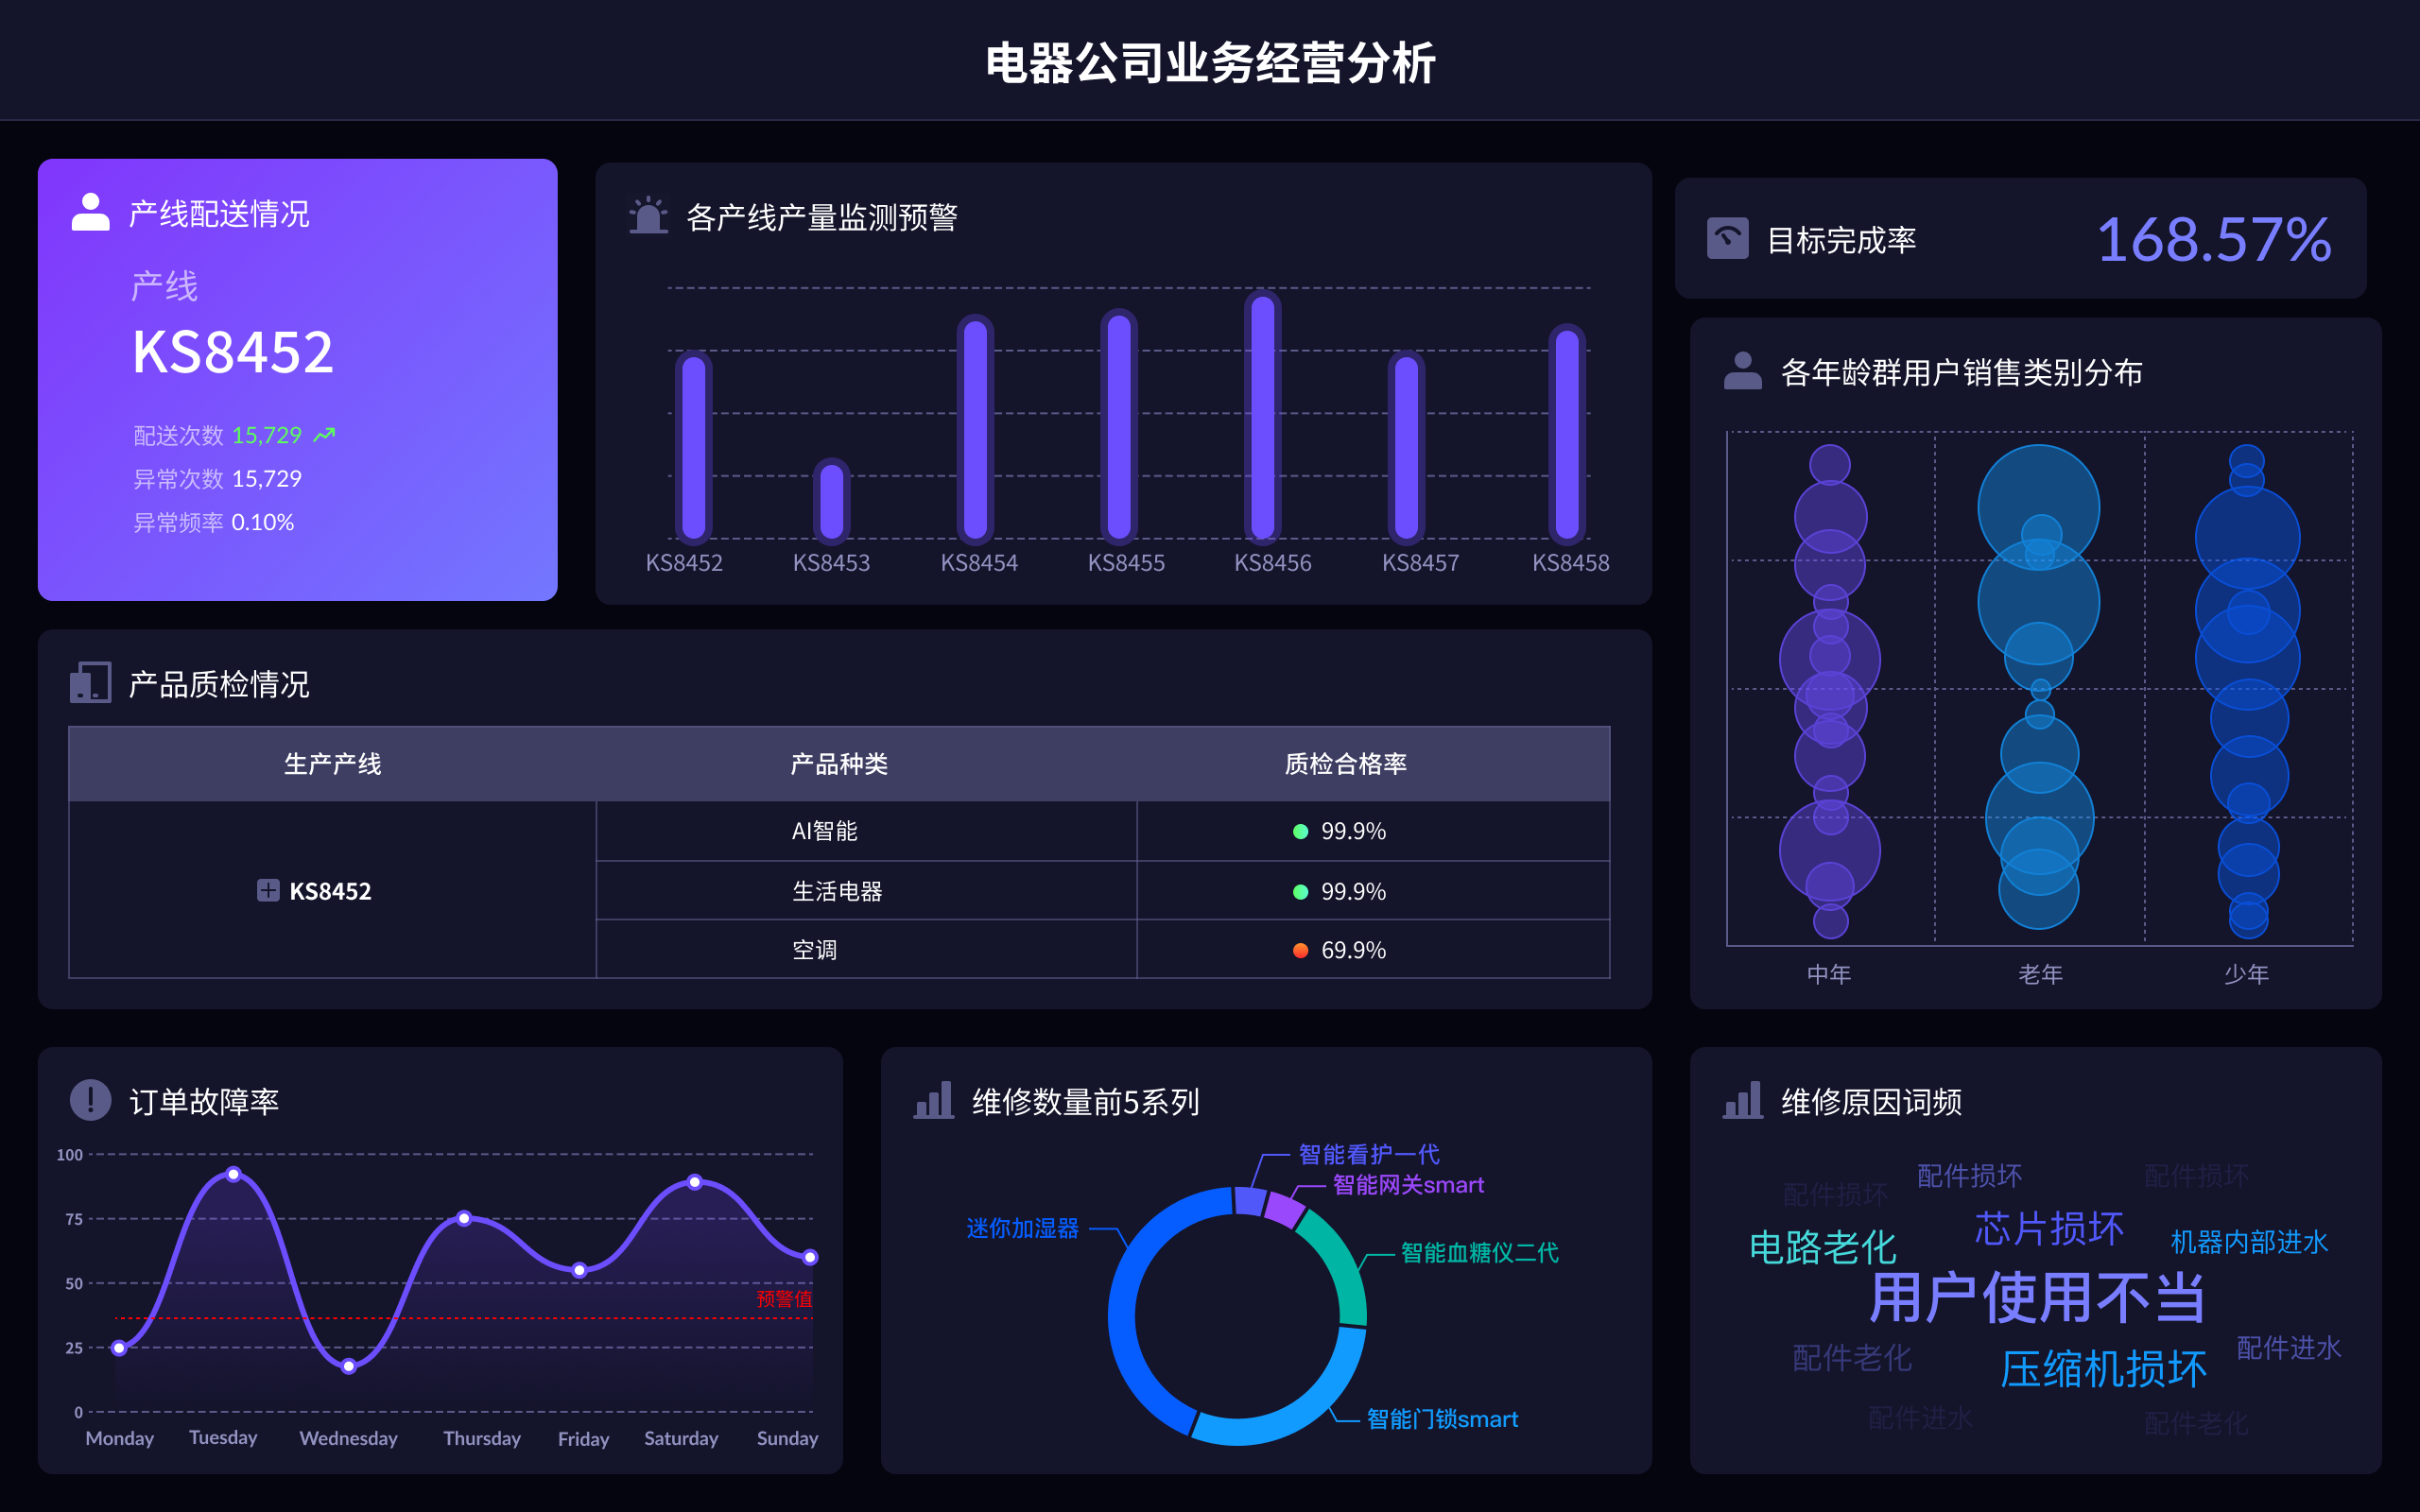
报表工具的英文是“Reporting Tool”,常用的报表工具有FineReport、FineVis。FineReport是帆软旗下的专业报表工具,能够帮助企业快速生成各种类型的报表;FineVis则是专注于数据可视化的工具,通过丰富的图表类型和直观的操作界面,帮助用户更好地理解数据。例如,FineReport支持多种数据源连接、数据处理功能强大,能够生成图表、表格等多种格式的报表,满足企业的多样化需求。
一、报表工具的定义与类型
报表工具,即Reporting Tool,是用于生成和管理报表的软件工具。这类工具可以帮助企业和个人从各种数据源提取数据,进行分析和展示。常见的报表工具包括Excel、SQL Server Reporting Services (SSRS)、Tableau、FineReport等。报表工具按功能和用途可以分为基础报表工具、数据可视化工具、商业智能(BI)工具等。基础报表工具多用于生成简单的表格和图表,数据可视化工具则更注重图形化展示,BI工具则集成了数据分析、数据挖掘等高级功能。
二、FineReport与其他报表工具的比较
FineReport作为专业的报表工具,与其他报表工具相比具有以下优势:数据源连接多样、数据处理功能强大、报表类型丰富、操作界面友好。FineReport支持Excel、数据库、Web Service等多种数据源,能够自动化处理数据并生成各种类型的报表。与Excel相比,FineReport在数据量大、报表复杂度高的情况下表现更为出色;与SSRS相比,FineReport的用户界面更加友好,操作更为简单,适合非技术用户使用;与Tableau相比,FineReport在报表的格式和样式定制上更为灵活。
三、FineReport的核心功能
FineReport的核心功能包括:数据连接、数据处理、报表设计、报表发布、数据分析。数据连接功能支持多种数据源,可以轻松从数据库、Excel等文件中读取数据;数据处理功能强大,支持数据清洗、转换、合并等操作;报表设计功能灵活,支持多种报表类型的设计,如表格报表、图表报表、复合报表等;报表发布功能便捷,可以将报表发布到Web端、移动端,支持权限管理;数据分析功能丰富,支持多维分析、透视分析等高级分析功能。
四、FineVis在数据可视化中的应用
FineVis是帆软旗下专注于数据可视化的工具,具有以下特点:图表类型丰富、操作界面直观、支持交互式分析。FineVis提供了多种类型的图表,如柱状图、折线图、饼图、散点图等,用户可以根据数据特点选择最合适的图表类型;操作界面直观,用户可以通过拖拽操作快速完成图表设计;支持交互式分析,用户可以在图表中进行钻取、联动等操作,帮助用户更深入地理解数据。
五、如何选择合适的报表工具
选择合适的报表工具需要考虑以下因素:数据源类型、数据处理需求、报表类型需求、用户技术水平、预算。数据源类型决定了报表工具是否能够连接并读取数据;数据处理需求决定了报表工具是否具备足够的数据清洗和转换能力;报表类型需求决定了报表工具是否能够生成所需的报表格式;用户技术水平决定了报表工具的操作难度是否适合;预算则决定了报表工具的性价比。FineReport和FineVis在这些方面都有很好的表现,适合不同类型的企业和用户选择。
六、FineReport和FineVis的实际应用案例
FineReport和FineVis在各行各业都有广泛的应用。例如,在零售行业,企业可以使用FineReport生成销售报表、库存报表,帮助管理层了解销售情况和库存情况;在金融行业,FineReport可以生成财务报表、风险报表,帮助企业进行财务分析和风险管理;在制造业,FineReport可以生成生产报表、质量报表,帮助企业优化生产流程和提高产品质量。FineVis则可以用于营销数据分析,帮助企业通过数据可视化了解市场趋势和客户行为,从而制定更有效的营销策略。
FineReport官网: https://s.fanruan.com/ryhzq
FineVis官网: https://s.fanruan.com/7z296
相关问答FAQs:
1. What is the English translation for "报表工具" and how is it written?
The English translation for "报表工具" is "reporting tool." It is commonly used in the context of software applications or programs that are designed to generate, organize, and present data in the form of reports. In Chinese, "报表工具" is written as "Bàobiǎo gōngjù," while in English, it is written as "reporting tool."
2. What are the functions of a reporting tool?
A reporting tool serves various functions to help users analyze data and create informative reports. Some of the key functions of a reporting tool include:
- Data Collection: Reporting tools can gather data from multiple sources, such as databases, spreadsheets, and online platforms, to create comprehensive reports.
- Data Visualization: Reporting tools use charts, graphs, and other visual elements to present data in a visually appealing and easy-to-understand format.
- Customization: Users can customize the layout, design, and content of reports to meet their specific needs and preferences.
- Automation: Reporting tools can automate the process of generating and distributing reports, saving time and reducing errors.
- Collaboration: Reporting tools often have features that allow multiple users to work on reports simultaneously and share them with others.
3. How can a reporting tool benefit businesses?
Reporting tools play a crucial role in helping businesses make informed decisions and improve their overall performance. Some of the key benefits of using a reporting tool in a business context include:
- Improved Decision-Making: Reporting tools provide valuable insights and analysis that enable decision-makers to make informed choices based on data-driven evidence.
- Increased Efficiency: By automating the process of report generation, reporting tools save time and resources, allowing employees to focus on more strategic tasks.
- Enhanced Visibility: Reporting tools offer a clear and comprehensive view of business performance, helping identify trends, patterns, and areas for improvement.
- Better Communication: Reporting tools facilitate communication and collaboration among team members by providing a centralized platform for sharing information and insights.
- Regulatory Compliance: Reporting tools help businesses meet regulatory requirements by ensuring accurate and timely reporting of financial and operational data.
In conclusion, reporting tools are essential tools for businesses looking to streamline their data analysis and reporting processes, ultimately leading to better decision-making and improved performance.
本文内容通过AI工具匹配关键字智能整合而成,仅供参考,帆软不对内容的真实、准确或完整作任何形式的承诺。具体产品功能请以帆软官方帮助文档为准,或联系您的对接销售进行咨询。如有其他问题,您可以通过联系blog@fanruan.com进行反馈,帆软收到您的反馈后将及时答复和处理。


