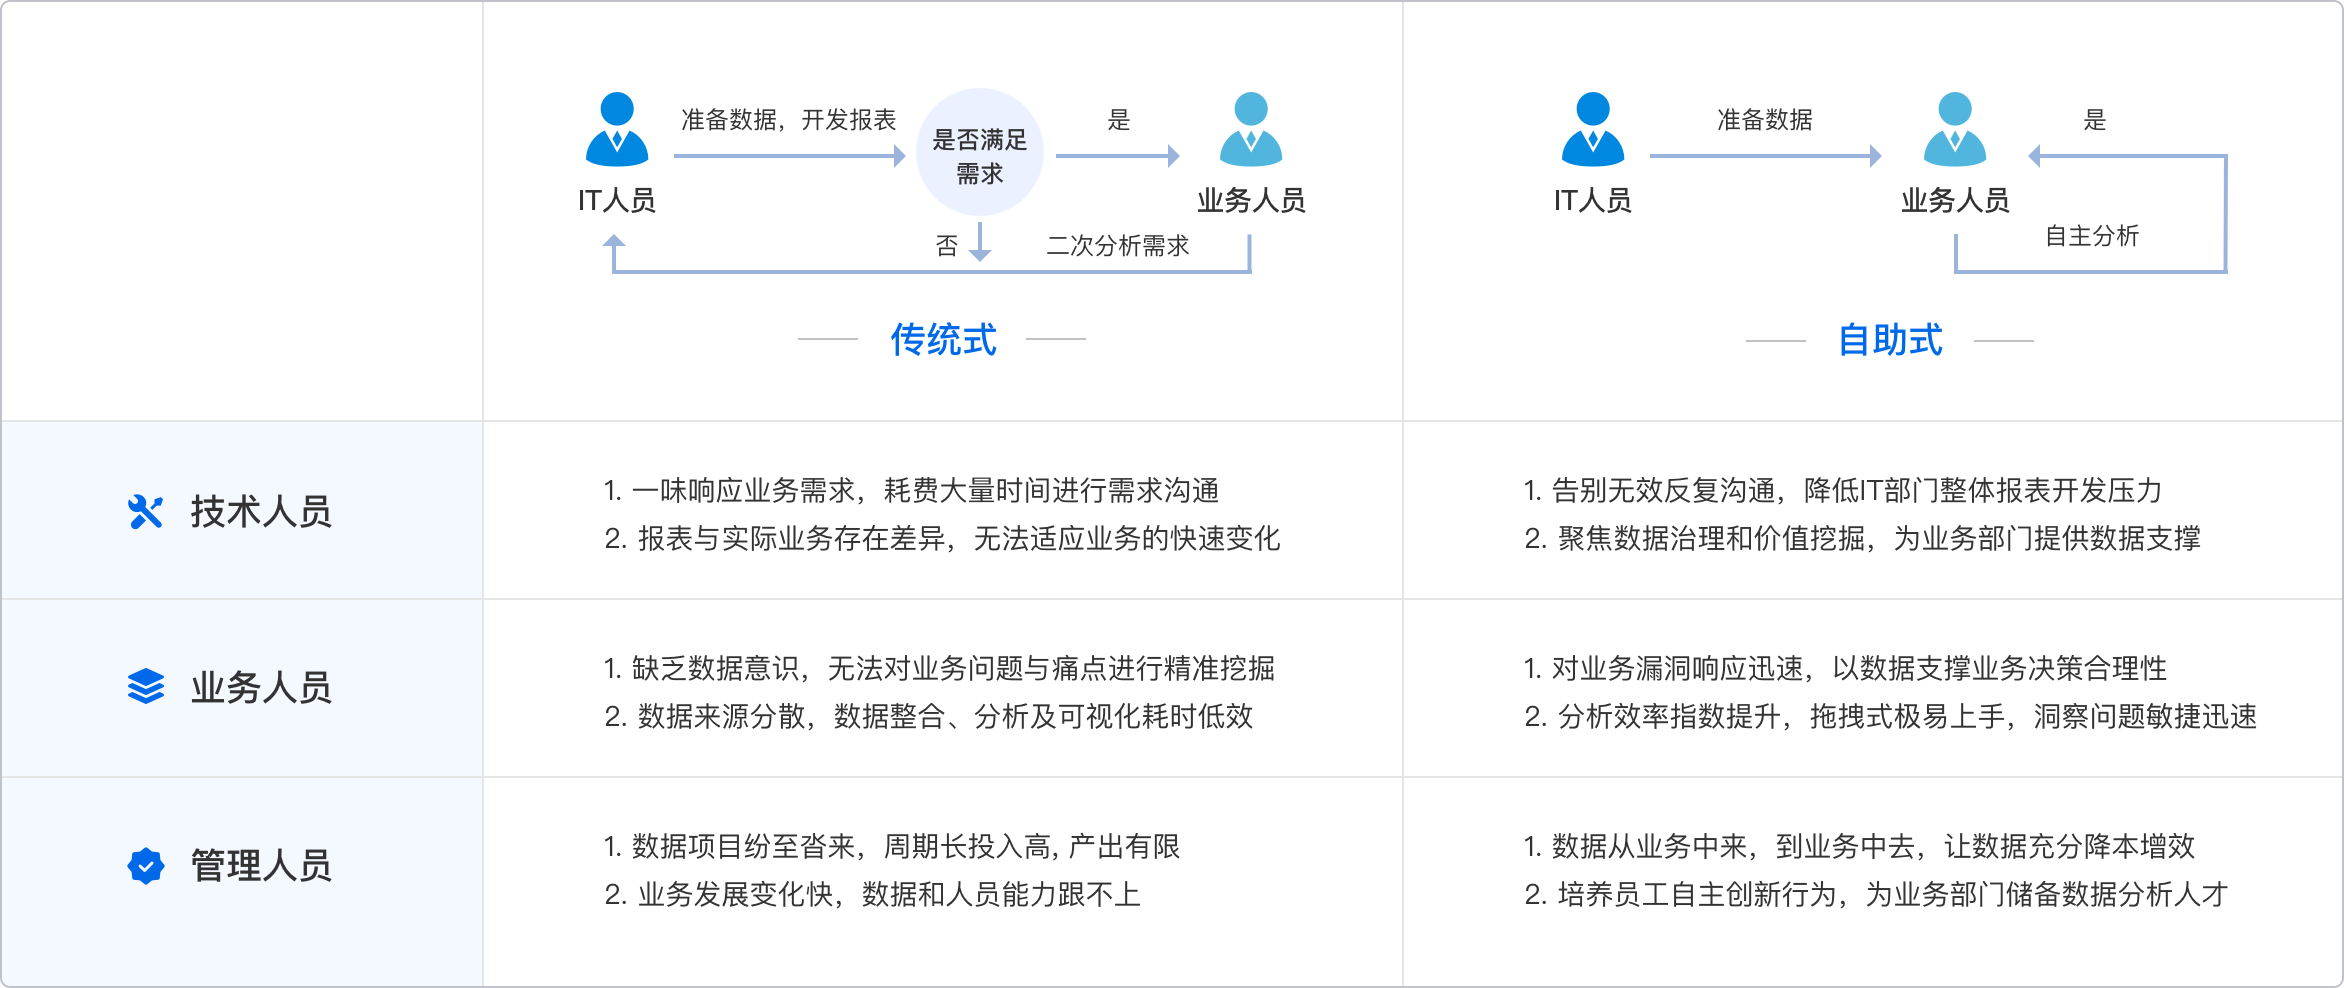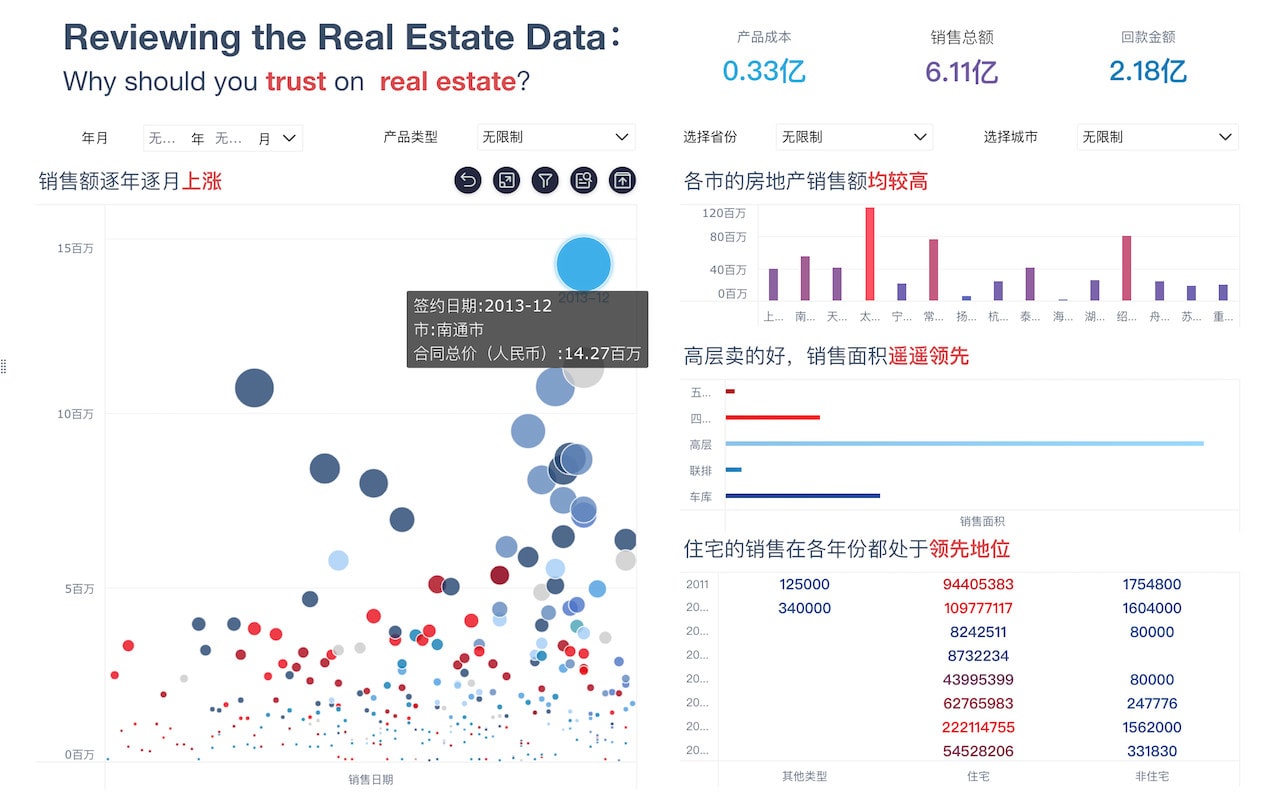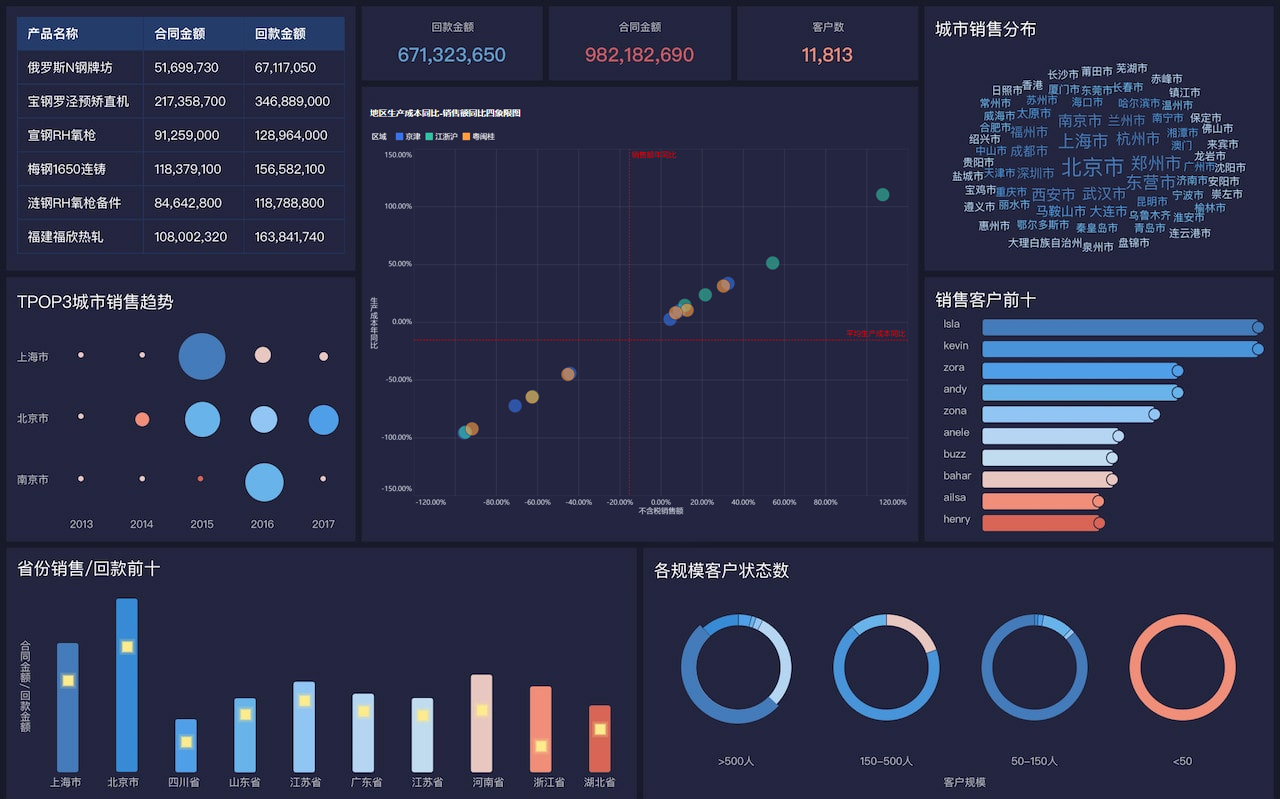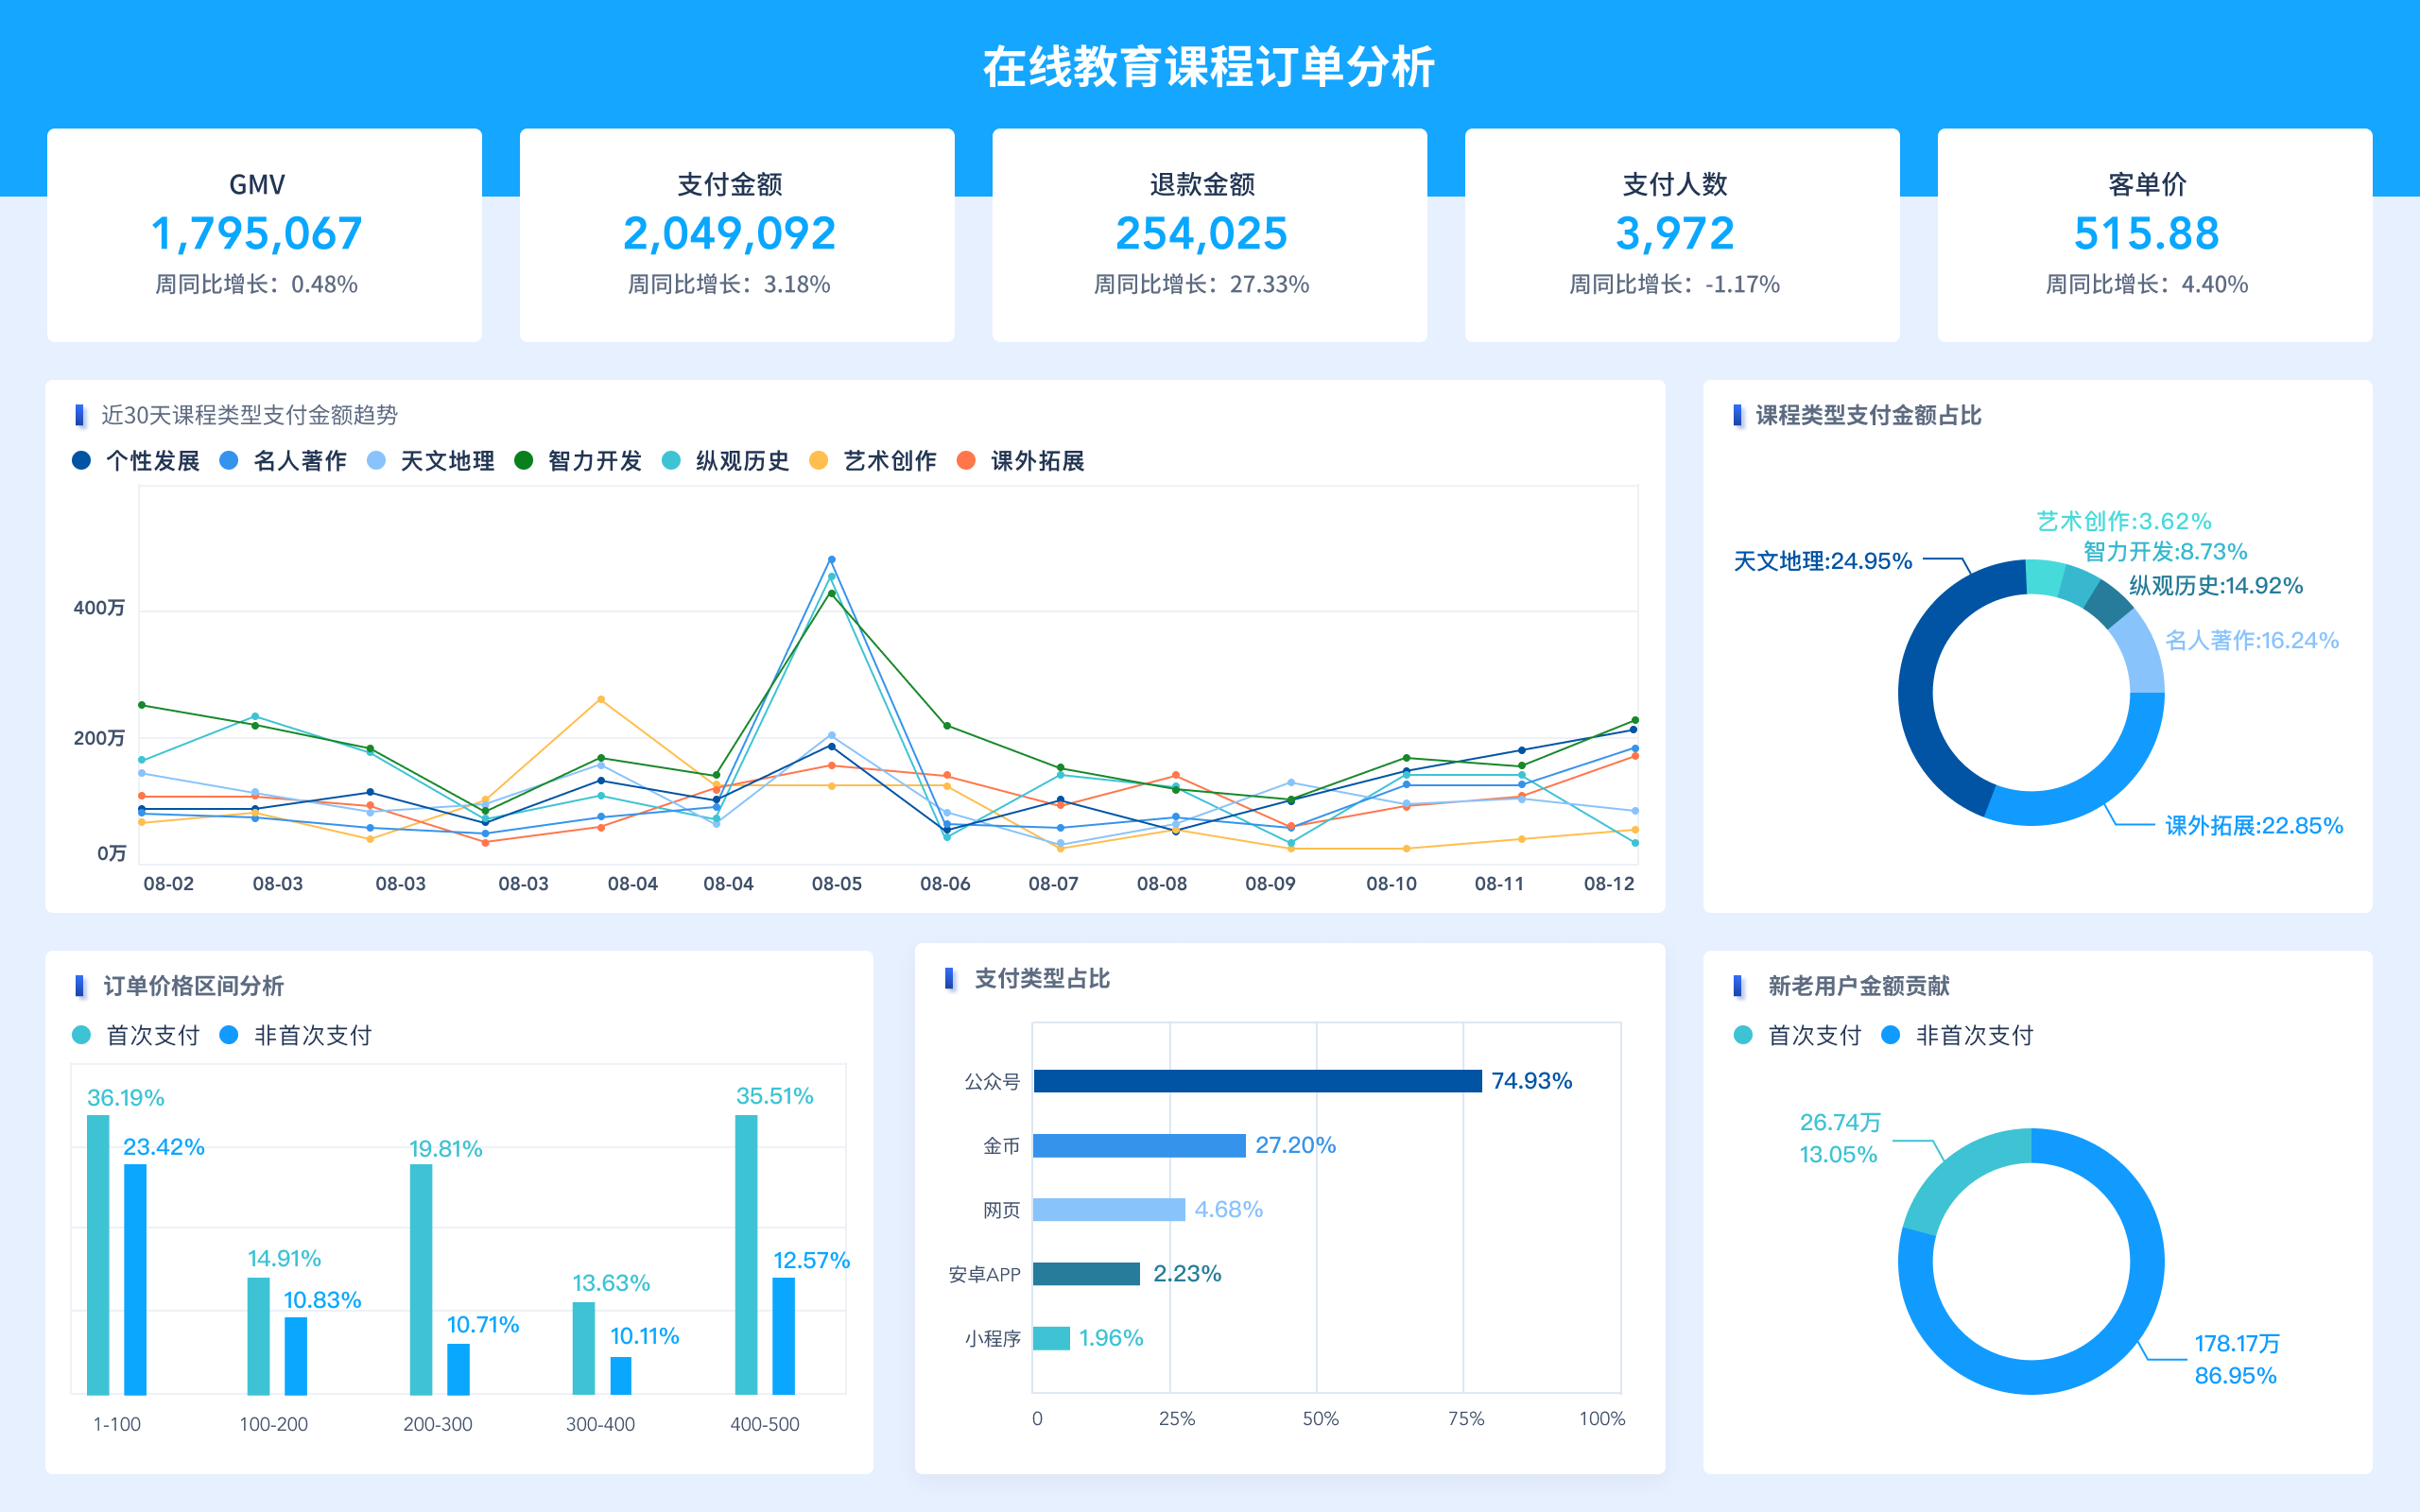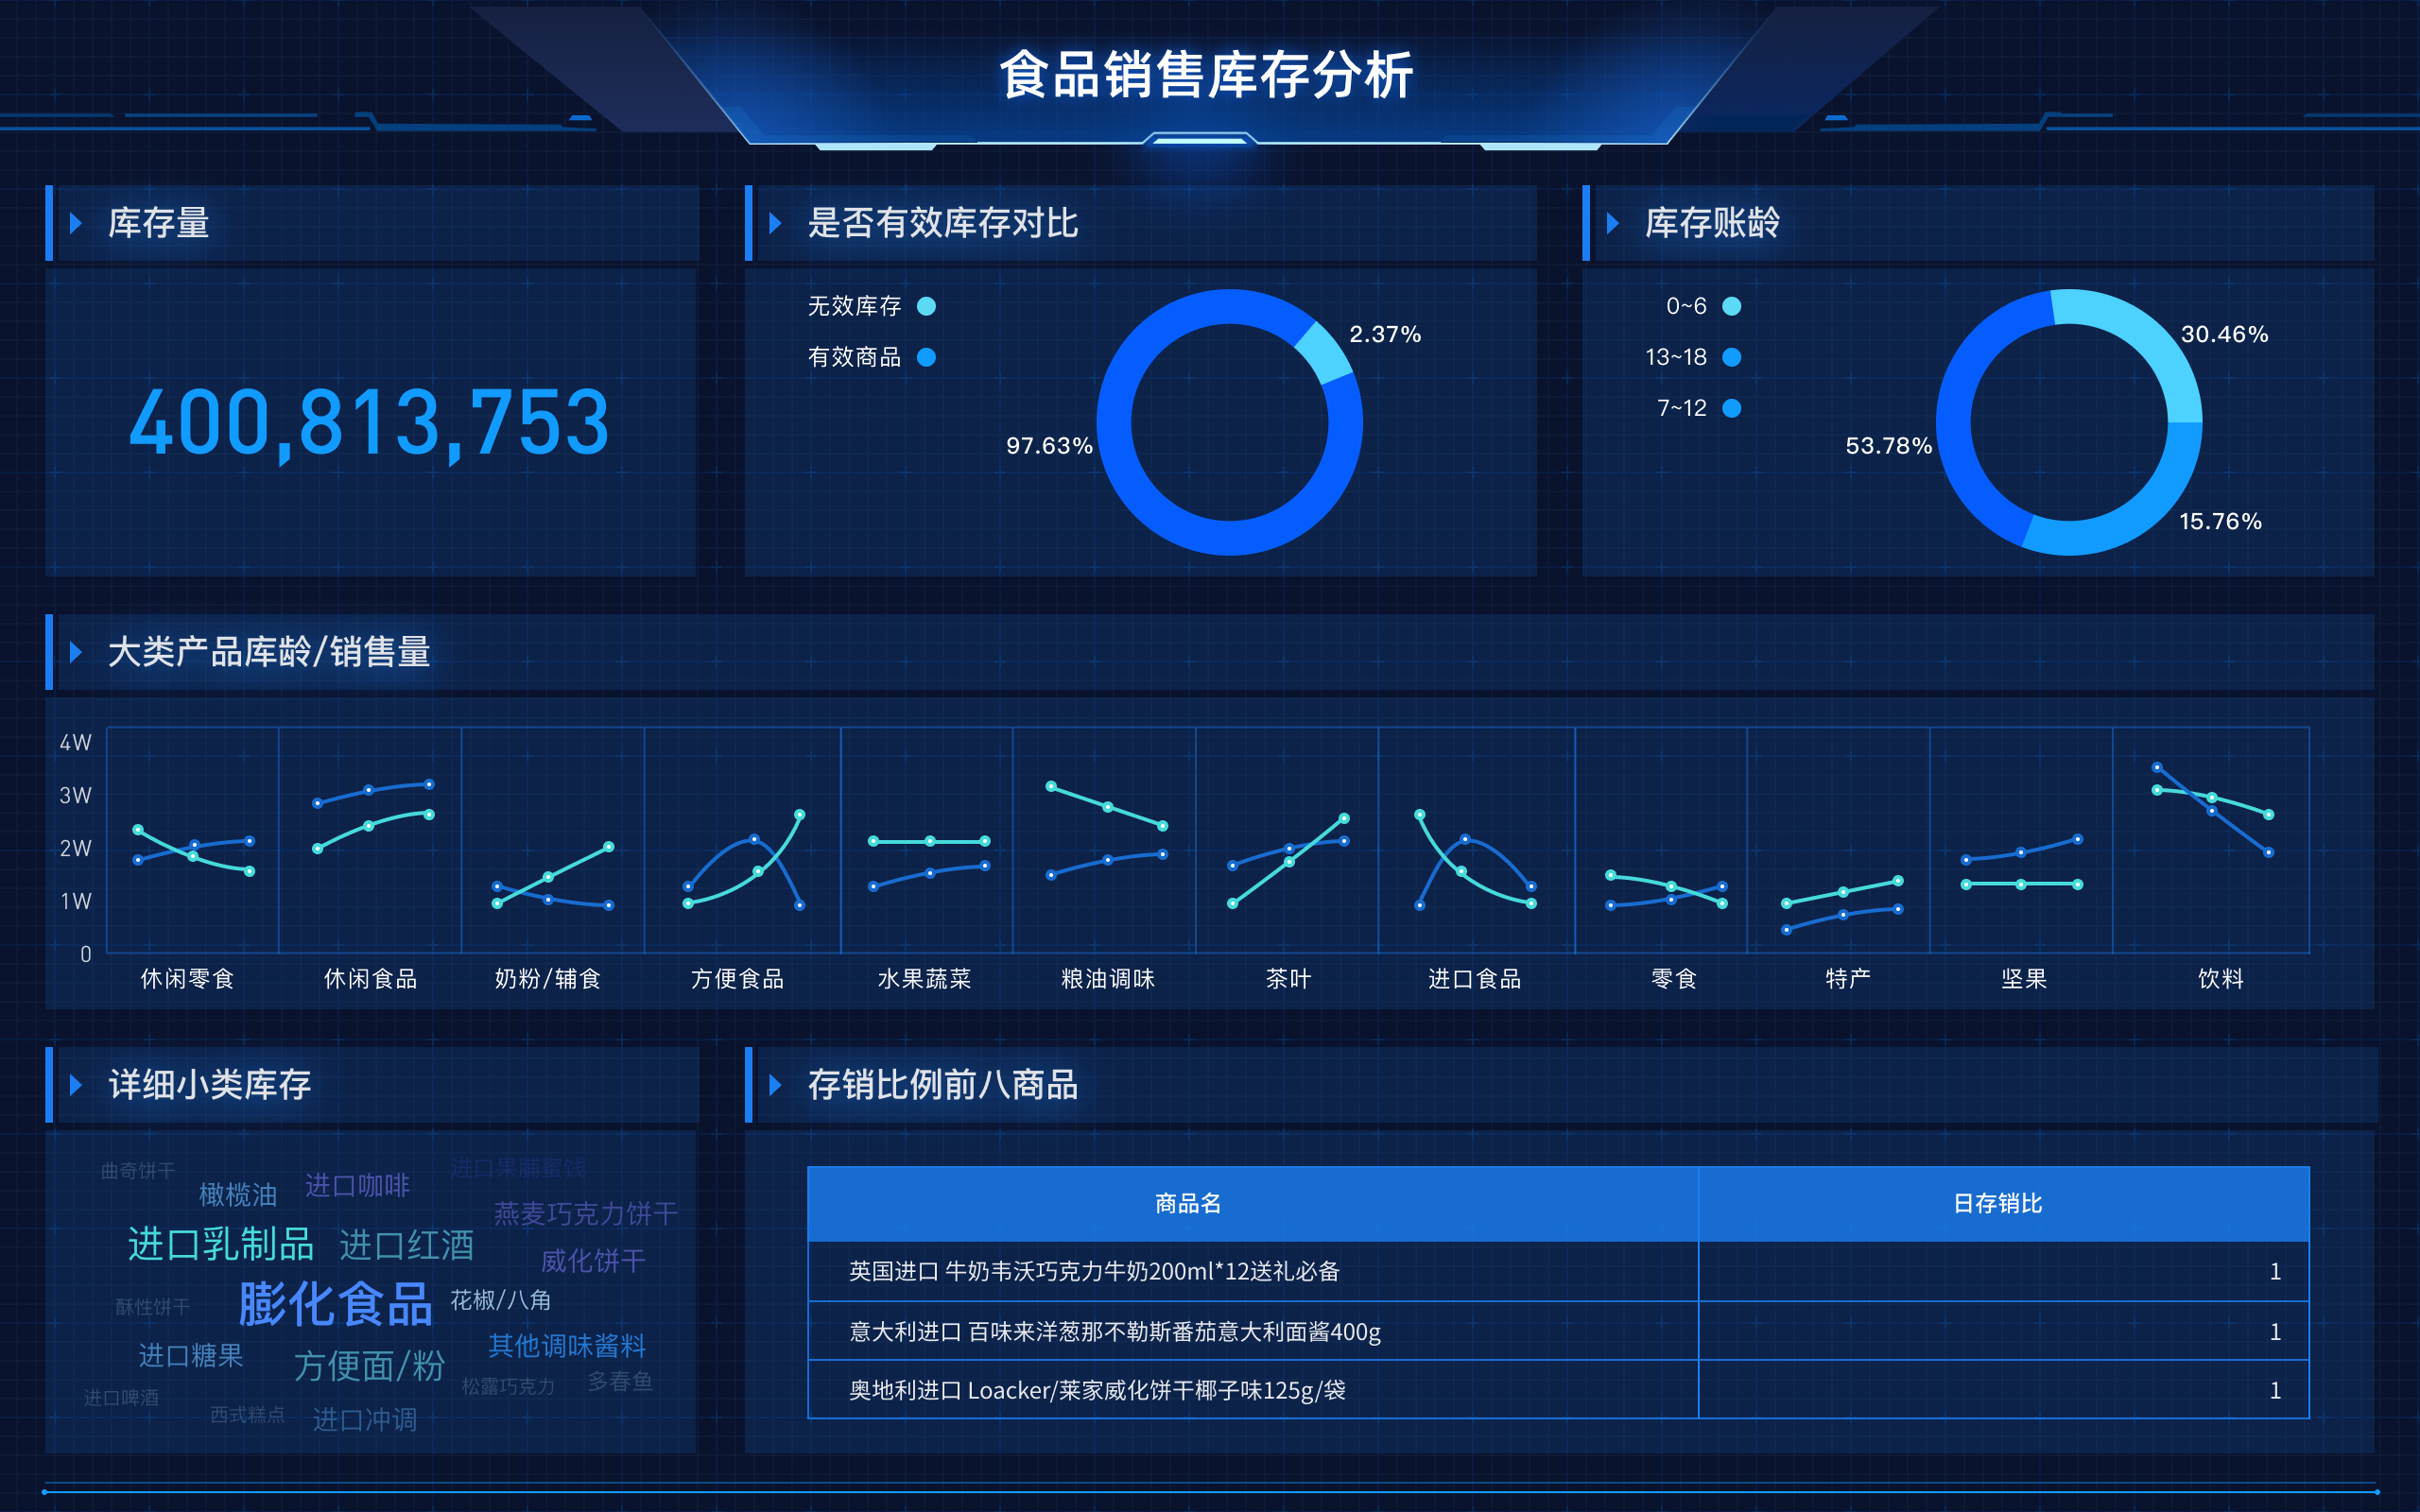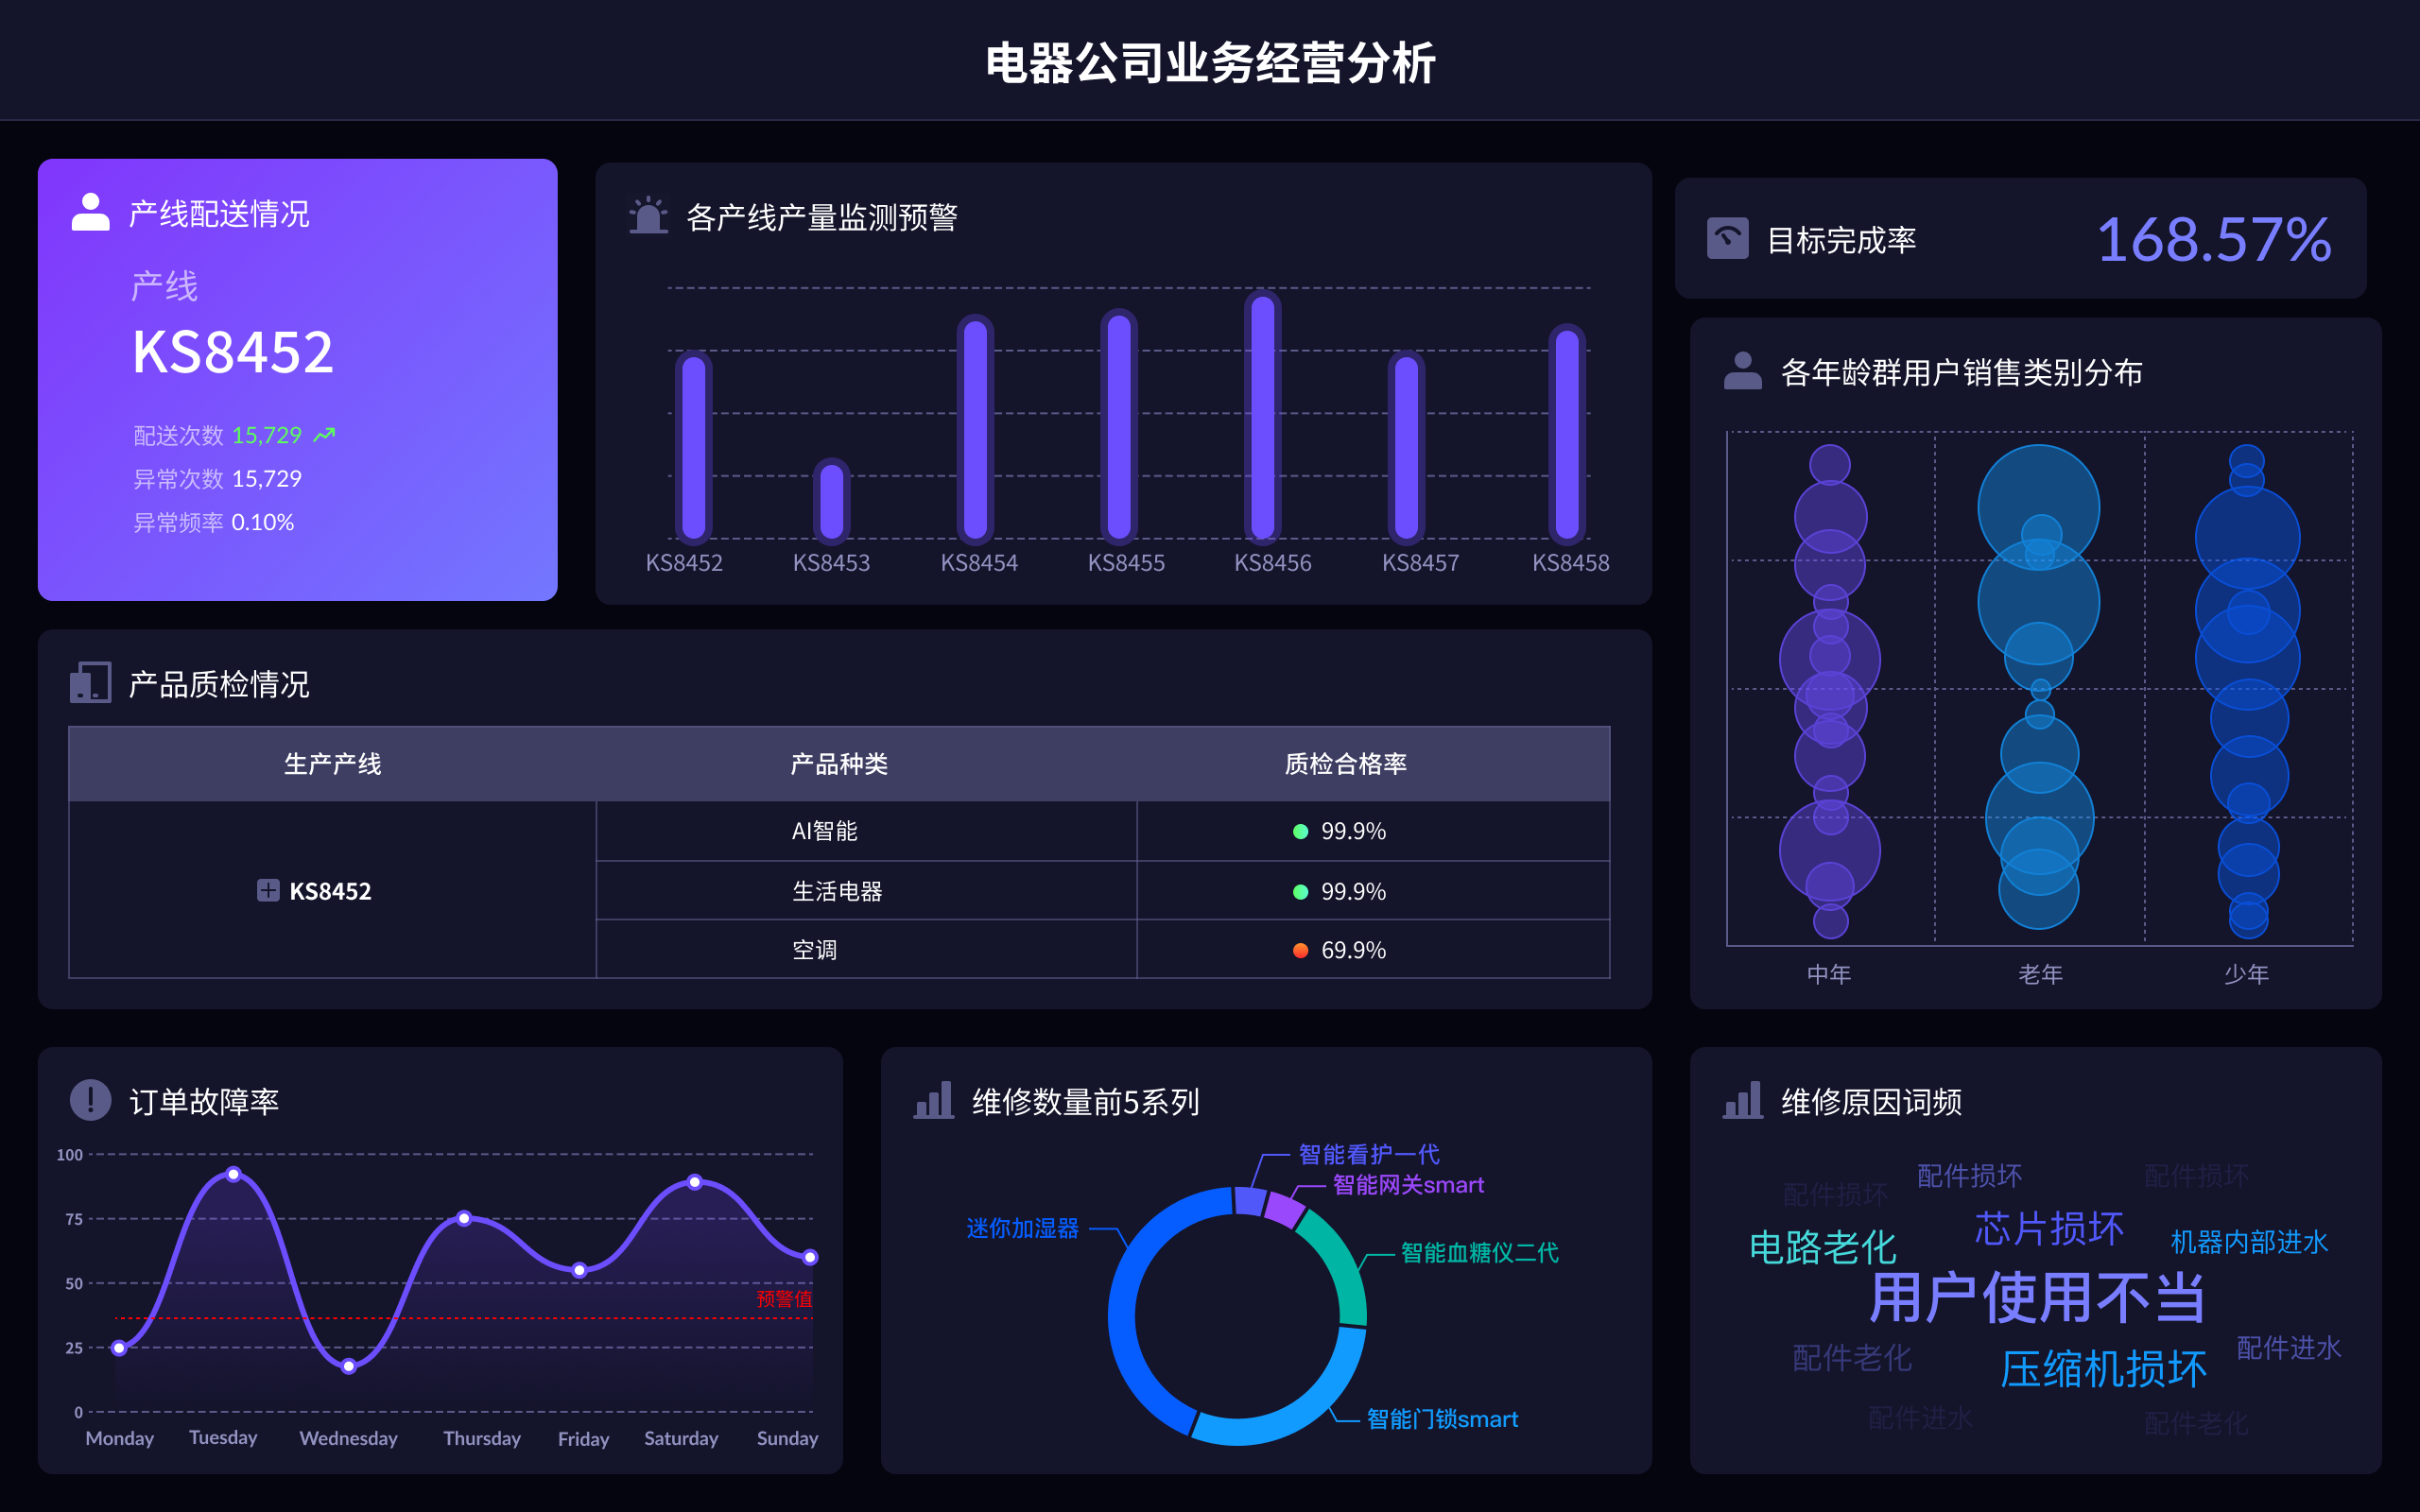
报表工具的英文表达可以是:Report Tool、Reporting Software、Business Intelligence Tool。其中Business Intelligence Tool(商业智能工具)不仅涵盖了报表功能,还延展到数据分析和可视化,为企业提供更全面的解决方案。Business Intelligence Tool通常具有强大的数据处理能力和多样化的可视化选项,能够帮助企业更好地理解和利用数据,从而做出更明智的决策。
一、REPORT TOOL、REPORTING SOFTWARE、BUSINESS INTELLIGENCE TOOL
Report Tool是一种基础的报表生成工具,主要用于将数据转换为结构化的报告文档。它通常具有简单的用户界面,操作方便,适合中小型企业或个人使用。这种工具的主要优点是易于使用、成本低廉、能够快速生成基础报表。Report Tool能够满足基本的数据展示需求,但在数据分析和高级可视化方面可能有所欠缺。
Reporting Software是一种更加专业的报表工具,具备更强大的数据处理能力和更多的功能。它不仅可以生成复杂的报表,还能够进行数据分析、数据挖掘等操作。Reporting Software通常支持多种数据源,可以与企业的数据库、ERP系统、CRM系统等进行无缝对接。其主要优点是功能全面、灵活性高、支持多种数据源。这种工具适合中大型企业使用,能够满足复杂的业务需求。
Business Intelligence Tool不仅仅是一个报表工具,它还包含了数据分析、数据可视化和数据挖掘等功能。BI工具通过对企业数据的深度分析,帮助企业发现潜在的商业机会和风险。强大的数据处理能力、多样化的可视化选项、全面的分析功能是BI工具的主要优点。BI工具不仅可以生成精美的报表,还能够帮助企业更好地理解和利用数据,从而做出更明智的决策。FineReport和FineVis就是这样的BI工具,它们不仅支持报表生成,还具备强大的数据分析和可视化功能。访问FineReport官网: https://s.fanruan.com/ryhzq 和FineVis官网: https://s.fanruan.com/7z296 了解更多。
二、FINEVIS与其他BI工具的对比
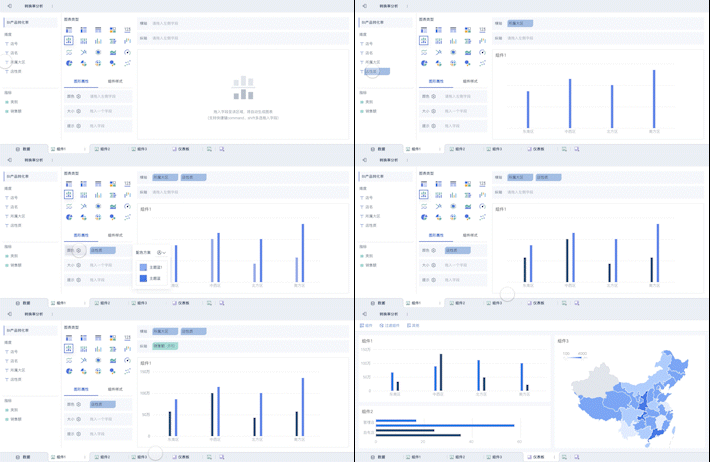
FineVis作为帆软旗下的BI工具,与市场上其他BI工具相比有其独特的优势。首先,FineVis在数据可视化方面具有极高的灵活性和美观度。它提供了丰富的图表类型和自定义选项,用户可以根据需求自由调整图表的样式和布局。其次,FineVis的操作界面友好,即使是没有编程基础的用户也能轻松上手。最后,FineVis还支持多种数据源,无论是传统的关系型数据库还是现代的云数据仓库,FineVis都能够无缝对接。
其他BI工具如Tableau、Power BI等也具有强大的数据分析和可视化功能,但在易用性和灵活性方面可能不如FineVis。例如,Tableau虽然功能强大,但其学习曲线较陡峭,用户需要花费较多时间来熟悉其操作界面。而Power BI虽然与微软生态系统高度集成,但在跨平台兼容性和图表自定义方面有所欠缺。相比之下,FineVis提供了更直观的操作体验和更多的自定义选项,能够更好地满足用户的需求。
三、FINEVIS和FINEREPORT的协同作用
FineVis和FineReport都是帆软旗下的产品,它们在功能上有一定的互补性,可以通过协同作用为企业提供更全面的数据解决方案。FineReport主要侧重于报表生成和数据展示,其强大的报表设计功能和灵活的数据源支持,使其成为企业日常报表工作的得力助手。而FineVis则侧重于数据可视化和数据分析,通过丰富的图表类型和多样化的分析手段,帮助企业深入挖掘数据价值。
两者的协同作用体现在多个方面。首先,FineReport可以作为数据源,为FineVis提供基础数据。用户可以在FineReport中设计复杂的报表,然后将数据导入FineVis进行可视化和分析。其次,FineVis可以对FineReport生成的报表进行二次加工,通过数据可视化工具对报表数据进行更深入的分析和展示。最后,两者的无缝集成使得企业在数据处理和分析过程中能够更加高效和便捷,既满足了日常报表需求,又能够进行高级数据分析。
四、FINEVIS在各行业中的应用
FineVis作为一款强大的BI工具,在各行各业中都有广泛的应用。在金融行业,FineVis可以用于风险管理、客户分析和投资组合优化。通过对金融数据的深度分析,FineVis可以帮助金融机构发现潜在的风险和机会,从而做出更明智的投资决策。在零售行业,FineVis可以用于销售分析、库存管理和市场营销。通过对销售数据的可视化分析,FineVis可以帮助零售企业优化库存、提高销售额和改进市场策略。
在制造行业,FineVis可以用于生产监控、质量管理和供应链优化。通过对生产数据的实时监控和分析,FineVis可以帮助制造企业提高生产效率、减少生产成本和提升产品质量。在医疗行业,FineVis可以用于患者管理、医疗资源优化和疾病预防。通过对医疗数据的分析和可视化,FineVis可以帮助医疗机构提高服务质量、优化资源配置和降低医疗成本。
在教育行业,FineVis可以用于学生成绩分析、教学质量评估和教育资源分配。通过对教育数据的可视化分析,FineVis可以帮助教育机构改进教学方法、提高教学质量和优化资源配置。在政府和公共部门,FineVis可以用于政策分析、公共服务优化和社会经济发展监测。通过对政府数据的深度分析,FineVis可以帮助政府部门制定科学的政策、提高公共服务质量和促进社会经济发展。
五、FINEVIS的技术特点和优势
FineVis作为一款先进的BI工具,具备多项技术特点和优势。首先,FineVis支持多种数据源,包括关系型数据库、云数据仓库、Excel文件等,用户可以方便地将不同来源的数据导入FineVis进行分析和可视化。其次,FineVis具有强大的数据处理能力,能够处理大规模数据集,确保数据分析的准确性和高效性。
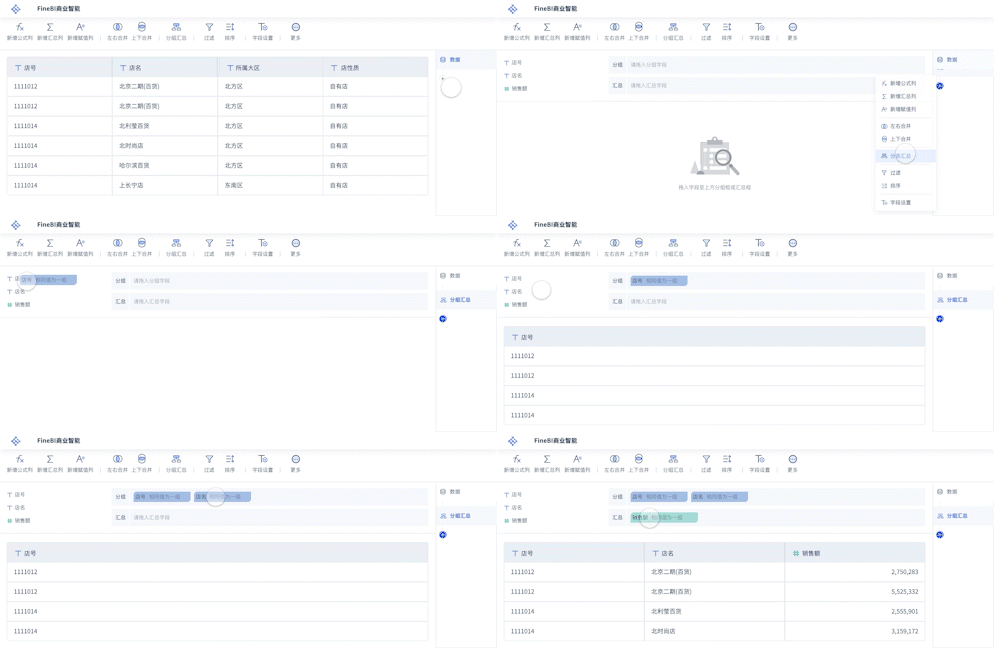
FineVis还具备丰富的图表类型和自定义选项,用户可以根据需求自由选择和调整图表的样式和布局。无论是简单的折线图、柱状图,还是复杂的热力图、散点图,FineVis都能够满足用户的需求。此外,FineVis还支持多维数据分析,用户可以通过拖拽操作轻松实现数据的切片和钻取,从而深入挖掘数据价值。
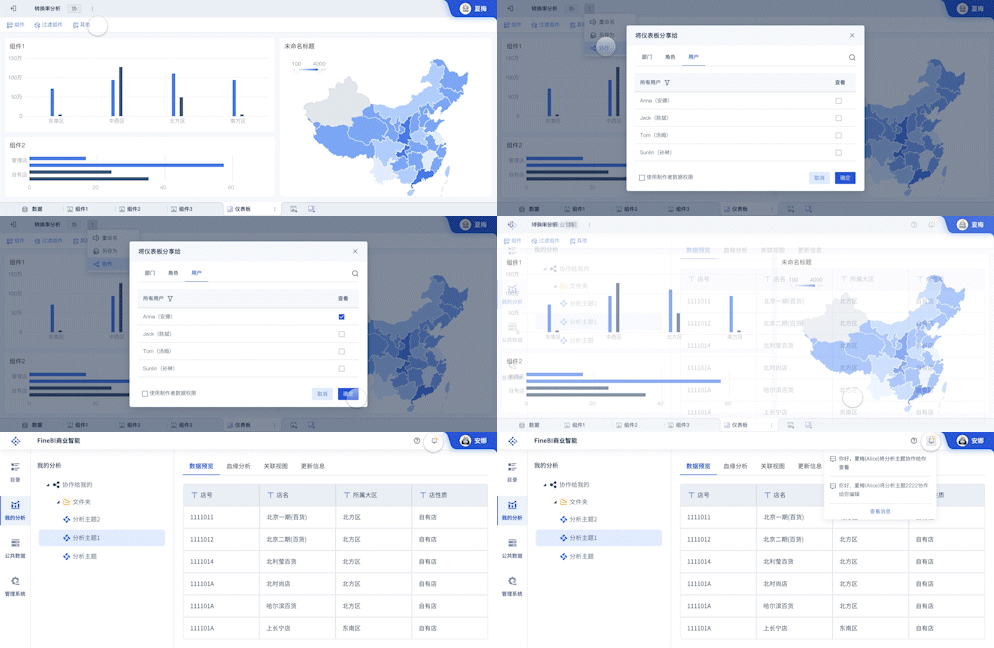
FineVis的操作界面友好,用户无需具备编程基础即可轻松上手。其直观的拖拽式操作和简洁的用户界面,使得数据分析和可视化变得更加简单和高效。FineVis还支持团队协作和数据共享,用户可以将分析结果和可视化图表分享给团队成员或其他部门,从而提高企业的整体数据分析能力。
六、FINEVIS的未来发展趋势
随着数据量的不断增长和数据分析需求的不断提高,FineVis作为一款先进的BI工具,其未来发展趋势值得期待。首先,FineVis将进一步提升数据处理能力,通过引入更多的先进算法和技术,FineVis能够处理更加复杂和大规模的数据集,从而提供更准确和高效的分析结果。其次,FineVis将继续优化用户体验,通过改进操作界面和增加更多的自定义选项,使用户能够更加便捷地进行数据分析和可视化。
FineVis还将进一步扩展数据源支持,除了传统的关系型数据库和云数据仓库,FineVis将支持更多的新型数据源,如物联网数据、社交媒体数据等,从而满足企业在不同场景下的数据分析需求。此外,FineVis将加强与其他企业系统的集成,通过与ERP、CRM、SCM等系统的无缝对接,FineVis能够提供更全面和综合的数据解决方案。
FineVis的未来发展还包括人工智能和机器学习的应用,通过引入AI和ML技术,FineVis能够实现更智能的数据分析和预测。用户可以通过FineVis进行自动化的数据挖掘和预测分析,从而发现潜在的商业机会和风险。此外,FineVis将进一步加强数据安全和隐私保护,通过引入更多的安全机制和技术,确保企业数据的安全性和保密性。
FineReport和FineVis作为帆软旗下的两款重要产品,在未来的发展中将继续发挥其优势,为企业提供更加全面和高效的数据解决方案。访问FineReport官网: https://s.fanruan.com/ryhzq 和FineVis官网: https://s.fanruan.com/7z296 了解更多。
相关问答FAQs:
1. What is the term for report tool in English?
In the realm of data analysis and business intelligence, a report tool is commonly referred to as a "reporting tool" or a "business intelligence tool." These tools are designed to help organizations gather, analyze, and visualize data in the form of reports that can be easily understood and used for decision-making purposes.
2. Why are reporting tools important in the business world?
Reporting tools play a crucial role in the business world as they enable organizations to transform raw data into meaningful insights. By using reporting tools, businesses can generate various types of reports such as financial reports, sales reports, performance reports, and more. These reports provide valuable information that can help companies monitor their performance, identify trends, make informed decisions, and drive business growth.
3. What are some popular reporting tools used in the industry?
There are several popular reporting tools used in the industry, each offering its own unique features and capabilities. Some well-known reporting tools include Microsoft Power BI, Tableau, QlikView, Google Data Studio, and SAP Crystal Reports. These tools provide users with the ability to create interactive dashboards, customize reports, perform data analysis, and share insights with stakeholders.企
4. How do reporting tools enhance data visualization?
Reporting tools enhance data visualization by allowing users to create visually appealing charts, graphs, and dashboards that present data in a clear and easy-to-understand format. Through the use of interactive visualizations, businesses can explore data from different angles, identify patterns, and gain deeper insights into their operations. By visualizing data, organizations can effectively communicate complex information and make data-driven decisions.
5. Can reporting tools help with data integration?
Yes, reporting tools can help with data integration by enabling users to connect to multiple data sources, integrate data from different systems, and create unified reports. By consolidating data from various sources into a single platform, reporting tools allow businesses to analyze information holistically and gain a comprehensive view of their operations. This seamless integration of data enhances reporting accuracy and enables organizations to make more informed decisions based on a complete picture of their data.
6. How do reporting tools support collaboration within an organization?
Reporting tools support collaboration within an organization by providing a centralized platform for sharing reports, insights, and analyses with team members. With reporting tools, users can collaborate in real-time, share interactive dashboards, and work together to interpret data and draw conclusions. This collaborative approach fosters communication, enhances teamwork, and ensures that everyone in the organization is aligned towards common goals based on accurate and up-to-date information.
7. What role do reporting tools play in performance monitoring?
Reporting tools play a critical role in performance monitoring by enabling organizations to track key performance indicators (KPIs), measure progress towards goals, and evaluate the effectiveness of their strategies. Through performance reports and dashboards, businesses can identify areas of strength and weakness, pinpoint opportunities for improvement, and make data-driven adjustments to optimize performance. Reporting tools empower organizations to monitor their performance in real-time and take proactive measures to achieve success.
8. How can reporting tools help businesses make informed decisions?
Reporting tools help businesses make informed decisions by providing them with timely, accurate, and relevant information that is essential for decision-making. By consolidating data, generating insights, and visualizing trends, reporting tools empower organizations to analyze complex scenarios, evaluate options, and choose the best course of action. With the support of reporting tools, businesses can make strategic decisions based on data-driven evidence, rather than relying on intuition or guesswork.
9. What are the benefits of using reporting tools for data analysis?
Using reporting tools for data analysis offers numerous benefits to organizations, including improved data accuracy, enhanced data visualization, streamlined reporting processes, and increased operational efficiency. By leveraging reporting tools, businesses can gain deeper insights into their data, uncover hidden patterns, and extract valuable knowledge that can drive innovation and growth. Reporting tools provide a powerful framework for data analysis, enabling organizations to harness the full potential of their data assets and stay ahead in today's competitive business landscape.
10. How can businesses choose the right reporting tool for their needs?
When selecting a reporting tool for their needs, businesses should consider factors such as ease of use, scalability, integration capabilities, customization options, pricing, and support services. It is essential to evaluate the specific requirements of the organization, the types of reports needed, and the technical expertise of the users before choosing a reporting tool. By conducting thorough research, testing different options, and seeking feedback from users, businesses can identify the right reporting tool that aligns with their objectives and helps them achieve their data analysis goals.
本文内容通过AI工具匹配关键字智能整合而成,仅供参考,帆软不对内容的真实、准确或完整作任何形式的承诺。具体产品功能请以帆软官方帮助文档为准,或联系您的对接销售进行咨询。如有其他问题,您可以通过联系blog@fanruan.com进行反馈,帆软收到您的反馈后将及时答复和处理。


