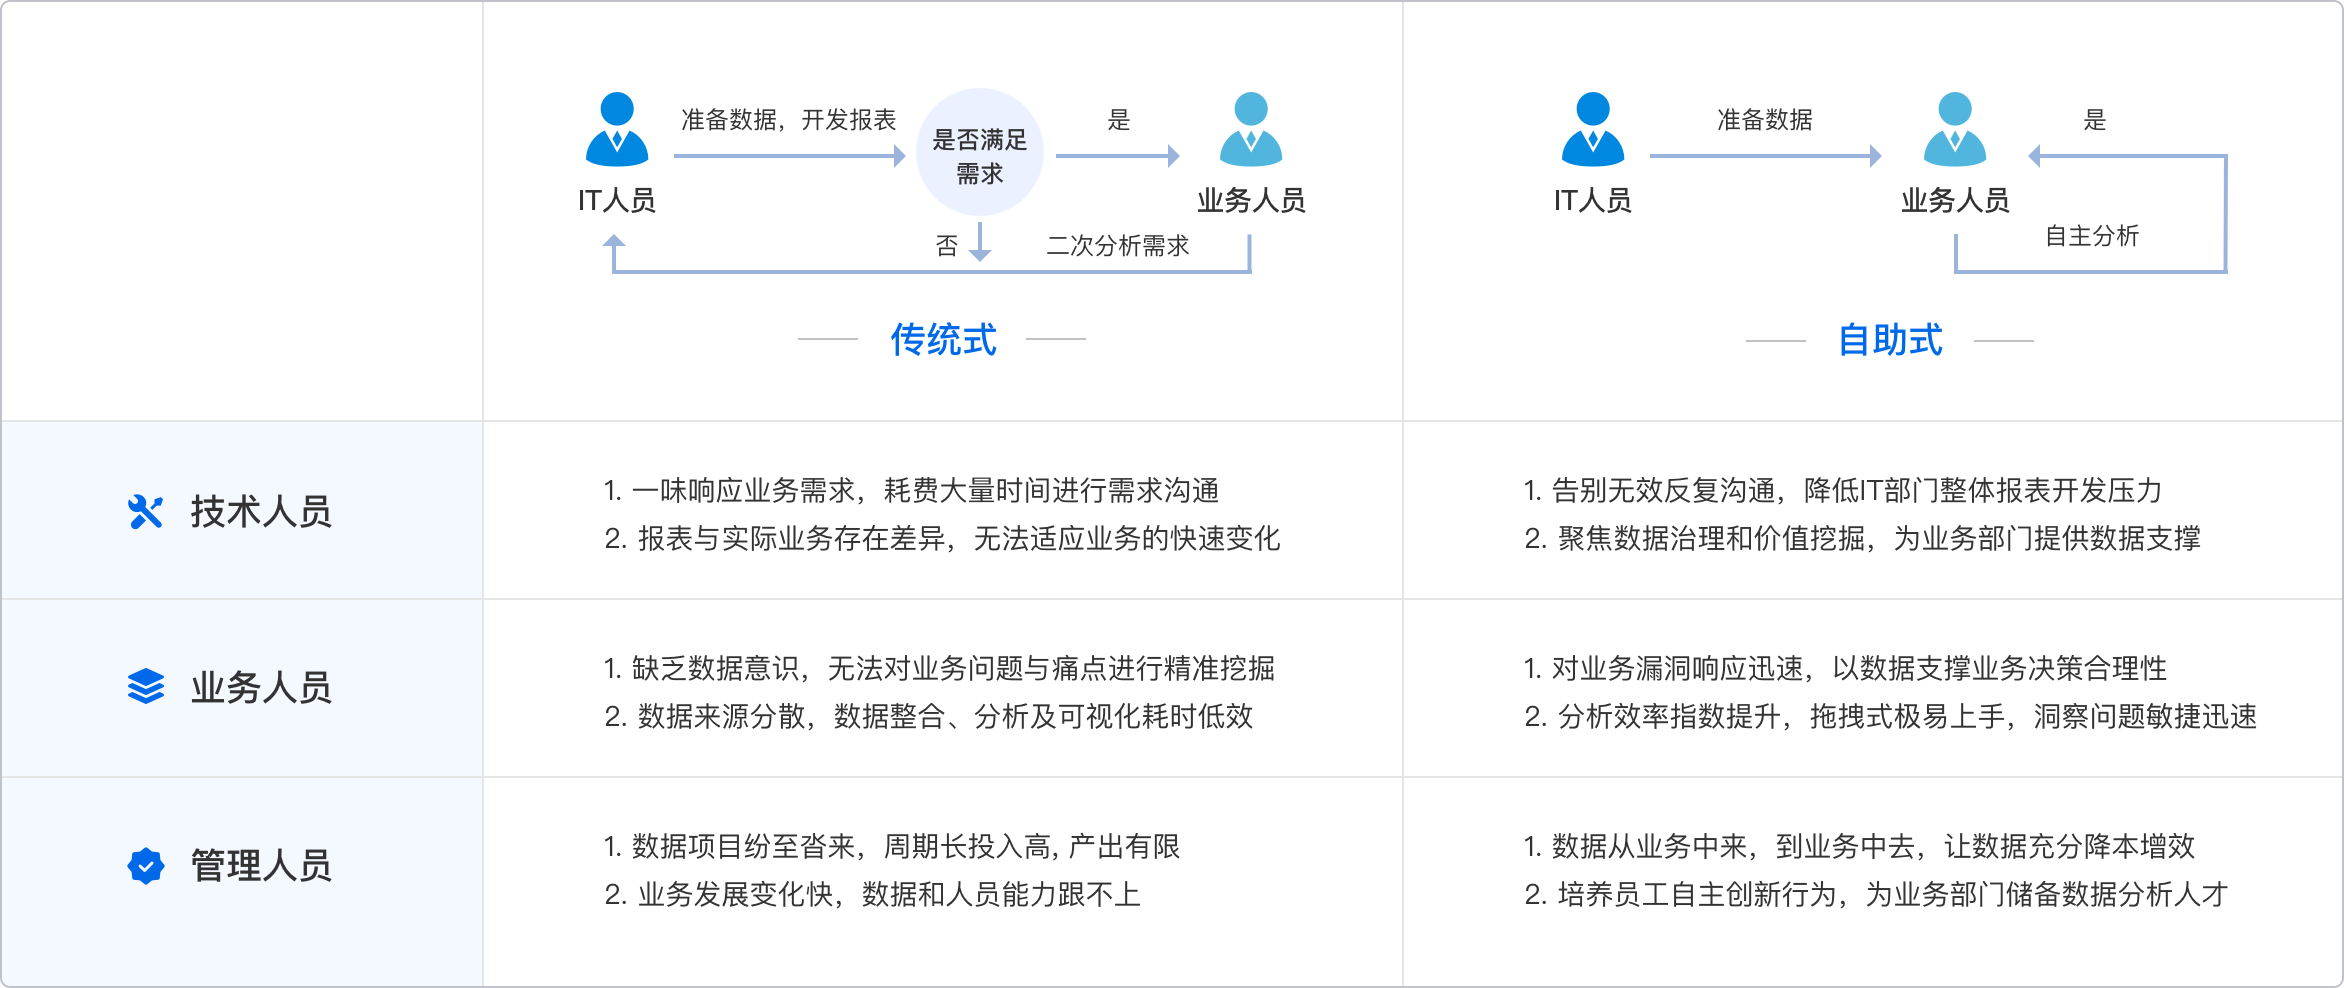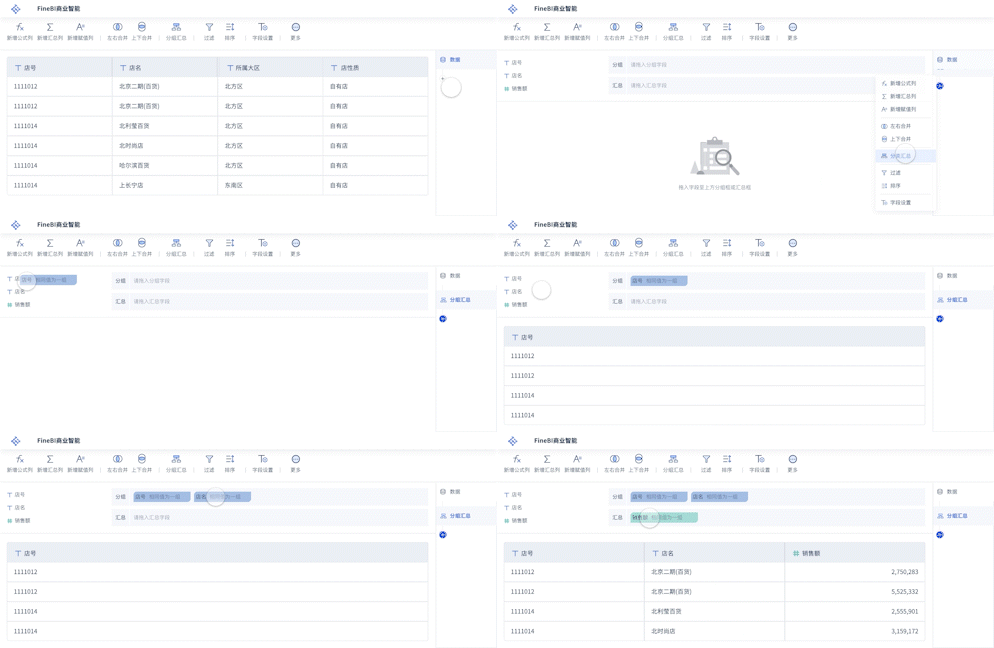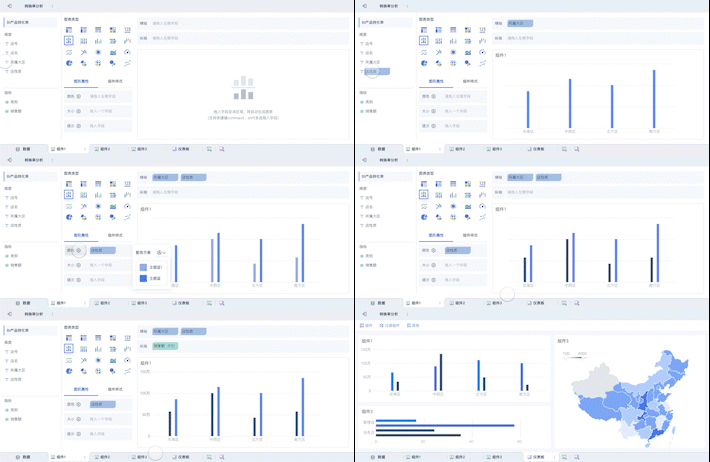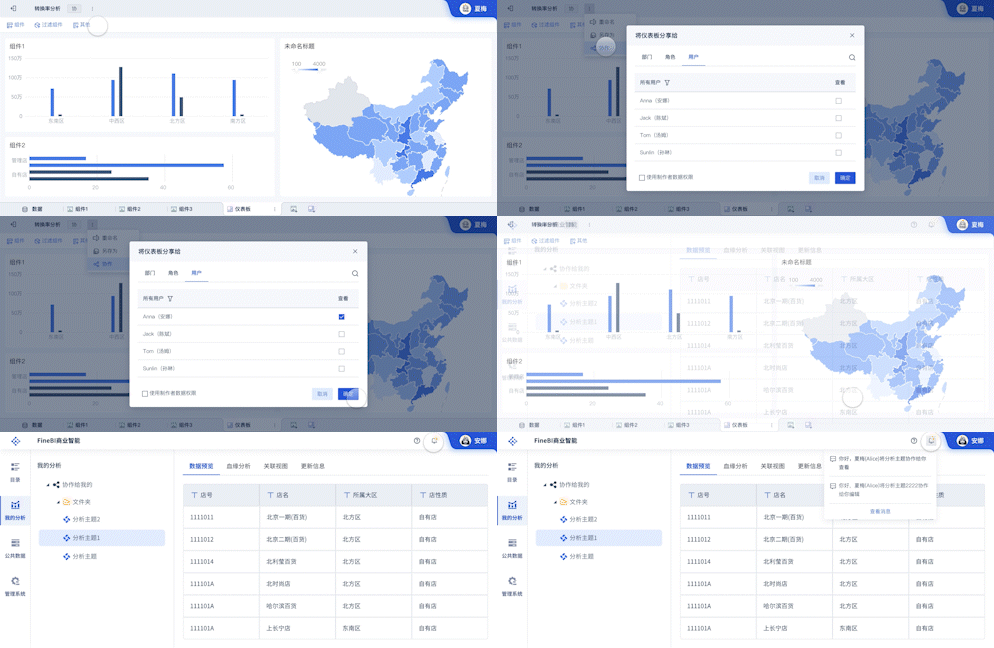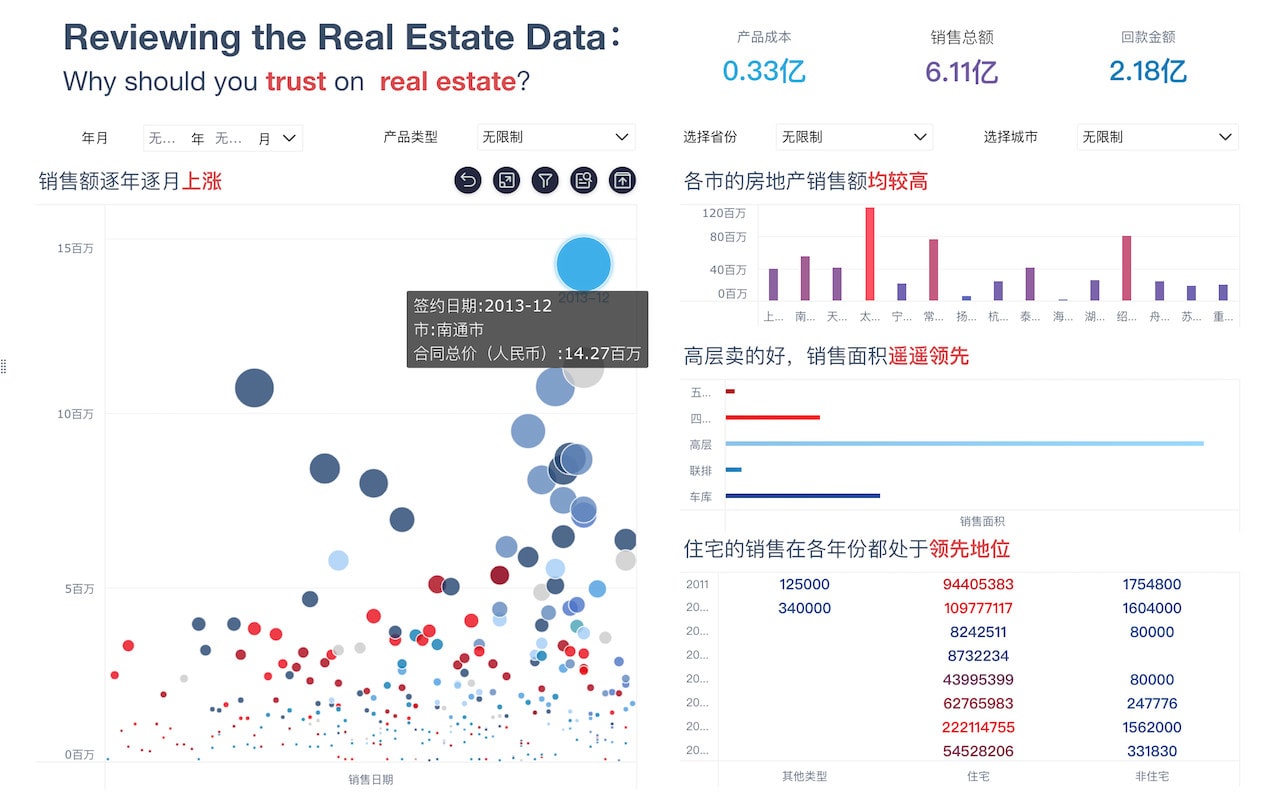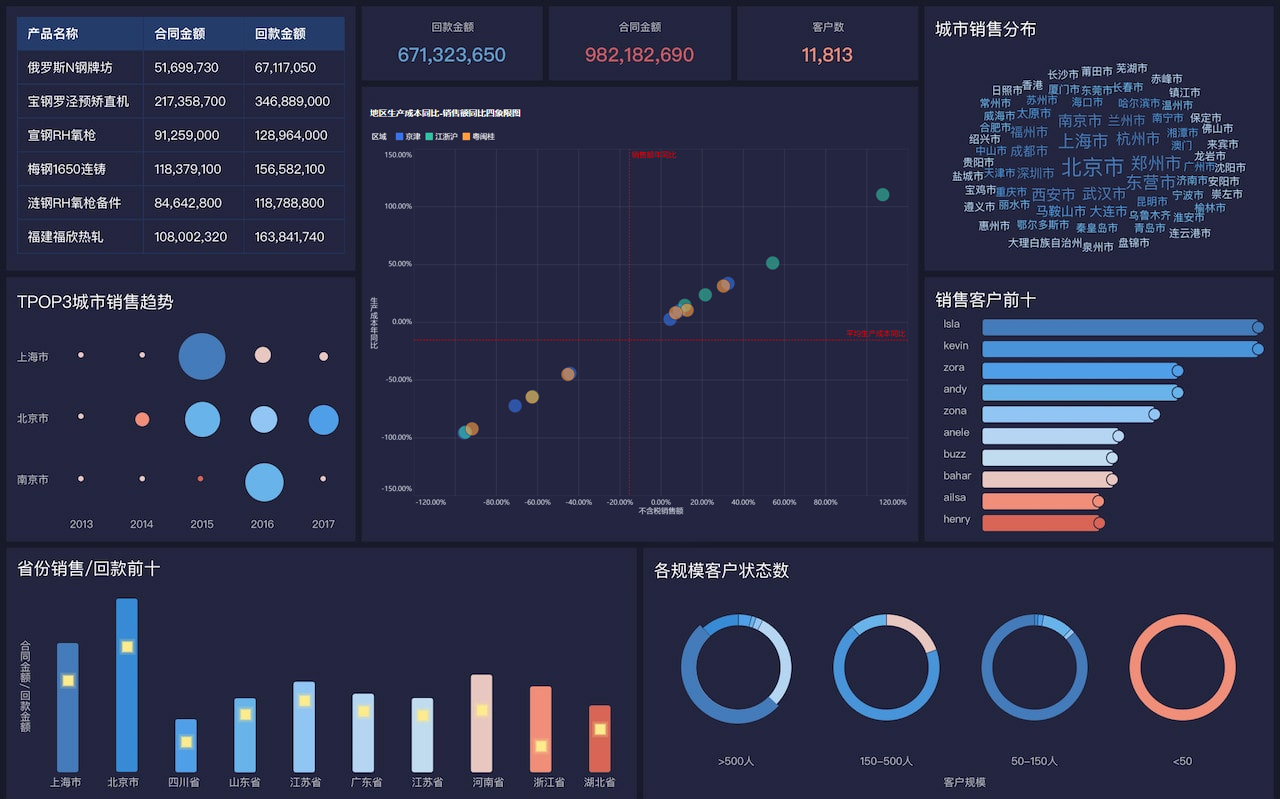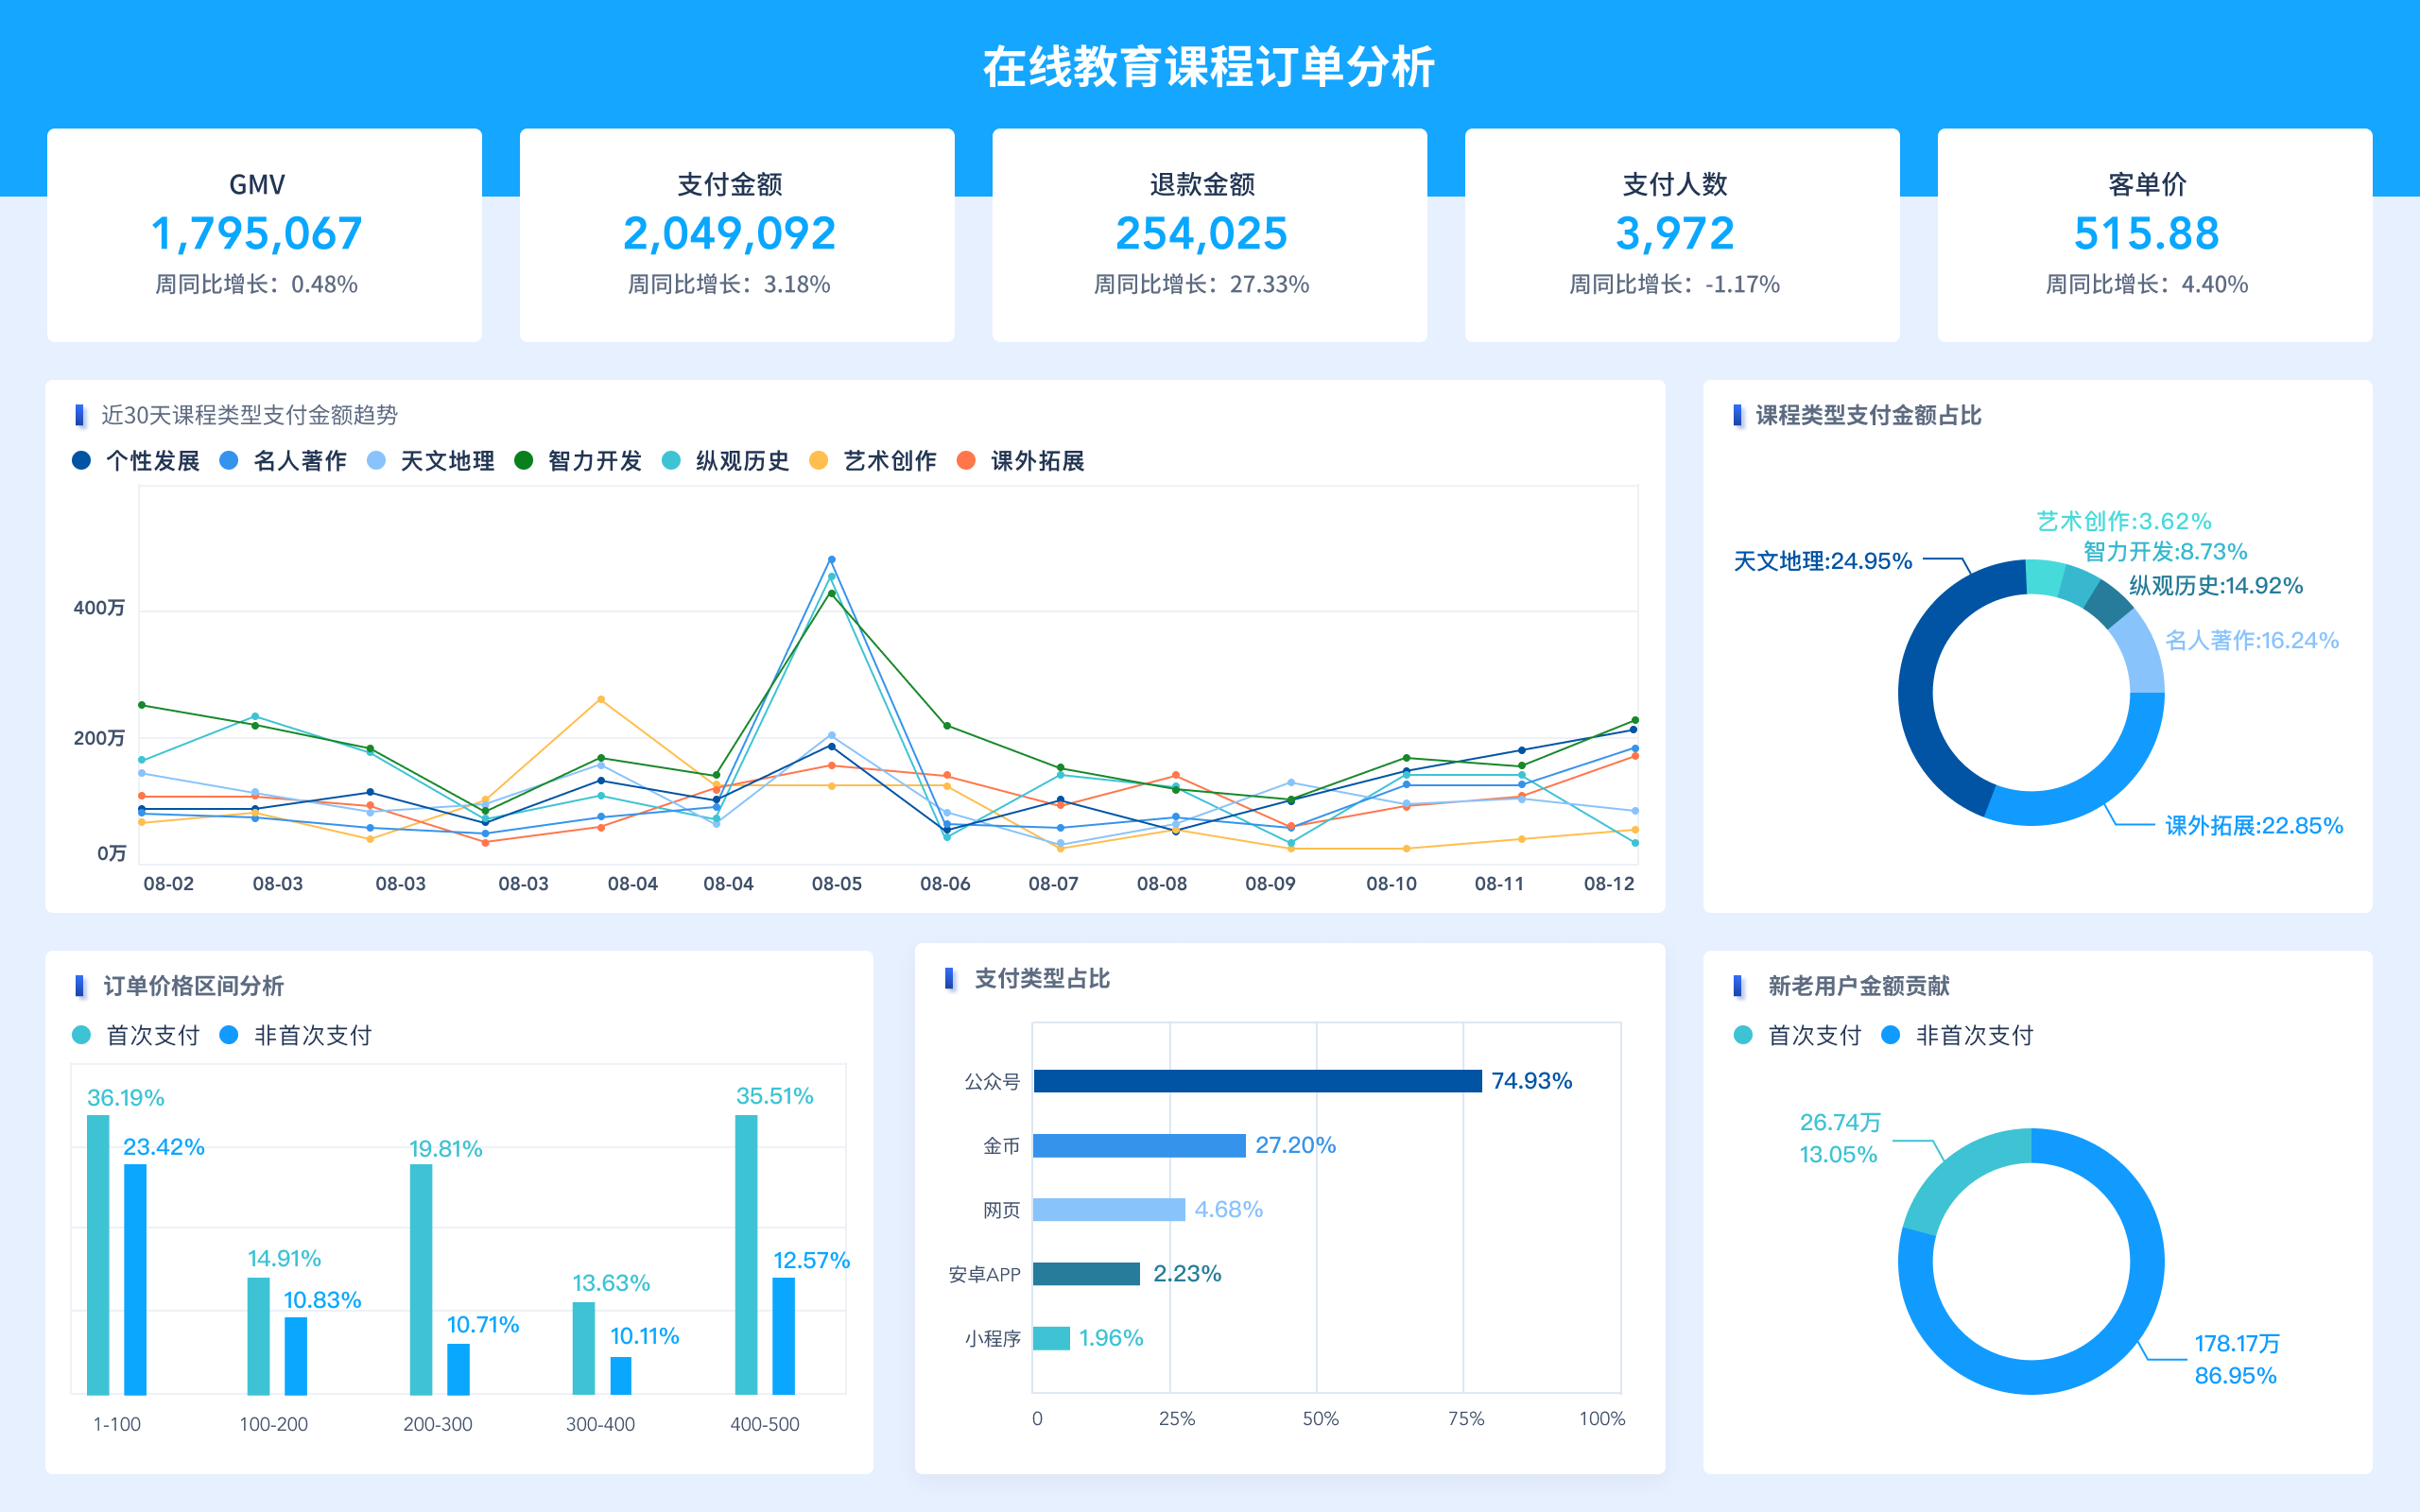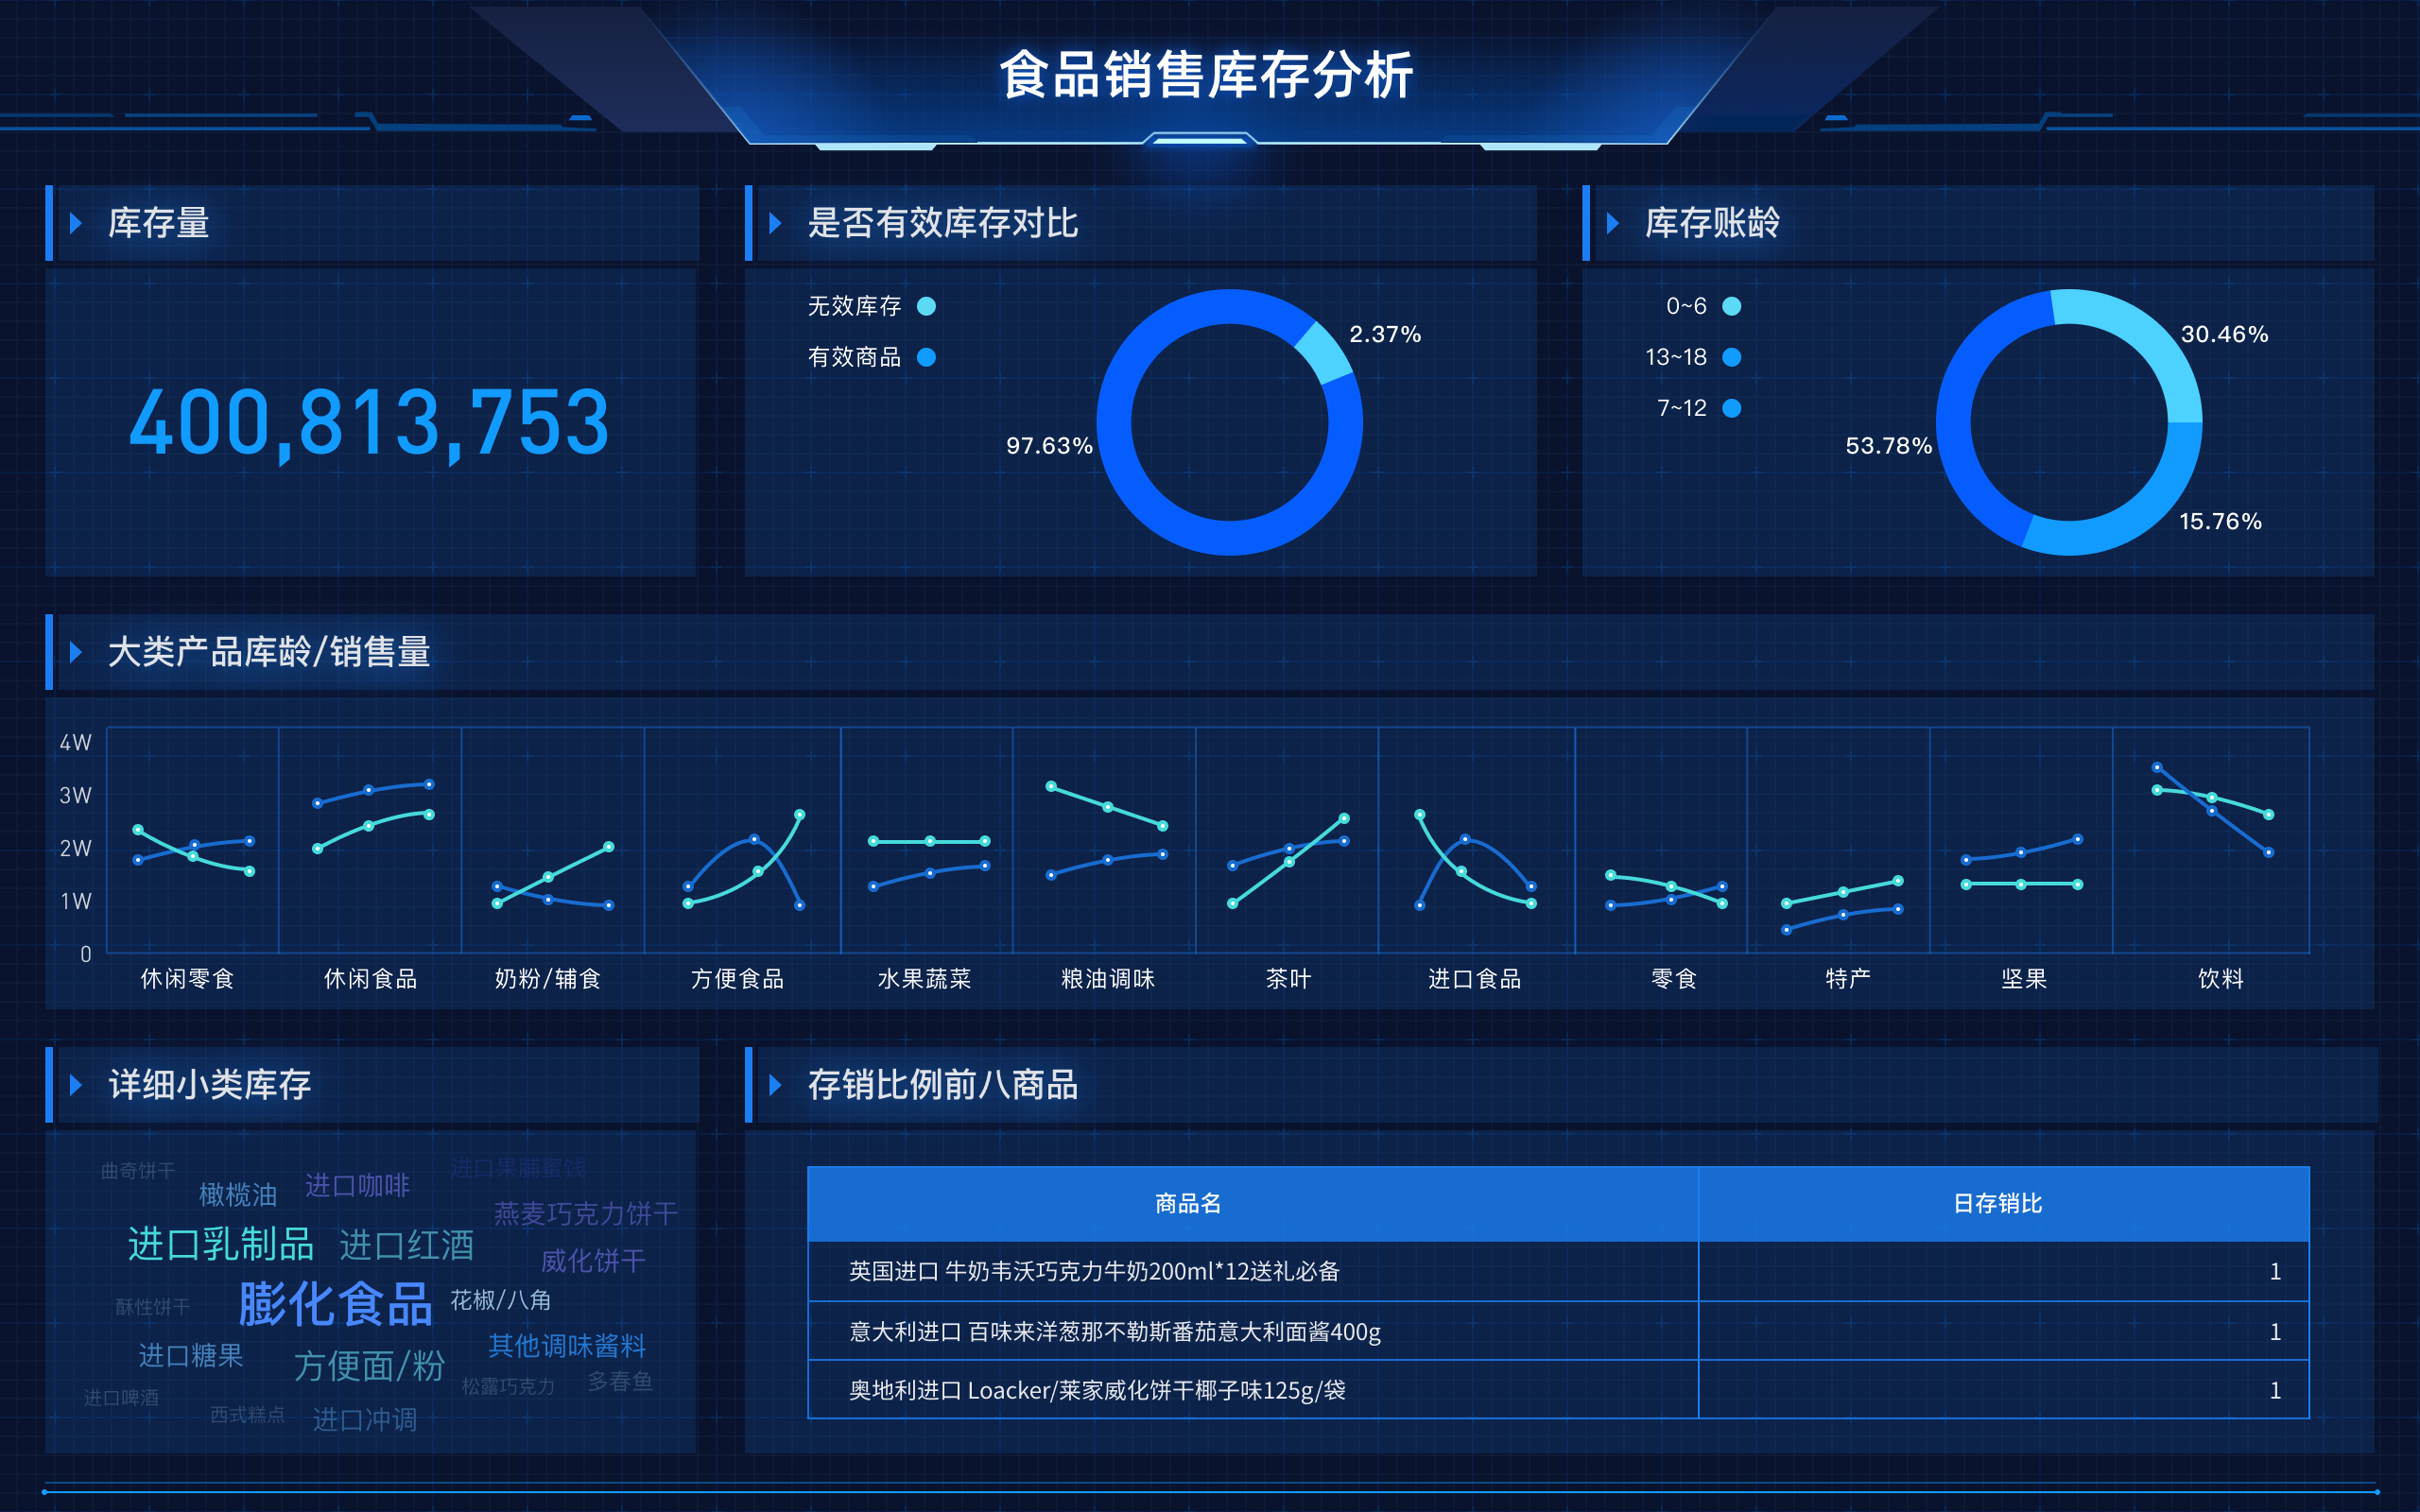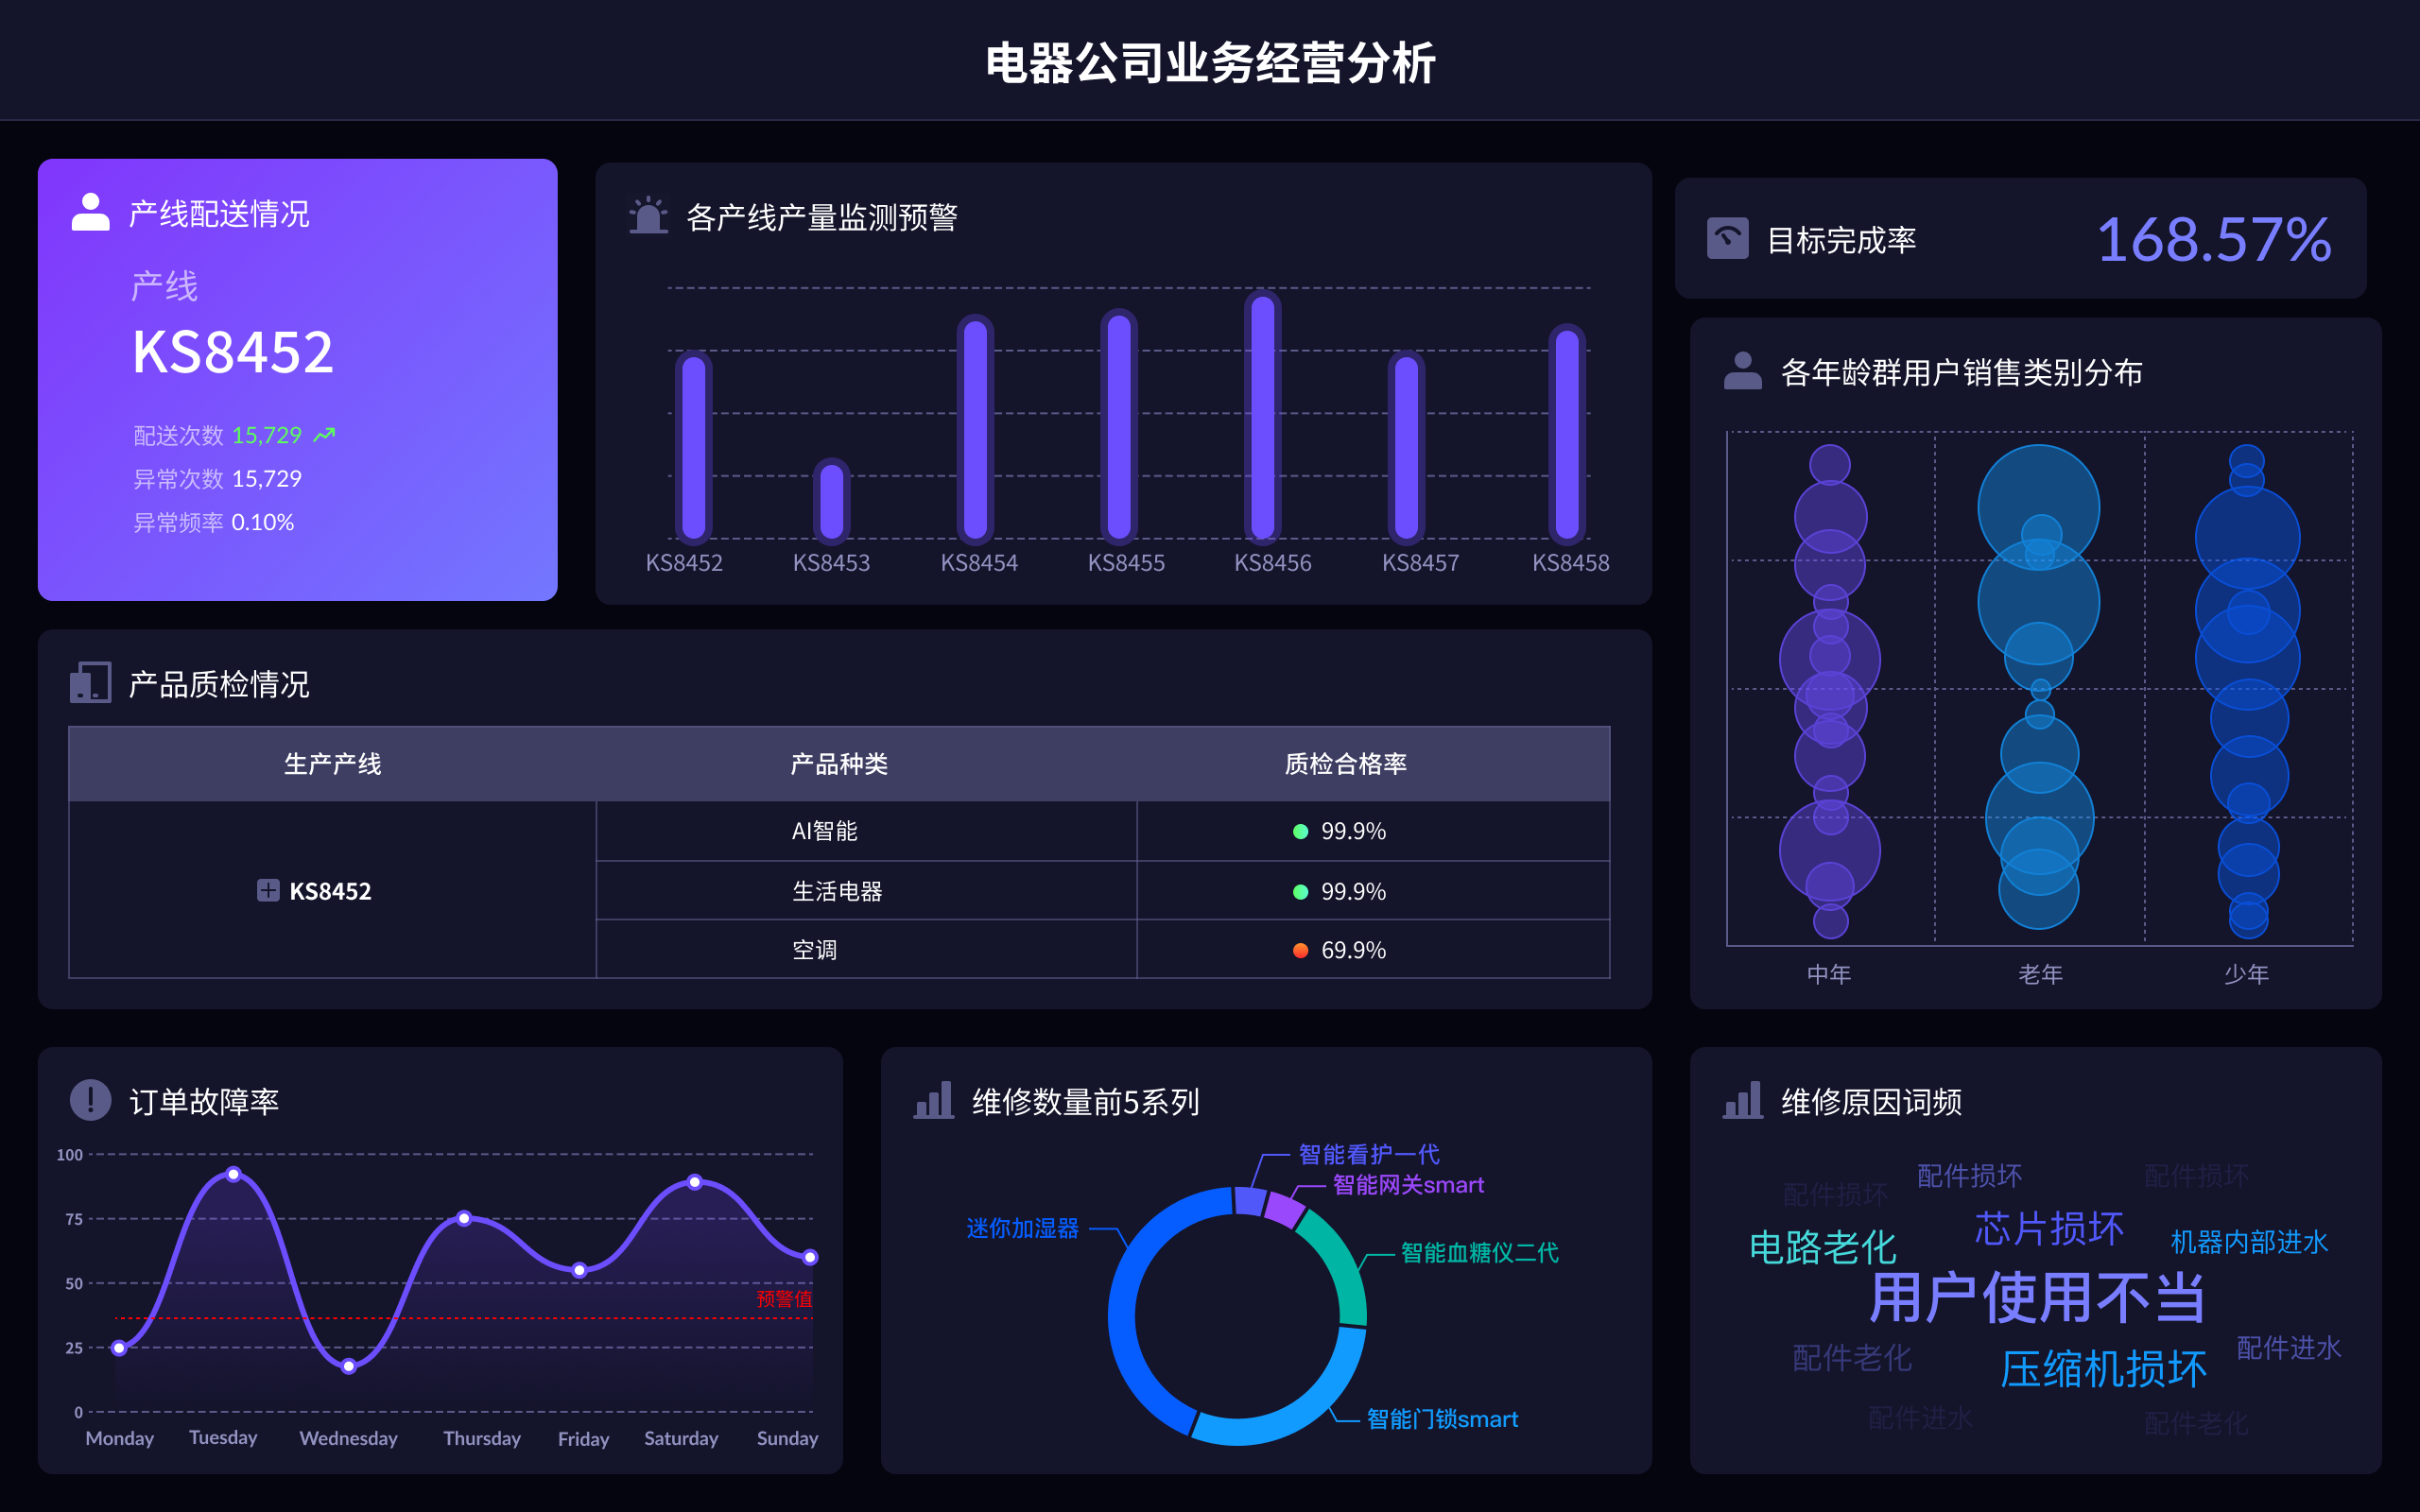
英文数据分析工具有:Tableau、Power BI、R、Python、Excel、FineReport和FineVis。其中,Tableau因其强大的数据可视化功能和用户友好的界面而备受推崇。Tableau允许用户轻松地创建各种类型的图表和仪表板,并且支持与多种数据源的连接,如SQL数据库、Excel文件和Google Analytics等。用户可以通过简单的拖放操作来进行数据分析和可视化,极大地提高了工作效率和分析的准确性。此外,Tableau还提供了强大的社区支持和丰富的在线资源,帮助用户快速上手并解决问题。FineReport和FineVis则是帆软旗下的两款优秀数据分析工具,FineReport专注于企业报表制作,FineVis则提供了强大的数据可视化能力。FineReport官网: https://s.fanruan.com/ryhzq FineVis官网: https://s.fanruan.com/7z296
一、TABLEAU
Tableau是一款领先的数据可视化工具,广泛应用于商业智能和数据分析领域。其主要特点包括用户友好的界面、强大的数据连接能力和丰富的可视化选项。用户可以通过简单的拖放操作创建复杂的图表和仪表板,而无需编写代码。Tableau支持与多种数据源的连接,如SQL数据库、Excel文件、Google Analytics等,使得数据整合变得非常方便。此外,Tableau还提供了丰富的社区资源和在线教程,帮助用户快速上手并解决问题。
Tableau的优势在于其强大的数据处理能力和灵活的可视化选项。用户可以轻松地对数据进行切片、过滤和排序,以发现隐藏的模式和趋势。Tableau还支持实时数据更新,确保用户始终能够访问最新的数据。对于需要进行复杂数据分析的企业和数据科学家来说,Tableau无疑是一个强大的工具。此外,Tableau还提供了强大的API接口,允许开发者将其功能集成到其他应用程序中,进一步扩展其使用范围。
二、POWER BI
Power BI是微软推出的一款商业智能工具,以其强大的数据可视化和报告生成能力而闻名。Power BI允许用户从各种数据源中提取数据,并通过其丰富的可视化选项进行分析和展示。与Tableau类似,Power BI也支持拖放操作,使得数据分析过程变得非常直观和高效。
Power BI的一个显著优势是其与微软其他产品的无缝集成,如Excel、Azure和SharePoint。这使得用户可以轻松地将数据从这些平台导入Power BI,并进行进一步的分析和可视化。此外,Power BI还提供了强大的数据建模功能,允许用户创建复杂的数据关系和计算。Power BI的另一大特点是其强大的实时数据处理能力,用户可以创建实时仪表板,实时监控关键业务指标。对于那些已经在使用微软生态系统的企业来说,Power BI无疑是一个理想的选择。
三、R和PYTHON
R和Python是两种广泛使用的数据分析编程语言,各自有其独特的优势和应用场景。R语言主要用于统计分析和数据可视化,而Python则因其广泛的应用范围和丰富的库支持而备受欢迎。
R语言以其强大的统计分析能力和丰富的数据可视化选项而著称。它提供了大量的统计函数和图形库,允许用户进行复杂的数据分析和可视化。R语言的优势在于其专注于统计分析,使得用户可以轻松地进行各种类型的数据分析,如回归分析、时间序列分析和聚类分析等。此外,R语言还支持与多种数据源的连接,如SQL数据库、Excel文件和CSV文件等。
Python是一种通用编程语言,以其简洁的语法和广泛的应用范围而闻名。Python拥有丰富的数据分析库,如Pandas、NumPy和SciPy等,使得数据处理变得非常高效。Python还拥有强大的机器学习库,如Scikit-Learn和TensorFlow,使得用户可以轻松地进行机器学习和预测分析。Python的优势在于其灵活性和可扩展性,用户可以轻松地将其功能集成到其他应用程序中。此外,Python还支持与多种数据源的连接,如SQL数据库、Excel文件和API接口等,极大地扩展了其应用范围。
四、EXCEL
Excel是微软推出的一款电子表格软件,广泛应用于数据分析、报表生成和数据可视化等领域。Excel的优势在于其易用性和广泛的功能支持。用户可以通过简单的公式和函数对数据进行处理和分析,而无需编写复杂的代码。Excel还提供了丰富的图表选项,允许用户创建各种类型的图表,以直观地展示数据。
Excel的一个显著优势是其强大的数据处理能力和灵活的公式支持。用户可以使用Excel的各种函数和公式对数据进行复杂的计算和分析,如SUM、AVERAGE、VLOOKUP和IF等。此外,Excel还支持宏和VBA编程,允许用户创建自定义的函数和自动化任务,进一步提高工作效率。Excel的另一大特点是其广泛的应用范围,几乎所有的企业和个人用户都在使用Excel进行数据处理和分析,这使得其成为一个非常重要的数据分析工具。
五、FINEREPORT
FineReport是帆软旗下的一款企业级报表工具,专注于报表制作和数据可视化。FineReport的优势在于其强大的报表设计功能和灵活的数据连接能力。用户可以通过简单的拖放操作创建各种类型的报表,如表格报表、图表报表和仪表板等,而无需编写代码。FineReport支持与多种数据源的连接,如SQL数据库、Excel文件和CSV文件等,使得数据整合变得非常方便。
FineReport的一个显著优势是其强大的报表设计功能。用户可以使用FineReport的可视化报表设计器,通过拖放操作轻松创建复杂的报表。FineReport还支持各种数据处理和计算功能,如汇总、分组和排序等,使得数据分析变得非常高效。此外,FineReport还提供了丰富的图表选项,允许用户创建各种类型的图表,以直观地展示数据。对于需要进行复杂报表制作和数据分析的企业来说,FineReport无疑是一个强大的工具。FineReport官网: https://s.fanruan.com/ryhzq
六、FINEVIS
FineVis是帆软旗下的一款数据可视化工具,专注于数据可视化和商业智能。FineVis的优势在于其强大的数据可视化功能和用户友好的界面。用户可以通过简单的拖放操作创建各种类型的图表和仪表板,而无需编写代码。FineVis支持与多种数据源的连接,如SQL数据库、Excel文件和API接口等,使得数据整合变得非常方便。
FineVis的一个显著优势是其强大的数据可视化功能。用户可以使用FineVis的可视化设计器,通过拖放操作轻松创建复杂的图表和仪表板。FineVis还支持各种数据处理和计算功能,如汇总、分组和排序等,使得数据分析变得非常高效。此外,FineVis还提供了丰富的图表选项,允许用户创建各种类型的图表,以直观地展示数据。FineVis的另一大特点是其用户友好的界面,使得用户可以快速上手并进行数据分析和可视化。对于需要进行复杂数据可视化和商业智能分析的企业来说,FineVis无疑是一个强大的工具。FineVis官网: https://s.fanruan.com/7z296
七、其他工具
除了上述工具外,还有其他一些值得关注的数据分析工具,如QlikView、SAP BusinessObjects和Looker等。这些工具各自有其独特的优势和应用场景,可以满足不同企业和用户的需求。
QlikView是一款商业智能工具,以其强大的数据处理能力和灵活的可视化选项而闻名。QlikView允许用户对数据进行切片、过滤和排序,以发现隐藏的模式和趋势。QlikView还支持与多种数据源的连接,如SQL数据库、Excel文件和API接口等,使得数据整合变得非常方便。
SAP BusinessObjects是一款企业级商业智能工具,专注于报表制作和数据分析。SAP BusinessObjects提供了丰富的报表选项和强大的数据处理功能,允许用户对数据进行复杂的计算和分析。SAP BusinessObjects还支持与多种数据源的连接,如SQL数据库、Excel文件和SAP系统等,使得数据整合变得非常方便。
Looker是一款现代数据分析平台,以其强大的数据建模功能和用户友好的界面而闻名。Looker允许用户创建复杂的数据模型和计算,以进行深入的数据分析。Looker还支持与多种数据源的连接,如SQL数据库、Excel文件和API接口等,使得数据整合变得非常方便。对于需要进行复杂数据分析和商业智能的企业来说,这些工具无疑是强大的选择。
这些数据分析工具各自有其独特的优势和应用场景,可以根据企业的具体需求选择合适的工具。Tableau和Power BI适合需要强大数据可视化和商业智能的企业,R和Python适合需要进行复杂统计分析和机器学习的用户,Excel适合进行简单数据处理和报表生成,FineReport和FineVis适合需要进行复杂报表制作和数据可视化的企业。通过合理选择和使用这些工具,企业可以显著提高数据分析的效率和准确性,进而做出更加明智的决策。
相关问答FAQs:
1. What are some popular English data analysis tools available in the market?
When it comes to data analysis, there are several popular English data analysis tools that are widely used by professionals across various industries. Some of the most well-known tools include:
-
Microsoft Excel: Excel is one of the most widely used data analysis tools globally. It offers a wide range of functions and features that allow users to perform basic to advanced data analysis tasks, including calculations, data visualization, and statistical analysis.
-
Tableau: Tableau is a powerful data visualization tool that enables users to create interactive and visually appealing dashboards and reports. It supports a wide range of data sources and allows for easy data exploration and analysis.
-
R: R is a popular programming language and environment for statistical computing and graphics. It offers a wide range of statistical and graphical techniques and is widely used for data analysis, statistical modeling, and visualization.
-
Python: Python is a versatile programming language that is widely used for data analysis, machine learning, and artificial intelligence. It offers a wide range of libraries and tools, such as Pandas, NumPy, and Matplotlib, that make data analysis tasks more efficient and manageable.
-
SPSS: SPSS (Statistical Package for the Social Sciences) is a software package used for statistical analysis. It offers a user-friendly interface and a wide range of statistical tools for data analysis, hypothesis testing, and data visualization.
-
SAS: SAS (Statistical Analysis System) is a software suite used for advanced analytics, multivariate analysis, and predictive modeling. It is widely used in industries such as healthcare, finance, and marketing for data analysis and decision-making.
2. How do these English data analysis tools differ from each other?
Each of the English data analysis tools mentioned above has its own strengths and features that differentiate it from the others. Here are some key differences between these tools:
-
Microsoft Excel: Excel is known for its user-friendly interface and ease of use, making it a popular choice for beginners and professionals alike. It is suitable for basic to moderate data analysis tasks and is widely available as part of the Microsoft Office suite.
-
Tableau: Tableau is known for its powerful data visualization capabilities, allowing users to create interactive dashboards and reports with ease. It is ideal for users who need to present data in a visually appealing and interactive format.
-
R: R is a programming language that is highly customizable and extensible, making it a popular choice for statisticians and data scientists. It offers a wide range of statistical and graphical tools and is ideal for advanced data analysis tasks.
-
Python: Python is a versatile programming language that is widely used for data analysis, machine learning, and artificial intelligence. It is known for its simplicity and readability, making it a popular choice for beginners and experienced programmers alike.
-
SPSS: SPSS is known for its user-friendly interface and wide range of statistical tools, making it a popular choice for researchers and social scientists. It is ideal for tasks such as data cleaning, hypothesis testing, and regression analysis.
-
SAS: SAS is a comprehensive software suite that offers a wide range of tools for advanced analytics and predictive modeling. It is known for its scalability and reliability, making it a popular choice for large organizations and industries with complex data analysis needs.
3. How can I choose the right English data analysis tool for my needs?
Choosing the right English data analysis tool for your needs depends on various factors, including your level of expertise, the complexity of your data analysis tasks, and your budget. Here are some tips to help you choose the right tool:
-
Consider your requirements: Determine the specific data analysis tasks you need to perform and the features you require in a data analysis tool. For example, if you need to create visually appealing dashboards, Tableau may be the right choice for you.
-
Evaluate your expertise: Consider your level of expertise in data analysis and programming. If you are new to data analysis, you may prefer a tool like Excel or Tableau, which have user-friendly interfaces and require minimal programming knowledge.
-
Assess scalability and flexibility: If you anticipate that your data analysis needs will grow over time, consider choosing a tool like R, Python, or SAS, which offer scalability and flexibility for handling complex data analysis tasks.
-
Check compatibility: Ensure that the data analysis tool you choose is compatible with the data sources and systems you work with. Some tools may have limitations in terms of data formats and integration with other software.
-
Consider cost: Evaluate the cost of the data analysis tool, including any licensing fees, subscription costs, or additional features that may require a separate purchase. Choose a tool that fits within your budget and offers good value for money.
By considering these factors and exploring the features of each English data analysis tool, you can make an informed decision and choose the right tool that meets your data analysis needs effectively.
本文内容通过AI工具匹配关键字智能整合而成,仅供参考,帆软不对内容的真实、准确或完整作任何形式的承诺。具体产品功能请以帆软官方帮助文档为准,或联系您的对接销售进行咨询。如有其他问题,您可以通过联系blog@fanruan.com进行反馈,帆软收到您的反馈后将及时答复和处理。


